Associations between diabetic retinopathy and systemic risk factors

Hong Kong Med J 2016 Dec;22(6):589–99 | Epub 24 Oct 2016
DOI: 10.12809/hkmj164869
© Hong Kong Academy of Medicine. CC BY-NC-ND 4.0
 
REVIEW ARTICLE  CME
Associations between diabetic retinopathy and systemic risk factors
Noel Wat, MB, ChB, BSc1; Raymond LM Wong, MB, BS, MRCSEd(Ophth)1,2; Ian YH Wong, MB, BS, FRCOphth3
1 Department of Ophthalmology and Visual Sciences, The Chinese University of Hong Kong, Shatin, Hong Kong
2 Hong Kong Eye Hospital, Argyle Street, Hong Kong
3 Department of Ophthalmology, The University of Hong Kong, Pokfulam, Hong Kong
 
Corresponding author: Dr Raymond LM Wong (raymondwlm@hotmail.com)
 
 
 Full paper in PDF
 
Abstract
Introduction: Diabetes mellitus is a systemic disease with complications that include sight-threatening diabetic retinopathy. It is essential to understand the risk factors of diabetic retinopathy before effective prevention can be implemented. The aim of this review was to examine the association between diabetic retinopathy and systemic risk factors.
 
Methods: A PubMed literature search was performed up to May 2016 to identify articles reporting associations between diabetic retinopathy and systemic risk factors; only publications written in English were included. Relevant articles were selected and analysed.
 
Results: Patients with diabetic retinopathy were more likely to have poor glycaemic control as reflected by a higher glycated haemoglobin, longer duration of diabetes, and use of insulin therapy for treatment. For other systemic risk factors, hypertension was positively associated with prevalence and progression of diabetic retinopathy. No clear association between obesity, hyperlipidaemia, gender, or smoking with diabetic retinopathy has been established as studies reported inconsistent findings. Myopia was a protective factor for the development of diabetic retinopathy. Several genetic polymorphisms were also found to be associated with an increased risk of development of diabetic retinopathy.
 
Conclusions: Good glycaemic and blood pressure control remain the most important modifiable risk factors to reduce the risk of progression of diabetic retinopathy and vision loss.
 
 
Introduction
Diabetic retinopathy is the leading cause of blindness in adults living in developed countries.1 Almost all patients with type 1 diabetes mellitus (DM) and more than 60% of patients with type 2 DM will develop some degree of retinopathy after a 20-year history of diabetes.2 It has also been well established that DM increases the risk of cardiovascular disease.3 Cheng et al4 found that the prevalence of diabetic retinopathy associated with one, two, three, or four cardiometabolic risk factors was 16.0%, 17.6%, 21.3%, or 25.1%, respectively (P=0.001). This implies a relationship between systemic health conditions and diabetic retinopathy. In order to help identify and to prevent progression of this ophthalmic complication of diabetes, a better understanding of its association with systemic risk factors is necessary.
 
Methods
A PubMed literature search was conducted up to May 2016 using the following key words: “diabetic retinopathy”, “prevalence”, “epidemiology”, “systemic associations”, “risk factors”, “diabetic control”, “HbA1c”, “blood glucose”, “hypertension”, “hyperlipidaemia”, “cholesterol”, “obesity”, “smoking”, “myopia”, and “genetics”. Articles reporting systemic associations of diabetic retinopathy were selected and analysed. A search through the references of the retrieved articles was also performed. Only articles published in English were reviewed. During selection of the articles, prospective studies had a higher ranking than retrospective ones.
 
Results
Prevalence of diabetic retinopathy in diabetic patients
Approximately a quarter to one third of adults living with diabetes are reported to have diabetic retinopathy. In a recent systematic literature review, Yau et al5 estimated that the overall global prevalence of diabetic retinopathy was 34.6%. The Multi-Ethnic Study of Atherosclerosis (MESA) reported a prevalence of 33.2% in adults within the US population.6 A more recent study of the US population reports a lower prevalence of diabetic retinopathy of 28.5%.7
 
Within the Caucasian population in the US, the prevalence of diabetic retinopathy ranges from 24.8% to 26.4%.6 7 This is comparable with studies in western Europe with largely Caucasian populations, such as in the Gutenberg Health Study in Germany with a prevalence of 21.7%8 and Tromsø Eye Study in Norway with a prevalence of 26.8%.9
 
Multiple studies have reported a higher prevalence of diabetic retinopathy in black and Hispanic populations. Studies performed in the US reported a prevalence of 36.7%6 and 38.8%7 in African American populations. Additionally, the Los Angeles Latino Eye Study (LALES) reported that 46% of Hispanic Americans with type 2 DM had diabetic retinopathy.10 The MESA study6 and a more recent study by Zhang et al7 reported a lower prevalence of 37.4% and 34.0%, respectively in the Hispanic American population.
 
There is considerable variation in prevalence rates of diabetic retinopathy within the Chinese population. The prevalence in Hong Kong has been reported between 28.4% and 39.2% in different studies.11 12 13 A more recent study by Lian et al14 on a local screening programme for diabetic retinopathy reported a prevalence rate of 39.0% (95% confidence interval [CI], 38.8%-39.2%) in Hong Kong. Chen et al15 reported a prevalence of 35.0% in Taiwanese diabetic patients. Similarly, the comprehensive Beijing Eye Study covering both urban and rural Chinese populations reported a prevalence of 37%,16 in comparison with the Handan Eye Study focusing on rural China that reported a higher prevalence of 43.1%.17 The MESA study included data on Chinese Americans and reported a prevalence rate of 25.7%, comparable with their Caucasian counterparts.6
 
Differences in prevalence rates of diabetic retinopathy between populations may be due to both genetic factors and access to health care. Moreover, ethnicity is complex and multifactorial; alone it may not fully explain the differences in prevalence rates of diabetic retinopathy reported. Urbanisation and socio-economic status may also play a role in the prevalence of diabetic retinopathy.18 Additionally, discrepancies between studies of diabetic retinopathy prevalence may depend on several factors including study methodology. Some studies may have used different cut-off values for glycated haemoglobin (HbA1c), oral glucose tolerance test, and spot glucose to define a diagnosis of DM, thereby increasing the heterogeneity in the overall study population. The method of diabetic retinopathy screening and reporting logistics also varied among studies. For studies using retinal photographs as screening tools, the differences in the number of fundus photographs taken and whether pupil dilatation was performed before retinal assessment may have influenced the number of cases of diabetic retinopathy identified.
 
Classification of diabetic retinopathy
The Early Treatment Diabetic Retinopathy Study (ETDRS) Diabetic Retinopathy Grading Scale (Modified Airlie House) and International Clinical Diabetic Retinopathy (ICDR) Severity Scale are the two major and most commonly used classification systems for diabetic retinopathy. The ETDRS Grading Scale is more commonly used in research contexts whereas the ICDR Severity Scale is more commonly used in the clinical context. Additionally, the United Kingdom National Screening Committee (UK NSC) diabetic retinopathy grading system is notable for its widespread use in digital fundus photo screening programmes worldwide.
 
In general, diabetic retinopathy can be classified as non-proliferative or proliferative. Non-proliferative can then be further classified by severity ranging from mild to moderate and severe. Non-proliferative diabetic retinopathy (NPDR) is characterised by the presence of microaneurysms, hard exudates, cotton-wool spots, and/or retinal haemorrhages. Pre-proliferative diabetic retinopathy changes include vasculopathies such as intraretinal microvascular abnormality (IRMA) whereas proliferative diabetic retinopathy is defined by the presence of neovascularisation or vitreous haemorrhage or preretinal haemorrhage.
 
The ETDRS Diabetic Retinopathy Grading Scale assigns a retinopathy severity score from level 10 to 85. If no abnormality is found, ETDRS level 10 is assigned. If only microaneurysms are present, ETDRS level 20 (very mild NPDR) is assigned. The ETDRS level 35 is equivalent to mild NPDR, and is characterised by the presence of hard exudates, cotton-wool spots, and/or mild retinal haemorrhages. Standard retinal photographs of retinal haemorrhages and IRMA are used to define moderate and severe NPDR in the ETDRS grading. The number of quadrants in which those signs are present is also taken into account. In contrast, a simple 4-2-1 rule is used in the ICDR Severity Scale: mild NPDR is defined as the presence of microaneurysms only. Severe NPDR is diagnosed when there are ≥20 diffuse intraretinal haemorrhages and/or microaneurysms in all four quadrants, venous beading in at least two quadrants, or intraretinal microvascular abnormalities in at least one quadrant. Moderate NPDR on the other hand has severity falling below the 4-2-1 rule but more than merely microaneurysms. In both grading scales, proliferative diabetic retinopathy is defined as the presence of neovascularisation. High-risk and advanced proliferative diabetic retinopathy (ETDRS level, 71-85) refers to the presence of neovascularisation complications including preretinal haemorrhage, vitreous haemorrhage, or retinal detachment.19
 
Under the UK NSC diabetic retinopathy screening system, fundus photos are given a letter and numerical grading: R0 is assigned if no abnormality is found; R1 is given in early diabetic retinopathy with evidence of microaneurysms, retinal haemorrhage, or other features of diabetic retinopathy; R2 and R3 ratings are assigned in pre-proliferative and proliferative diabetic retinopathy, respectively. M1 is designated in cases with maculopathy, the presence of which is used to predict the presence of clinically significant macular oedema that requires treatment. P1 is assigned if the fundus photograph shows evidence of previous panretinal laser photocoagulation. Accordingly M0 and P0 are given respectively if the above characteristics are absent. Finally, a grading of U is given if an image is regarded as ungradable,20 common reasons include dense cataract and corneal scars.
 
Diabetes and diabetic retinopathy
Glycaemic control
Glycated haemoglobin is a commonly used marker for monitoring glycaemic control. Multiple studies have consistently shown HbA1c to be an independent risk factor for diabetic retinopathy.6 7 10 21 22 A higher HbA1c is associated with both increased incidence as well as progression of diabetic retinopathy.21 The LALES study found a 22% increase in prevalence of diabetic retinopathy with 1% increase in HbA1c. Data suggested a plateau of the curve at HbA1c of ≥11%, however.10 Elevated HbA1c reflects poorly controlled diabetes, which is one of the major causes of complications in DM including diabetic retinopathy. Nonetheless, the United Kingdom Prospective Diabetes Study (UKPDS) demonstrated that even a good HbA1c level of 7.0% had an absolute risk of 7.9 per 1000 patient-years for retinal laser photocoagulation.10 23 This emphasises the importance of optimal glycaemic control in diabetic patients in order to prevent diabetic retinopathy. In contrast, this association was not seen in young-onset type 1 DM,24 a difference that may be attributed to the role of hyperglycaemic memory.25
 
The ACCORD study26 compared the effects of intensive glycaemic treatment with target HbA1c of <6.0% compared with standard treatment with target HbA1c of 7.0% to 7.9%. The authors found a decreased rate of progression of diabetic retinopathy in the intensive treatment group, 7.3%, versus 10.4% in the standard therapy group (adjusted odds ratio [OR]=0.67; 95% CI, 0.51-0.87; P=0.003).26 Despite the perceived benefit of reduced progression of diabetic retinopathy, intensive glycaemic control is not without risk. The ACCORD study found an increased risk of hypoglycaemia requiring medical assistance (10.5% vs 3.5%; P=0.001), weight gain of >10 kg (27.8% vs 14.1%; P=0.001), and all-cause mortality (hazard ratio=1.22; 95% CI, 1.01-1.46; P=0.04).27 Similar findings have also been demonstrated in the Diabetes Control and Complications Trial (DCCT).28 The authors reported that intensive diabetes control therapy reduced the adjusted mean risk for development of retinopathy by 76%, but at a cost of a 33% increased risk of weight gain and a 3-times higher risk of severe hypoglycaemia.28 Thus, one must balance the benefit of reducing the risk of diabetic retinopathy and the risk of tight glycaemic control when treating DM. As demonstrated in this review, however, multiple factors play a role in the development and progression of diabetic retinopathy, hence tight blood glucose control alone may not entirely prevent the development of diabetic retinopathy. Furthermore, Mohamed et al29 have recommended that in patients with diabetic retinopathy, a HbA1c level of 7% is ideal in reducing progression of and new development of diabetic retinopathy.
 
Studies have also found a significantly higher fasting plasma glucose in subjects with diabetic retinopathy.6 16 Xie et al16 found that patients with diabetic retinopathy had a mean (± standard deviation) fasting plasma glucose level of 8.88 ± 4.56 mmol/L compared with 7.70 ± 2.80 mmol/L in those without diabetic retinopathy. This association may also be due to the effects of hyperglycaemia causing retinopathy.
 
Duration of diabetes
An unmodifiable risk factor, prolonged duration of diabetes, has been consistently demonstrated to be a risk factor for diabetic retinopathy.6 8 16 21 24 30 In fact, one study reported that patients with diabetic retinopathy had longer duration of diabetes, double than those without retinopathy (25 ± 10 vs 12 ± 8 years; P<0.0001).30 This was corroborated by Zhang et al7 in a large-scale study which found that patients with diabetic retinopathy had a longer duration of diabetes (15.0 ± 1.6 years vs 7.3 ± 0.8 years; P<0.001). Furthermore, Wong et al31 reported the OR of diabetic retinopathy increased by 1.07 ± 0.2 per year of duration of disease. The LALES study found that each year of increased history of diabetes was associated with an 8% increased risk of having diabetic retinopathy.10 This association can be explained by a prolonged exposure to the hyperglycaemic state that may increase the risk of vascular injury, leading to diabetic retinopathy and other complications.
 
Diabetic drug use
Patients with diabetic retinopathy are also more likely to require medication such as oral hypoglycaemic agents or insulin to control their diabetes. In other words, known and treated diabetes is a predictor of diabetic retinopathy compared with unknown and untreated diabetes.32 A large-scale study performed in the Chinese population found that 90% of diabetic patients without retinopathy were either not on treatment, diet control, or oral hypoglycaemic agents.16 In contrast, almost 80% of patients with diabetic retinopathy required oral hypoglycaemic agents or insulin injections for diabetic control.16 Diabetic patients with diabetic retinopathy were statistically significantly more likely to use insulin (47.4 ± 8.3% vs 26.7 ± 4.8%; OR=3.23).7 One study found the prevalence of diabetic retinopathy to be 70% in patients with type 2 DM using insulin, compared with only 39% in those not receiving insulin treatment.33 These findings are consistent with several other studies.10 34 This relationship between insulin use and diabetic retinopathy may be explained by the severity and level of blood glucose control in patients. In other words, patients who did not require medication are likely those with borderline diabetes or relatively well controlled blood glucose profile, and thus have less risk of developing diabetic retinopathy.
 
The associations between diabetic risk factors and diabetic retinopathy are summarised in Table 1.6 7 8 16 21 24 29 30
 

Table 1. Summary of diabetic risk factors and diabetic retinopathy6 7 8 16 21 24 29 30
 
Systemic risk factors and diabetic retinopathy
Hypertension
Hypertension has been consistently demonstrated to have a positive association with the development of diabetic retinopathy.4 6 7 8 30 The LALES study found an OR of 1.26 (P=0.002) for every 20 mm Hg increase in blood pressure.10 The Hoorn study estimated that patients with hypertension had more than double the risk of developing retinopathy after 10 years when compared with diabetic patients with normal blood pressure.22 Stratton et al35 found that the incidence of developing new retinopathy increased from 17% to 32% when comparing the lowest tertile with the top third mean blood pressure in patients with diabetic retinopathy (P<0.0001). This gradient was less pronounced with 26% and 36% of progression in retinopathy when the bottom third was compared with the top tertile of blood pressure, respectively (P=0.005).35 This marked association between hypertension and diabetic retinopathy may be explained by the clinical finding that hypertension and diabetes frequently co-exist. Hypertension may cause morphological changes in the retinal vessels that are similar to those seen in mild-to-moderate NPDR such as hard exudates, cotton-wool spots, and retinal haemorrhages.34
 
The landmark UKPDS 69 study has outlined the importance of blood pressure control in patients with diabetic retinopathy.21 The authors demonstrated that tight control of blood pressure with a target level of 150/85 mm Hg, rather than loose control of less than 180/105 mm Hg, statistically significantly decreased the development of microaneurysms (relative risk [RR]=0.66; P<0.001), hard exudates (RR=0.53; P<0.001), and cotton-wool spots (RR=0.53; P<0.001). These effects were evident by 4.5 years of follow-up and persisted for up to 7.5 years. Furthermore, there were no detectable differences between blood pressure control by atenolol or captopril therapy, nor in primary or secondary prevention groups. Additionally, the loose blood pressure control group had an absolute risk of 4.1 per 1000 patient-years for blindness in one eye due to all causes (P=0.046; RR=0.76; 99% CI, 0.29-1.99), in comparison with an absolute risk of 3.1 per 1000 patient-years risk of blindness in the tight blood pressure control group.21
 
The importance of tight blood pressure control could not be clearly demonstrated in both the Appropriate Blood Pressure Control in Diabetes (ABCD) Trial36 or the ACCORD study.26 In the ABCD Trial, subjects were randomised to intensive control group (diastolic blood pressure of 75 mm Hg) or moderate control group (diastolic blood pressure of 80-89 mm Hg).36 The authors found no statistically significant difference in the progression of diabetic retinopathy over a 5-year follow-up period. Discrepancies in findings between the studies may be partially due to the difference in blood pressure targets. The authors of the ABCD Trial found that both groups had poor glycaemic control despite optimal blood pressure control and this may have accounted for the progression of diabetic retinopathy.36 This may further suggest the importance of glycaemic control in diabetic retinopathy. Likewise, the ACCORD study found no statistically significant relationship between intensive blood pressure therapy (median systolic blood pressure, 117 mm Hg) and standard therapy (median systolic blood pressure, 133 mm Hg) [10.4% vs 8.8%; adjusted OR=1.23; 95% CI, 0.84-1.79; P=0.29].26 The authors hypothesised that these findings may be attributable to the small difference between blood pressure in the two groups.
 
Obesity
Obesity is another risk factor commonly associated with cardiovascular disease. It can be defined by waist-hip ratio, waist circumference, and body mass index (BMI). Both greater waist-hip ratio and waist circumference are positively associated with diabetic retinopathy.6 22 24 The OR of diabetic retinopathy is 1.28 per 5-cm increase in waist circumference (OR=1.28; 95% CI, 1.05-1.56; P=0.014).24
 
The association between BMI and diabetic retinopathy has been variable among studies. A study looking specifically at patients with type 1 DM found that obesity with a BMI of >30 kg/m2 was the predominant risk factor for diabetic retinopathy, even when controlling for other risk factors such as HbA1c and the use of cardioprotective drugs.37 In another study, obesity was associated with increased prevalence of retinopathy and patients with retinopathy were more likely to be obese, although this association was not sustained after adjusting for confounding factors such as blood pressure.30 Yet among patients with retinopathy, higher BMI was noted to be positively associated with more severe retinopathy and vision-threatening retinopathy.8
 
Some studies have reported no increased risk between elevated BMI and retinopathy.38 39 On the contrary, some studies have even reported an inverse relationship between BMI and diabetic retinopathy. The Wisconsin Epidemiologic Study of Diabetic Retinopathy found that underweight patients (BMI <20 kg/m2) with diabetes had a higher incidence of retinopathy compared with obese patients (RR=1.99; 95% CI, 1.21-3.26 vs RR=1.27; 95% CI, 1.00-1.61).40 In fact, 100% of the underweight patients in this study developed retinopathy by 10 years. This observation held true for the progression of retinopathy as well. The authors observed that the underweight patients had a longer duration of diabetes and were also more likely to be taking insulin than the obese subjects. Thus, they hypothesised that the underweight patients might have had poorer overall glycaemic control and hence were in a more ‘severe’ phase of diabetes when compared with their obese counterparts.40 This hypothesis also corroborates the findings of the DCCT study that tight glycaemic control increases the risk of being overweight.28 Although not statistically significant, Wong et al31 reported that a lower BMI was associated with diabetic retinopathy.
 
Sex
Male sex is an independent risk factor for diabetic retinopathy. A large-scale study performed in the United States revealed that in diabetic patients over the age of 40 years, 38% ± 5.5% of men compared with 27.1% ± 4.7% of women had diabetic retinopathy (OR=2.07; 95% CI, 1.39-3.10).7 While the LALES study showed no statistically significant difference in the incidence of diabetic retinopathy between different sexes, their stepwise multivariate model demonstrated that men had a 50% higher risk of having any diabetic retinopathy when compared with females (OR=1.50; P=0.006).10 This finding was echoed by the UKPDS 50 study that also found no difference in incidence between the two sexes (P=0.67), but a multivariate model showed that women had a lower RR of progression of diabetic retinopathy (RR=0.54; CI, 0.37-0.80; P=0.0016).35 Despite the above evidence, several other studies have found no statistically significant associations between diabetic retinopathy and sex.22 30
 
Hyperlipidaemia
Studies have found varying relationships between elevated cholesterol and diabetic retinopathy. While Yau et al5 reported that elevated total serum cholesterol was associated with a higher prevalence of diabetic macular oedema and vision-threatening diabetic retinopathy, other studies have been unable to reproduce similar results. Tomi&cacute; et al34 demonstrated no statistically significant difference in cholesterol level between patients with different severity of diabetic retinopathy. The Hoorn study also found no relationship between total cholesterol level and incidence of diabetic retinopathy,22 but demonstrated that elevated serum lipid level is associated with increased prevalence of hard exudates characterising NPDR.41 This association of elevated serum lipid levels and hard exudates was observed in other studies as well.42 43 44 Patients with type 1 DM with diabetic retinopathy have been shown to have statistically significantly higher total cholesterol level than those without diabetic retinopathy (199 ± 35 mg/dL vs 188 ± 36 mg/dL; P=0.001), although after logistic regression analysis this was not shown to be an independent risk factor for diabetic retinopathy.30 On the contrary, Wong et al31 reported higher total cholesterol level to be protective of diabetic retinopathy (OR=0.73, per 1 mmol/L increase).
 
Studies showed inconsistent results in the relationship between serum triglycerides and diabetic retinopathy. The Hoorn study,22 De Block et al,30 and Tomi&cacute; et al34 have all demonstrated that serum triglyceride levels are not an independent risk factor for diabetic retinopathy. Likewise, in a large-scale study of 2535 patients with type 2 DM, retinopathy was not significantly associated with triglyceride or high-density lipoprotein (HDL) cholesterol levels after adjustment of confounding factors.45 In contrast, Cheng at al4 found that in overweight type 2 DM patients, elevated triacylglycerol levels were significantly associated with diabetic retinopathy (OR=1.29; 95% CI, 1.05-1.58; P<0.05).
 
Despite the conflicting data, there appears to be merit in treating hyperlipidaemia in patients with diabetic retinopathy. The ACCORD trial investigated the effects of intensive treatment of dyslipidaemia on the progression of diabetic retinopathy.26 Patients in the intensive treatment group were given 160 mg of fenofibrate daily plus simvastatin, while patients in the standard treatment group were given placebo with simvastatin. The authors found a significant improvement in HDL cholesterol (P=0.002) and significant decrease in triglyceride level (P<0.001) in the intensive treatment group. As expected, fall in low-density lipoprotein cholesterol level was comparable between the two groups (P=0.68) as both received simvastatin. With the significant improvement in lipid profile, the authors found that intensive therapy decreased the risk of progression of diabetic retinopathy compared with simvastatin alone, 6.5% vs 10.2% (adjusted OR=0.60; 95% CI, 0.42-0.87; P=0.006).26 A more recent meta-analysis by Das et al46 found no statistically significant improvement in severity of diabetic macular oedema or decrease in progression of hard exudates in patients receiving lipid-lowering drugs compared with placebo. The authors, however, remarked that studies included in the meta-analysis were of questionable quality, calling to the necessity for further high-quality research. Studies included in the meta-analysis by Das et al46 had small sample sizes, underpowered studies, and poor subject selection criteria since patients included had early-stage diabetic retinopathy and hence were at low risk of progression.
 
Chronic kidney disease
Both retinopathy and nephropathy are microvascular complications of diabetic retinopathy. Multiple studies have demonstrated the association between diabetic retinopathy and chronic kidney disease. In a study by Park et al47 in a Korean population, the authors defined chronic kidney disease as estimated glomerular filtration rate (eGFR) of <60 mL/min/1.73 m3. They reported that even after controlling for confounders, both chronic kidney disease (OR=2.34; 95% CI, 1.04-5.28) and proteinuria (OR=4.56; 95% CI, 1.51-13.77) were significantly associated with diabetic retinopathy.47 Additionally, Zhang et al48 found that in the Chinese population, lower eGFR was significantly associated with increasing severity of diabetic retinopathy in patients with diabetic retinopathy (mean eGFR, 93 mL/min/1.73 m3) compared with patients without (mean eGFR, 116 mL/min/1.73 m3; P<0.0001), independent of hypertension and diabetes duration. Diabetic retinopathy was also associated with microalbuminuria (P<0.0001) and higher albumin-to-creatinine ratio (6.4 vs 0.63 in patients with and without diabetic retinopathy, respectively). The authors suggested that in diabetic patients, chronic hyperglycaemia causes microvascular changes in both the glomerulus of the kidney and retina of the eye. Over time, these microvascular changes lead to narrowing and occlusion of the vascular lumina, and eventually cause inadequate perfusion of affected tissues leading to retinopathy and nephropathy.48 These findings were corroborated by Penno et al49 who reported that a high urine albumin-to-creatinine ratio of ≥300 mg/g was associated with diabetic retinopathy (OR=2.9; 95% CI, 2.1-4.0). Likewise, Rodríguez-Poncelas et al50 found that increasing urine albumin-to-creatinine ratio was significantly correlated with rising diabetic retinopathy prevalence, and this association was significant even at urine albumin-to-creatinine levels of ≥10 mg/g (OR=1.2; 95% CI, 1.1-1.4).
 
Smoking
Smoking was shown to have neither a statistically significantly positive nor negative association with diabetic retinopathy. The Hoorn study demonstrated a non-significant trend for increased OR of diabetic retinopathy incidence in cigarette smokers and ex-smokers.22 A 25-year follow-up study showed a non-significant trend that current smokers were more likely to develop proliferative diabetic retinopathy than never smokers, yet was unable to establish a statistically significant association between smoking status or pack-years of smoking and proliferative diabetic retinopathy. The authors found that mild NPDR was more common among current smokers than former smokers (28.4% vs 13.0%; P=0.038) and may suggest that smoking is indeed related to early forms of diabetic retinopathy.51 On the contrary, the UKPDS 50 study demonstrated a protective effect of smoking—current smokers had a reduced incidence of retinopathy with a RR of 0.63 (95% CI, 0.4-0.82; P=0.0043) as well as reduced progression of retinopathy with a RR of 0.50 (95% CI, 0.36-0.71, P=0.0045) when compared with never smokers.35
 
Myopia
Long-sightedness is prevalent among Asians and it has become a significant problem in this locality in terms of resources for glasses prescriptions, refractive surgeries, and the management of visual-threatening complications such as myopic macular degeneration, myopic tractional maculopathy, and choroidal neovascularisation. Although myopia in most cases is harmful to ocular health, it has long been observed that the prevalence of diabetic retinopathy is low in myopic patients. This protective effect of myopia against diabetic retinopathy has recently been proven by various meta-analysis,52 53 revealing the OR of diabetic retinopathy in myopic diabetic patients versus non-myopic diabetic patients to be 0.70 (95% CI, 0.58-0.85; P<0.001). On the contrary, axial length, the major cause of myopia, was found to be associated with diabetic retinopathy as well, in which each millimetre increase in axial length is associated with decreased risk of diabetic retinopathy (OR=0.75; 95% CI, 0.65-0.86; P<0.001).
 
The relationships between systemic risk factors and diabetic retinopathy are summarised in Table 2.4 5 6 7 8 10 19 21 22 24 28 30 34 38 39 40 42 43 44 47 48 49 50 51 52 53
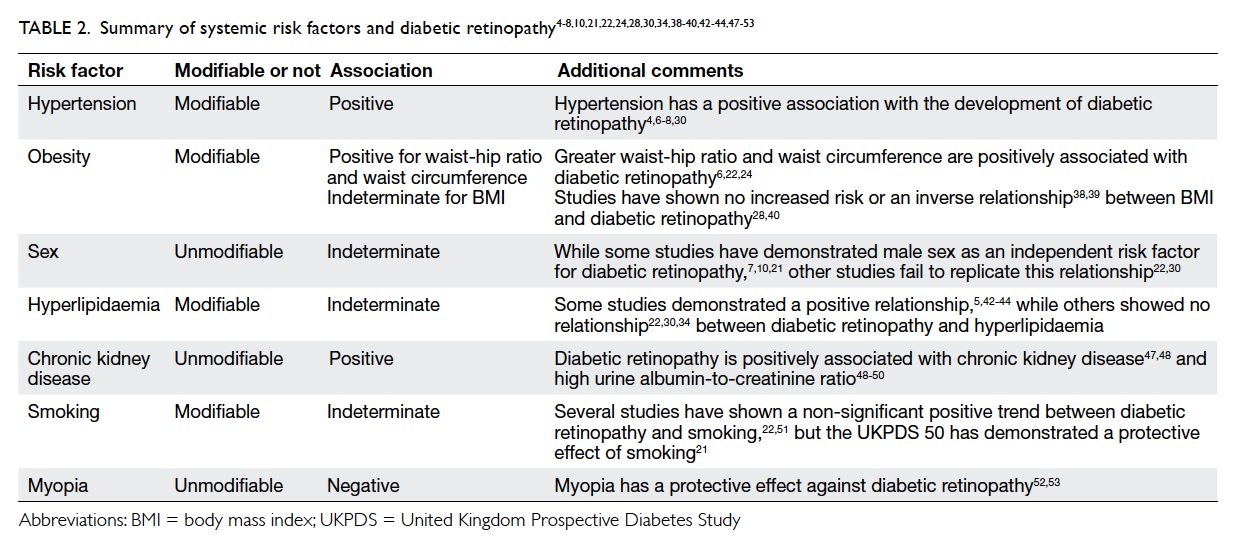
 

Table 2. Summary of systemic risk factors and diabetic retinopathy4 5 6 7 8 10 21 22 24 28 30 34 38 39 40 42 43 44 47 48 49 50 51 52 53
 
Genetic polymorphisms and diabetic retinopathy
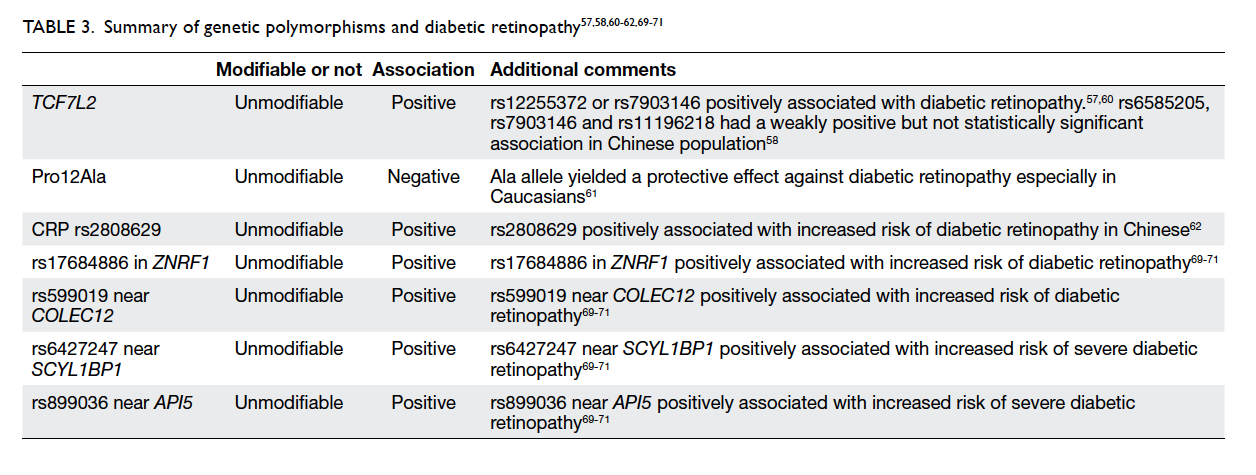
While genetic polymorphism is not a modifiable risk factor, various genetic polymorphisms may cause a predisposition to the development and progression of diabetic retinopathy. Multiple studies have demonstrated the relationship between TCF7L2 and the development of type 2 diabetes54 55 56 as increased expression of this gene is associated with poor serum glucose control. Ciccacci et al57 found that patients with rs12255372 or rs7903146 variants of TCF7L2 were at higher risk of developing diabetic retinopathy. Within the Chinese population, patients with rs6585205, rs7903146, and rs11196218 had a weakly positive but not statistically significant association with development of diabetic retinopathy.58 A meta-analysis conducted by Ding et al59 found that the rs7903146 variant (T allele) of TCF7L2 was significantly associated with increased risk of development of diabetic retinopathy (OR=1.47; 95% CI, 1.19-1.81; P≤0.001 for TT vs CC when comparing genotype polymorphism TT, TC, and CC) especially within the Caucasian population. Due to rarity of the T allele within East Asian populations (estimated at 4.47%60 and 6.997%58 in two different studies), however, this may be not applicable to this locality.
 
A meta-analysis by Ma et al61 reported a positive association between Pro12Ala polymorphism of the peroxisome proliferator–activated receptor γ2 (PPARγ2) gene. The PPARγ2 gene plays a key role in multiple pathways including glucose metabolism, angiogenesis, and inflammation. The authors found that the Ala allele yielded a protective effect against diabetic retinopathy in patients with type 2 DM (OR=0.81; 95% CI, 0.68-0.98; P=0.03). This association was stronger in Caucasian subgroups compared with Asian subgroups, possibly due to differences in allele frequencies and study design.61
 
A recent study by Peng et al62 demonstrated that the C-reactive protein (CRP) variant rs2808629 is statistically significantly associated with increased risk of diabetic retinopathy (OR=1.296; 95% CI, 1.076-1.561; P=0.006 for G allele) in Chinese patients with type 2 DM. Even after adjusting for confounding factors associated with diabetic retinopathy, this variant of CRP remained an independent genetic risk factor for development of diabetic retinopathy.62 Patients with rs2808629 have been demonstrated to have higher levels of serum CRP.63 Yet, there have been no conclusive findings of the relationship between high CRP levels and the development of diabetic retinopathy as studies have demonstrated contradicting results.64 65 66 67 68 The exact mechanism of how rs2808629 causes increased risk of diabetic retinopathy warrants further research.
 
Another comprehensive study by Peng et al69 sought to establish the relationship between 40 single nucleotide polymorphisms and diabetic retinopathy in Chinese patients with type 2 DM. The authors found that rs17684886 in ZNRF1 (OR=0.812; P=0.0039) and rs599019 near COLEC12 (OR=0.835; P=0.0116) were associated with an increased risk of diabetic retinopathy. rs6427247 near SCYL1BP1 (OR=1.368; P=0.0333) and rs899036 near API5 (OR=0.340; P=0.0005) were associated with increased risk of severe diabetic retinopathy.69 This is consistent with other genome-wide association studies in Caucasian and Mexican-American patients.70 71
 
As the relationship between genetic polymorphisms and diabetic retinopathy is still a new and emerging field, some studies have demonstrated new associations between single nucleotide polymorphisms, but these studies have not yet been replicable. Further studies are thus warranted.
 
Diabetic retinopathy and its genetic risk factors are listed in Table 3.57 58 60 61 62 63 69 70 71
 

Table 3. Summary of genetic polymorphisms and diabetic retinopathy57 58 60 61 62 69 70 71
 
Conclusions
The importance of glycaemic control and duration of diabetes with diabetic retinopathy have been clearly established. Additionally, the modality of diabetic treatment may reflect the severity of diabetes and risk of developing diabetic retinopathy. Patients with DM should be encouraged to optimise their control of the disease in order to prevent the development and progression of diabetic retinopathy. Of the systemic risk factors studied, multiple studies clearly establish a positive association between hypertension and diabetic retinopathy. Studies have shown varying results for the association of diabetic retinopathy with obesity, male sex, hyperlipidaemia, and smoking. Additionally, declining renal function and microalbuminuria have been demonstrated to be associated with increased prevalence of diabetic retinopathy. In contrast, myopia is protective against development of diabetic retinopathy. Despite inconsistent findings for the association of systemic risk factors with diabetic retinopathy, it is still important for clinicians to encourage patients to optimise their body weight, lipid profile, and to abstain from smoking due to their associations with risk for cardiovascular disease as well as other complications of diabetes. New research has also demonstrated an increasing number of genetic polymorphisms associated with risk of type 2 DM and the development of diabetic retinopathy. Investigating the polymorphisms associated with diabetic retinopathy may help us better understand the developmental pathway of diabetic retinopathy and lead to new targeted therapy in treating diabetes and preventing diabetic retinopathy.
 
Declaration
All authors have disclosed no conflicts of interest.
 
References
1. Cheung N, Mitchell P, Wong TY. Diabetic retinopathy. Lancet 2010;376:124-36. Crossref
2. Klein R, Klein BE, Moss SE, Cruickshanks KJ. The Wisconsin Epidemiologic Study of Diabetic Retinopathy: XVII. The 14-year incidence and progression of diabetic retinopathy and associated risk factors in type 1 diabetes. Ophthalmology 1998;105:1801-15. Crossref
3. Kannel WB, McGee DL. Diabetes and cardiovascular risk factors: the Framingham study. Circulation 1979;59:8-13. Crossref
4. Cheng Y, Zhang H, Chen R, et al. Cardiometabolic risk profiles associated with chronic complications in overweight and obese type 2 diabetes patients in South China. PLoS One 2014;9:e101289. Crossref
5. Yau JW, Rogers SL, Kawasaki R, et al. Global prevalence and major risk factors of diabetic retinopathy. Diabetes Care 2012;35:556-64. Crossref
6. Wong TY, Klein R, Islam FM, et al. Diabetic retinopathy in a multi-ethnic cohort in the United States. Am J Ophthalmol 2006;141:446-55. Crossref
7. Zhang X, Saaddine JB, Chou CF, et al. Prevalence of diabetic retinopathy in the United States, 2005-2008. JAMA 2010;304:649-56. Crossref
8. Raum P, Lamparter J, Ponto KA, et al. Prevalence and cardiovascular associations of diabetic retinopathy and maculopathy: results from the Gutenberg Health Study. PLoS One 2015;10:e0127188. Crossref
9. Bertelsen G, Peto T, Lindekleiv H, et al. Sex differences in risk factors for retinopathy in non-diabetic men and women: the Tromsø Eye Study. Acta Ophthalmol 2014;92:316-22. Crossref
10. Varma R, Macias GL, Torres M, et al. Biologic risk factors associated with diabetic retinopathy: the Los Angeles Latino Eye Study. Ophthalmology 2007;114:1332-40. Crossref
11. Tam TK, Lau CM, Tsang LC, Ng KK, Ho KS, Lai TC. Epidemiological study of diabetic retinopathy in a primary care setting in Hong Kong. Hong Kong Med J 2005;11:438-44.
12. Tam VH, Lam EP, Chu BC, Tse KK, Fung LM. Incidence and progression of diabetic retinopathy in Hong Kong Chinese with type 2 diabetes mellitus. J Diabetes Complications 2009;23:185-93. Crossref
13. Wang WQ, Ip TP, Lam KS. Changing prevalence of retinopathy in newly diagnosed non-insulin dependent diabetes mellitus patients in Hong Kong. Diabetes Res Clin Pract 1998;39:185-91. Crossref
14. Lian JX, Gangwani RA, McGhee SM, et al. Systematic screening for diabetic retinopathy (DR) in Hong Kong: prevalence of DR and visual impairment among diabetic population. Br J Ophthalmol 2016;100:151-5. Crossref
15. Chen MS, Kao CS, Chang CJ, et al. Prevalence and risk factors of diabetic retinopathy among noninsulin-dependent diabetic subjects. Am J Ophthalmol 1992;114:723-30. Crossref
16. Xie XW, Xu L, Wang YX, Jonas JB. Prevalence and associated factors of diabetic retinopathy. The Beijing Eye Study 2006. Graefes Arch Clin Exp Ophthalmol 2008;246:1519-26. Crossref
17. Wang FH, Liang YB, Zhang F, et al. Prevalence of diabetic retinopathy in rural China: the Handan Eye Study. Ophthalmology 2009;116:461-7. Crossref
18. Ramachandran A, Snehalatha C, Vijay V, King H. Impact of poverty on the prevalence of diabetes and its complications in urban southern India. Diabet Med 2002;19:130-5. Crossref
19. Grading diabetic retinopathy from stereoscopic color fundus photographs—an extension of the modified Airlie House classification. ETDRS report number 10. Early Treatment Diabetic Retinopathy Study Research Group. Ophthalmology 1991;98(5 Suppl):786S-806S. Crossref
20. Core NDESP team. Diabetic eye screening feature based grading forms. NHS Diabetic Eye Screening Programme; 2012.
21. Matthews DR, Stratton IM, Aldington SJ, Holman RR, Kohner EM, UK Prospective Diabetes Study Group. Risks of progression of retinopathy and vision loss related to tight blood pressure control in type 2 diabetes mellitus: UKPDS 69. Arch Ophthalmol 2004;122:1631-40. Crossref
22. van Leiden HA, Dekker JM, Moll AC, et al. Risk factors for incident retinopathy in a diabetic and nondiabetic population: the Hoorn study. Arch Ophthalmol 2003;121:245-51. Crossref
23. Intensive blood-glucose control with sulphonylureas or insulin compared with conventional treatment and risk of complications in patients with type 2 diabetes (UKPDS 33). UK Prospective Diabetes Study (UKPDS) Group. Lancet 1998;352:837-53. Crossref
24. Rajalakshmi R, Amutha A, Ranjani H, et al. Prevalence and risk factors for diabetic retinopathy in Asian Indians with young onset type 1 and type 2 diabetes. J Diabetes Complications 2014;28:291-7. Crossref
25. Zhang L, Chen B, Tang L. Metabolic memory: mechanisms and implications for diabetic retinopathy. Diabetes Res Clin Pract 2012;96:286-93. Crossref
26. ACCORD Study Group, ACCORD Eye Study Group, Chew EY, et al. Effects of medical therapies on retinopathy progression in type 2 diabetes. N Engl J Med 2010;363:233-44. Crossref
27. Action to Control Cardiovascular Risk in Diabetes Study Group, Gerstein HC, Miller ME, et al. Effects of intensive glucose lowering in type 2 diabetes. N Engl J Med 2008;358:2545-59. Crossref
28. The effect of intensive treatment of diabetes on the development and progression of long-term complications in insulin-dependent diabetes mellitus. The Diabetes Control and Complications Trial Research Group. N Engl J Med 1993;329:977-86. Crossref
29. Mohamed Q, Gillies MC, Wong TY. Management of diabetic retinopathy: a systematic review. JAMA 2007;298:902-16. Crossref
30. De Block CE, De Leeuw IH, Van Gaal LF. Impact of overweight on chronic microvascular complications in type 1 diabetic patients. Diabetes Care 2005;28:1649-55. Crossref
31. Wong TY, Cheung N, Tay WT, et al. Prevalence and risk factors for diabetic retinopathy: the Singapore Malay Eye Study. Ophthalmology 2008;115:1869-75. Crossref
32. Lim MC, Lee SY, Cheng BC, et al. Diabetic retinopathy in diabetics referred to a tertiary centre from a nationwide screening programme. Ann Acad Med Singapore 2008;37:753-9.
33. Klein R, Klein BE, Moss SE, Davis MD, DeMets DL. The Wisconsin epidemiologic study of diabetic retinopathy. III. Prevalence and risk of diabetic retinopathy when age at diagnosis is 30 or more years. Arch Ophthalmol 1984;102:527-32. Crossref
34. Tomi&cacute; M, Ljubi&cacute; S, Kaštelan S, Gverovi&cacute; Antunica A, Jazbec A, Polji&ccaron;anin T. Inflammation, haemostatic disturbance, and obesity: possible link to pathogenesis of diabetic retinopathy in type 2 diabetes. Mediators Inflamm 2013;2013:818671. Crossref
35. Stratton IM, Kohner EM, Aldington SJ, et al. UKPDS 50: risk factors for incidence and progression of retinopathy in type II diabetes over 6 years from diagnosis. Diabetologia 2001;44:156-63. Crossref
36. Estacio RO, Jeffers BW, Gifford N, Schrier RW. Effect of blood pressure control on diabetic microvascular complications in patients with hypertension and type 2 diabetes. Diabetes Care 2000;23 Suppl 2:B54-64.
37. Price SA, Gorelik A, Fourlanos S, Colman PG, Wentworth JM. Obesity is associated with retinopathy and macrovascular disease in type 1 diabetes. Obes Res Clin Pract 2014;8:e178-82. Crossref
38. Nelson RG, Wolfe JA, Horton MB, Pettitt DJ, Bennett PH, Knowler WC. Proliferative retinopathy in NIDDM. Incidence and risk factors in Pima Indians. Diabetes 1989;38:435-40. Crossref
39. Lee ET, Lee VS, Lu M, Russell D. Development of proliferative retinopathy in NIDDM. A follow-up study of American Indians in Oklahoma. Diabetes 1992;41:359-67. Crossref
40. Klein R, Klein BE, Moss SE. Is obesity related to microvascular and macrovascular complications in diabetes? The Wisconsin Epidemiologic Study of Diabetic Retinopathy. Arch Intern Med 1997;157:650-6. Crossref
41. van Leiden HA, Dekker JM, Moll AC, et al. Blood pressure, lipids, and obesity are associated with retinopathy: the Hoorn study. Diabetes Care 2002;25:1320-5. Crossref
42. Klein BE, Moss SE, Klein R, Surawicz TS. The Wisconsin Epidemiologic Study of Diabetic Retinopathy. XIII. Relationship of serum cholesterol to retinopathy and hard exudate. Ophthalmology 1991;98:1261-5. Crossref
43. Chew EY, Klein ML, Ferris FL 3rd, et al. Association of elevated serum lipid levels with retinal hard exudate in diabetic retinopathy. Early Treatment Diabetic Retinopathy Study (ETDRS) Report 22. Arch Ophthalmol 1996;114:1079-84. Crossref
44. Chaturvedi N, Sjoelie AK, Porta M, et al. Markers of insulin resistance are strong risk factors for retinopathy incidence in type 1 diabetes. Diabetes Care 2001;24:284-9. Crossref
45. Sacks FM, Hermans MP, Fioretto P, et al. Association between plasma triglycerides and high-density lipoprotein cholesterol and microvascular kidney disease and retinopathy in type 2 diabetes mellitus: a global case-control study in 13 countries. Circulation 2014;129:999-1008. Crossref
46. Das R, Kerr R, Chakravarthy U, Hogg RE. Dyslipidemia and diabetic macular edema: a systematic review and meta-analysis. Ophthalmology 2015;122:1820-7. Crossref
47. Park YH, Shin JA, Han JH, Park YM, Yim HW. The association between chronic kidney disease and diabetic retinopathy: the Korea national health and nutrition examination survey 2008-2010. PLoS One 2015;10:e0125338. Crossref
48. Zhang H, Wang J, Ying GS, Shen L, Zhang Z. Diabetic retinopathy and renal function in Chinese type 2 diabetic patients. Int Urol Nephrol 2014;46:1375-81. Crossref
49. Penno G, Solini A, Zoppini G, et al. Rate and determinants of association between advanced retinopathy and chronic kidney disease in patients with type 2 diabetes: the Renal Insufficiency And Cardiovascular Events (RIACE) Italian multicenter study. Diabetes Care 2012;35:2317-23. Crossref
50. Rodríguez-Poncelas A, Mundet-Tudurí X, Miravet-Jiménez S, et al. Chronic kidney disease and diabetic retinopathy in patients with type 2 diabetes. PLoS One 2016;11:e0149448. Crossref
51. Gaedt Thorlund M, Borg Madsen M, Green A, Sjølie AK, Grauslund J. Is smoking a risk factor for proliferative diabetic retinopathy in type 1 diabetes? Ophthalmologica 2013;230:50-4. Crossref
52. Fu Y, Geng D, Liu H, Che H. Myopia and/or longer axial length are protective against diabetic retinopathy: a meta-analysis. Acta Ophthalmol 2016;94:346-52. Crossref
53. Wang X, Tang L, Gao L, Yang Y, Cao D, Li Y. Myopia and diabetic retinopathy: a systematic review and meta-analysis. Diabetes Res Clin Pract 2016;111:1-9. Crossref
54. Grant RW, Moore AF, Florez JC. Genetic architecture of type 2 diabetes: recent progress and clinical implications. Diabetes Care 2009;32:1107-14. Crossref
55. Grant SF, Thorleifsson G, Reynisdottir I, et al. Variant of transcription factor 7-like 2 (TCF7L2) gene confers risk of type 2 diabetes. Nat Genet 2006;38:320-3. Crossref
56. Cauchi S, Froguel P. TCF7L2 genetic defect and type 2 diabetes. Curr Diab Rep 2008;8:149-55. Crossref
57. Ciccacci C, Di Fusco D, Cacciotti L, et al. TCF7L2 gene polymorphisms and type 2 diabetes: association with diabetic retinopathy and cardiovascular autonomic neuropathy. Acta Diabetol 2013;50:789-99. Crossref
58. Fu LL, Lin Y, Yang ZL, Yin YB. Association analysis of genetic polymorphisms of TCF7L2, CDKAL1, SLC30A8, HHEX genes and microvascular complications of type 2 diabetes mellitus [in Chinese]. Zhonghua Yi Xue Yi Chuan Xue Za Zhi 2012;29:194-9.
59. Ding Y, Hu Z, Yuan S, Xie P, Liu Q. Association between transcription factor 7-like 2 rs7903146 polymorphism and diabetic retinopathy in type 2 diabetes mellitus: A meta-analysis. Diab Vasc Dis Res 2015;12:436-44. Crossref
60. Choi HJ, Lee DH, Jeon HJ, Kim DS, Lee YH, Oh T. Transcription factor 7-like 2 (TCF7L2) gene polymorphism rs7903146 is associated with stroke in type 2 diabetes patients with long disease duration. Diabetes Res Clin Pract 2014;103:e3-6. Crossref
61. Ma J, Li Y, Zhou F, Xu X, Guo G, Qu Y. Meta-analysis of association between the Pro12Ala polymorphism of the peroxisome proliferator–activated receptor-gamma2 gene and diabetic retinopathy in Caucasians and Asians. Mol Vis 2012;18:2352-60.
62. Peng D, Wang J, Zhang R, et al. C-reactive protein genetic variant is associated with diabetic retinopathy in Chinese patients with type 2 diabetes. BMC Endocr Disord 2015;15:8. Crossref
63. Benjamin EJ, Dupuis J, Larson MG, et al. Genome-wide association with select biomarker traits in the Framingham Heart Study. BMC Med Genet 2007;8 Suppl 1:11S. Crossref
64. Klein BE, Knudtson MD, Tsai MY, Klein R. The relation of markers of inflammation and endothelial dysfunction to the prevalence and progression of diabetic retinopathy: Wisconsin epidemiologic study of diabetic retinopathy. Arch Ophthalmol 2009;127:1175-82. Crossref
65. Lim LS, Tai ES, Mitchell P, et al. C-reactive protein, body mass index, and diabetic retinopathy. Invest Ophthalmol Vis Sci 2010;51:4458-63. Crossref
66. Muni RH, Kohly RP, Lee EQ, Manson JE, Semba RD, Schaumberg DA. Prospective study of inflammatory biomarkers and risk of diabetic retinopathy in the diabetes control and complications trial. JAMA Ophthalmol 2013;131:514-21. Crossref
67. Nguyen TT, Alibrahim E, Islam FM, et al. Inflammatory, hemostatic, and other novel biomarkers for diabetic retinopathy: the multi-ethnic study of atherosclerosis. Diabetes Care 2009;32:1704-9. Crossref
68. van Hecke MV, Dekker JM, Nijpels G, et al. Inflammation and endothelial dysfunction are associated with retinopathy: the Hoorn Study. Diabetologia 2005;48:1300-6. Crossref
69. Peng D, Wang J, Zhang R, et al. Common variants in or near ZNRF1, COLEC12, SCYL1BP1 and API5 are associated with diabetic retinopathy in Chinese patients with type 2 diabetes. Diabetologia 2015;58:1231-8. Crossref
70. Fu YP, Hallman DM, Gonzalez VH, et al. Identification of diabetic retinopathy genes through a genome-wide association study among Mexican-Americans from Starr County, Texas. J Ophthalmol 2010;2010.pii: 861291.
71. Grassi MA, Tikhomirov A, Ramalingam S, Below JE, Cox NJ, Nicolae DL. Genome-wide meta-analysis for severe diabetic retinopathy. Hum Mol Genet 2011;20:2472-81. Crossref

Diabetic retinopathy screening: global and local perspective

Hong Kong Med J 2016 Oct;22(5):486–95 | Epub 26 Aug 2016
DOI: 10.12809/hkmj164844
© Hong Kong Academy of Medicine. CC BY-NC-ND 4.0
 
REVIEW ARTICLE
Diabetic retinopathy screening: global and local perspective
Rita A Gangwani, FRCS (Edin), FHKAM (Ophthalmology)1; JX Lian, MPH, PhD1; Sarah M McGhee, PhD, FFPH(UK)2; David Wong, FRCOphth, FRCS1,3; Kenneth KW Li, FRCS (Edin), FHKAM (Ophthalmology)1,4
1 Department of Ophthalmology, The University of Hong Kong, Pokfulam, Hong Kong
2 School of Public Health, The University of Hong Kong, Pokfulam, Hong Kong
3 Royal Liverpool University, Liverpool, United Kingdom
4 Department of Ophthalmology, United Christian Hospital, Kwun Tong, Hong Kong
 
Corresponding author: Dr Rita A Gangwani (dr.rita_gangwani@hotmail.com)
 
 
 Full paper in PDF
 
Abstract
Diabetes mellitus has become a global epidemic. It causes significant macrovascular complications such as coronary artery disease, peripheral artery disease, and stroke; as well as microvascular complications such as retinopathy, nephropathy, and neuropathy. Diabetic retinopathy is known to be the leading cause of blindness in the working-age population and may be asymptomatic until vision loss occurs. Screening for diabetic retinopathy has been shown to reduce blindness by timely detection and effective laser treatment. Diabetic retinopathy screening is being done worldwide either as a national screening programme or hospital-based project or as a community-based screening programme. In this article, we review different methods of screening including grading used to detect the severity of sight-threatening retinopathy and the newer screening methods. This review also includes the method of systematic screening being carried out in Hong Kong, a system that has helped to identify diabetic retinopathy among all attendees in public primary care clinics using a Hong Kong–wide public patients’ database.


Introduction
Diabetes mellitus (DM) is becoming a global epidemic. In 2010, the World Health Organization (WHO) estimated that the global prevalence of DM is approximately 6.4% or 280 million people worldwide.1 The figures from 2014 are even more alarming: approximately 347 million people globally are diagnosed to have DM.2 Sedentary lifestyles, lack of physical activity, obesity, and lack of awareness have contributed to an increased prevalence of DM, particularly in developing countries.2
 
Diabetes mellitus is a chronic disease characterised by hyperglycaemia. Of the two types of DM, type 1 (insulin-dependent or juvenile type) is characterised by a total lack of insulin due to destruction of islets of Langerhans in the pancreas, due to an autoimmune process the cause of which may be unknown, and is not preventable with current knowledge.3 4 Type 2 DM, the more common type (non–insulin-dependent or adult-onset) characterised by resistance to the action of insulin and failure of insulin production, usually occurs due to excess body weight and lack of physical activity and is preventable.3 4
 
Diabetes mellitus causes both macrovascular complications such as coronary artery disease, peripheral arterial disease, and stroke; and microvascular complications such as diabetic nephropathy, neuropathy, and retinopathy.5 Diabetic retinopathy (DR) is one of the most common microvascular complications and one of the most common causes of blindness in populations of working age (20-70 years). While certain risk factors for DR, like the type and duration of DM, cannot be modified, control of other modifiable risk factors such as glycaemic control (haemoglobin A1c [HbA1c]), hypertension, and hyperlipidaemia is effective and essential to reduce DR-related blindness.6 7 8 9
 
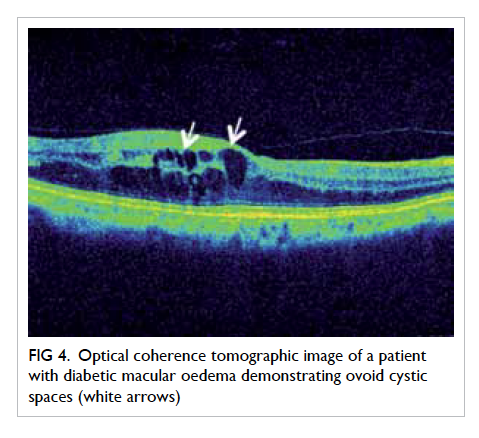
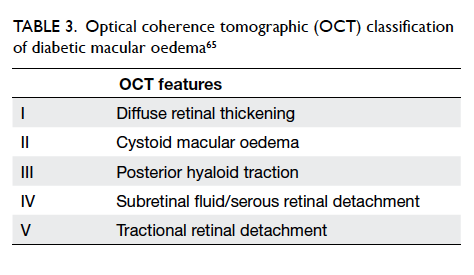
Diabetic retinopathy consists of the early non-proliferative diabetic retinopathy (NPDR) stage, which can be mild, moderate, or severe; the advanced stage as proliferative DR (PDR); and maculopathy or diabetic macular oedema. Vision loss in DR occurs mainly due to macular oedema and PDR. Some studies consider PDR and diabetic macular oedema or diabetic maculopathy to be sight-threatening DR (STDR) while some other studies include moderate-to-severe NPDR additionally within the category of STDR. Blindness caused by DR is preventable. Since DR is usually asymptomatic, early detection and timely treatment are essential to prevent blindness.10 11 12 The Diabetic Retinopathy Study and The Early Treatment Diabetic Retinopathy Study (ETDRS) showed the effectiveness of scatter laser photocoagulation in patients with severe NPDR and PDR, and focal laser treatment in patients with diabetic macular oedema.10 11 12 Diabetic macular oedema is associated with the breakdown of the blood-retinal barrier. Inflammation plays a significant role and is mediated by multiple cytokines including inflammatory cytokines and vascular endothelial growth factor (VEGF).13 Several clinical trials have demonstrated the effectiveness of anti-VEGF drugs (such as ranibizumab, bevacizumab, pegaptanib and aflibercept) in restoring the integrity of the blood-retinal barrier and effectively reducing diabetic macular oedema and improving vision.14
 
Blindness due to DR has important implications for the individual and is a huge socio-economic burden on the health care system and society.15 16 Although new treatments with anti-VEGF therapy for diabetic macular oedema and PDR can be very effective, they are very costly considering most people need maintenance treatment over some months and years.16 Additionally, chronic cases do not respond well to anti-VEGF therapy.
 
The WHO recommends that screening should be done for any condition that is an important health problem, has an effective treatment that can be delivered early, usually before symptoms of the condition are apparent, when facilities for diagnosis and treatment are available, when screening is feasible and cost-effective, and when subjects can be followed up longitudinally.17 Diabetic retinopathy fulfils most of these criteria and some studies have shown that screening can reduce the rate of blindness due to DR.18 19
 
Since photocoagulation is effective to treat retinopathy and prevent blindness, it has been considered unethical to conduct a randomised controlled trial of screening versus no screening.20 Therefore, few studies have examined the cost-effectiveness of screening for DR directly and most have used computer-based cost-effectiveness models to simulate the experience of cohorts of diabetic patients.20 21 Such studies have calculated the cost-effectiveness of screening and treatment in terms of cost per quality-adjusted life year gained, sight year saved, or case of blindness avoided.21 22 One study carried out in Hong Kong showed that systematic screening at no charge to the subject is more cost-effective from the societal perspective than screening with a small co-payment.23
 
The important measures to prevent vision loss due to DR therefore include: (1) early detection of retinopathy by some form of screening, (2) subsequent monitoring of the condition with regular fundus examination, and (3) timely and effective laser treatment when deemed necessary.
 
Screening of DR is carried out at most places throughout the world, but there is no single recommended method that is suitable for every country. The DR classification and grading method, particularly for STDR, has minor differences across different countries too. The aim of this paper was to review the methods of screening for DR from both a global and local perspective.
 
History of diabetic retinopathy screening
In 1989, the St Vincent Declaration in Europe aimed to reduce DM-related blindness by one third in 5 years.24 The Diabetes 2000 programme of the American Academy of Ophthalmology (AAO) was implemented to promote screening and treatment for DR.25 The English national screening programme (ENSP) started systematic DR screening in 2003 and aimed to reduce blindness by 40% within 5 years.26 27 Systematic screening means that every eligible person is contacted and offered screening regularly and every effort is made to screen the whole group at risk. This usually requires a register of all those with DM and the maintenance of active contact with them. In 2004, 15 years after the St Vincent Declaration, the Liverpool declaration aimed to reduce DR-related blindness further by ensuring that systematic screening reached at least 80% of the diabetic population in all European countries. As a result, there is now universal access to laser therapy in these countries.28 In South-East Asia, Thailand has launched the new Thailand Healthy Lifestyle Strategy Plan (2011-2020) to decrease the prevalence, complications, and disability of five major non-communicable diseases including DM and is now introducing a mobile eye care project to enable people from rural communities to have access to DM screening.29 30
 
In order to ensure standardisation and quality of DR screening, guidelines have been developed by national organisations such as the American Diabetes Association (ADA), the AAO, and the ENSP, and many screening programmes are now being carried out worldwide.25 26 30 31
 
Recommendations for diabetic retinopathy screening
According to ADA and AAO, adults and children of ≥10 years of age who had type 1 DM should have an initial and comprehensive eye examination by an ophthalmologist or optometrist within 5 years of the diagnosis. Similarly, type 2 DM patients should undergo DR screening within 5 years of the diagnosis. An initial comprehensive eye examination should include dilated fundal examination and follow-up examinations at least yearly thereafter.25 28 31 In the presence of any retinopathy (NPDR, PDR, or macular oedema), referral to an ophthalmologist is required and more frequent examinations are recommended. Pregnant women with pre-existing DM should undergo dilated fundus examination in the first trimester with close follow-up throughout pregnancy and for 1 year postpartum.25 Women who develop gestational DM do not require an eye examination during pregnancy and are not at increased risk of developing DR during pregnancy.25 Patients with mental and physical disability are not excluded from DR screening; ENSP has special provision for such groups.32
 
Many of the current guidelines, such as AAO and ENSP, recommend annual screening for DR.25 31 32 Iceland is one of the pioneers in DR screening and introduced a risk-adjusted screening interval for DR. The Icelandic model adjusts the screening interval from 6 months up to 60 months according to the individual risk of STDR taking into account the level of HbA1c, systolic blood pressure, type of DM, stage of DR, gender, and duration of DM.33 Screening intervals in the Icelandic model could therefore be more variable than the fixed intervals in the AAO or ENSP in the UK.33 34
 
Types of diabetic retinopathy screening
Opportunistic versus systematic screening
Opportunistic screening is sporadic and occurs when a test is offered by a doctor or health care professional or when the patient asks the doctor for the test. Opportunistic screening may not be checked for quality assurance and may not include all those at risk. In contrast and as previously described, systematic screening consists of quality-assured predetermined screening processes that include the active identification of those at risk, maintenance of a register of eligible subjects, and invitation to attend the screening programme. Everyone who participates in the systematic screening undergoes the same method of screening. The selection, invitation, and follow-up processes are determined in advance and constitute a system that provides feedback and/or referral with call and recall for screening at specified intervals.
 
Historically, opportunistic screening has been done. Systematic screening, which includes the whole population at risk in its target group, ensures much better coverage of DM patients.
 
Methods used for screening
Screening for DR has been performed using different methods. This includes direct ophthalmoscopy, dilated stereoscopic fundoscopy, fundus analogue photography and now, more commonly, the use of digital photography with wide-angle imaging. The digital fundus photography can be performed with pupil dilatation (mydriatic) or without pupil dilatation (non-mydriatic) and also with a stereoscopic or non-stereoscopic technique. Non-mydriatic fundus cameras have been commonly employed in DR screening as they have the advantage of not requiring pupil dilatation and can capture a wide angle of the retina. In the presence of media opacity such as cataract, however, the image quality of non-mydriatic cameras is less satisfactory and may lead to ungradable images. For this reason, mydriatic fundus photography is preferred in the diabetic population given that cataract is more prevalent as it has the advantage of having a lower percentage of ungradable images due to media opacity. Nevertheless, pupil dilatation is more time-consuming and carries a small risk of precipitating an acute angle-closure glaucoma attack.
 
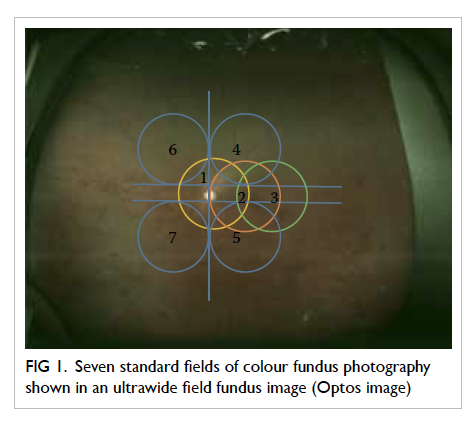
The previously accepted gold standard for DR screening is dilated seven-field 30° stereoscopic fundus photographs with grading by experienced readers using the recommended ETDRS process (Fig 1).35 This procedure remains the gold standard for academic research but is seldom adopted for population screening because it is time-consuming. Furthermore, seven-field stereoscopic fundus photographs give rise to too many screening failures and are therefore not suitable for mass screening, especially in a population with a high prevalence of cataract. Slit-lamp biomicroscopic fundus examination by an ophthalmologist is also considered the clinical gold standard and is equally effective but not practical for large-scale screening. Additionally, clinical verification and validation are difficult because of the problem of accurate clinical documentation. The detection ability of colour fundus photography using a fundus camera to detect DR was compared with that of doctors in diabetic clinics using ophthalmoscopy. The camera detection rate was 4 times higher through undilated pupils and more than twice as high through dilated pupils.36 Although improved detection rates by ophthalmoscopy may improve clinical detection or diagnosis of DR, ophthalmoscopy can easily overlook signs of early DR in a busy diabetic clinics.36
 

Figure 1. Seven standard fields of colour fundus photography shown in an ultrawide field fundus image (Optos image)
 
Various studies have compared single-field and two-field screening retinal photographs to seven-field stereo photographs.37 38 39 40 Single-field 45° photographs centred at the fovea, when compared with seven-field photographs, had a sensitivity of 74% to 86% and specificity of 92% to 95%.37 38 Some other studies have shown high sensitivity and specificity to detect DR using two-field fundus photographs.39 40 Two-field 45° to 50° photographs consist of images covering the temporal area including the macula and optic disc and the second-field covering the nasal area including the optic disc (Fig 2). Two-field photography has the advantage of detecting DR in the nasal retina that could otherwise have been missed by single-field photography.
 

Figure 2. Two-field fundus photographs of the right eye of a patient with diabetic retinopathy
Centred at (a) fovea and (b) optic disc
 
The ENSP for diabetic eye disease in the UK developed a screening protocol for DR using non-stereoscopic 45°, two-field fundus photography (centred at the macula and optic disc).26 41 Other studies have also utilised single- or three-field digital fundus photography as a screening tool for DR screening.42 43
 
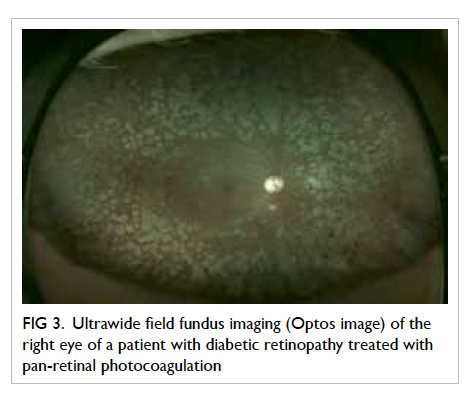
Recently, ultrawide field fundus imaging (UWFI) has shown that a 100° to 200° field view of the retina can be acquired without pupil dilatation (Optos P200MA and Optos P200C imagers; Optos, Fife, UK) [Fig 3]. It has the benefits of reducing ungradable images, increasing disease detection, and shortening image evaluation times.44 45 Since it can detect more retinopathy and can detect other peripheral retinal pathology, such as retinal detachment and ocular tumours, UWFI provides a more ‘complete’ retinal examination. Although the image quality of the photo is not as good as traditional fundus photography, it is gradually improving. It is also very expensive and there is colour distortion of the images. With further advancements, it may play a role in DR screening in the future.
 

Figure 3. Ultrawide field fundus imaging (Optos image) of the right eye of a patient with diabetic retinopathy treated with pan-retinal photocoagulation
 
Another recent technique, cell phone–based technique, has been used in which a handheld condensing lens paired with a smartphone camera can capture images at low cost.46
 
Methods used in screening programmes
Several countries have implemented national screening programmes including Iceland, ENSP in the UK, and the OPHDIAT (a telemedical network screening system for DR) in France.47 48 49 In the OPHDIAT programme, fundus photographs are first taken with non-mydriatic cameras at satellite screening centres by technicians before they are transferred via a telemedicine network to ophthalmologists for grading.49 In India, similar telescreening is being carried out for DR in South India, in which 45° single-field digital fundus photographs are taken and images transmitted digitally for grading by retina specialists.50 In the UK, DR graders are not medically trained but they undergo vigorous training by ophthalmologists and have to carry out a minimum number of grading episodes. There are also very stringent quality control processes, top-up training, and revalidation processes in place to guarantee quality. Once patients enter the screening programme, most are not required to undergo clinical examination by an ophthalmologist unless in cases of STDR or if there are ungradable fundus photographs or there is any other eye disease that warrants management by an ophthalmologist.
 
There is an additional role for general practitioners, diabetic nurses, dieticians, and others in a DR-related programme, such as the risk assessment and management programme (RAMP) in the Hospital Authority, Hong Kong. The RAMP is a primary health care programme that aims to screen patients for chronic systemic diseases including, in particular, hypertension and DM including DR.51 Type 2 DM is a disease of multiple aetiologies in which both genetic and environmental factors, particularly lifestyle, play a significant role. Lifestyle modification is therefore important. The RAMP in Hong Kong tries to implement a comprehensive package by being holistic—screening for renal diseases, examining feet and eyes, monitoring blood pressure and other cardiovascular risk factors, and educating patients about lifestyle modification. The RAMP programme in Hong Kong has been successful in controlling HbA1c and blood pressure in many subjects and should help to reduce the incidence, prevalence, and severity of DR.52
 
Thus, DR screening can be effectively performed by ophthalmologists, optometrists, or specially trained graders, and other professionals play an important part in its wider aspects.
 
Classification of diabetic retinopathy in screening programmes
The most commonly adopted clinical classification of DR is NPDR and PDR. From a screening perspective, however, DR is best classified as (1) STDR or vision-threatening diabetic retinopathy (VTDR) or (2) non-STDR (or non-VTDR), as STDR warrants referral to an ophthalmologist for further management while patients with non-STDR can remain in the screening programme for further monitoring. Yau et al6 highlighted the methods of screening and DR grading used in various clinical studies and found that most studies use ETDRS and its modification or the AAO International Clinical Diabetic Retinopathy Disease Severity Scale. Using this classification, DR severity is categorised as NPDR (levels 20-53) or PDR (≥level 60). For diabetic macular oedema, there is more diversity. Some studies consider diabetic macular oedema to be present if there is retinal thickening within one disc diameter of the centre of the macula or if there is a history of macular oedema with a history of photocoagulation.6 Other studies consider the presence of macular oedema if there are hard exudates within one disc diameter of the macula or in addition to hard exudates, presence of microaneurysm and blot haemorrhage within one disc diameter from the foveal centre or the presence of focal photocoagulation scars in the macular area.53 54
 
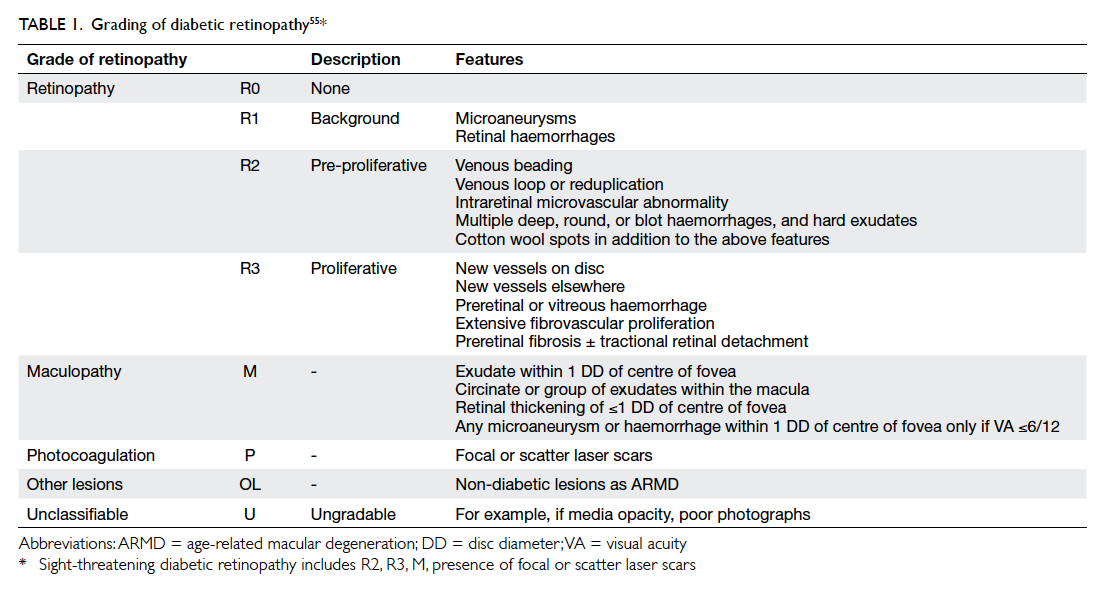
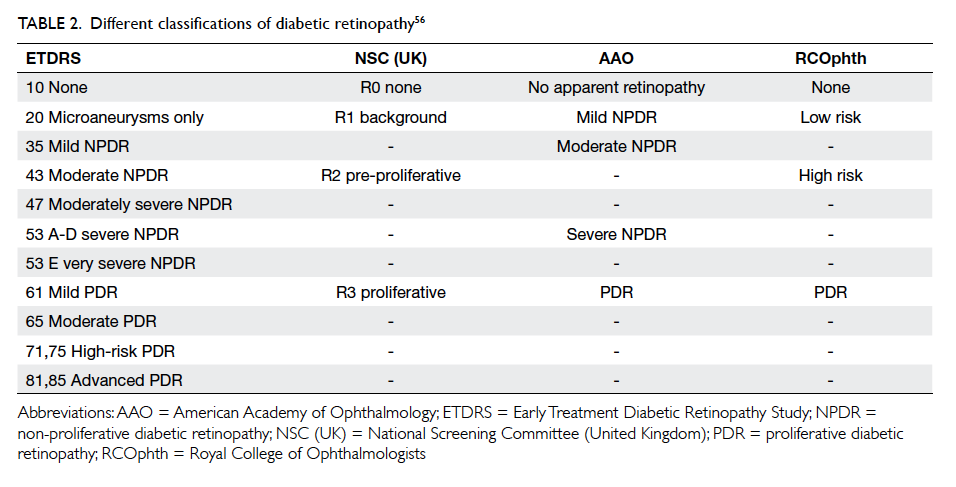
The ENSP grading system has grades of no DR (R0), mild NPDR (R1), pre-PDR (R2) that includes moderate and severe NPDR grades, and PDR (R3) [Table 1].55 Maculopathy is said to be present when there is hard exudate within one disc diameter of the centre of the fovea or microaneurysm or dot haemorrhage within one disc diameter of the centre of fovea in the presence of visual acuity of ≤6/12 in the absence of any other obvious cause.55 The screening outcomes in ENSP include: annual screening, referral to an ophthalmologist (for pre-PDR, which could be moderate or severe NPDR, and maculopathy), and fast-track referral (for PDR). Although there are different DR classifications, most can be converted using a conversion table (Table 2).56
 

Table 1. Grading of diabetic retinopathy55
 

Table 2. Different classifications of diabetic retinopathy56
 
Systematic diabetic retinopathy screening in Hong Kong
Screening procedure
Diabetes is prevalent in Hong Kong with an estimated 10% of the population afflicted.57 As previously described, the Hospital Authority, the major public health care provider in Hong Kong, started a multidisciplinary RAMP for patients receiving DM care in primary care out-patient clinics known as general out-patient clinics. All enrolled patients in RAMP undergo comprehensive screening for diabetic complications including systematic DR screening, following the ENSP guideline, which was started in Hong Kong in 2010. As well as RAMP attempting to educate and modify the patient risk factors such as blood sugar level (HbA1c), blood pressure, blood lipids, body weight and smoking habit, patients receive treatment from doctors and further counselling from nurses about the results of tests including the retinopathy result.
 
The DR screening procedure consists of checking habitual and pinhole visual acuity in each eye using an ETDRS chart. Pupils are dilated and non-stereoscopic digital colour retinal fundus photographs are taken for each patient: two photographs are taken for each eye—one centred at the macula and the other centred at the optic disc.
 
Grading procedure in diabetic retinopathy screening in risk assessment and management programme in Hong Kong
Based on the ENSP, all fundus photographs are graded on the digital monitors with a spatial resolution of 1024 x 768 pixels, by trained optometrists and an ophthalmologist, for presence/absence and severity of DR.26 55 The fundus photographs undergo grading by a primary grader, secondary grader, and arbitration grader as per ENSP. Fundus photographs that are not assessable are considered as ungradable. Patients with STDR (grades R2, R3, maculopathy, and ungradable) are referred to specialist ophthalmology clinics of the Hospital Authority for further management. By applying the Icelandic model, patients with grades R0 or R1 are usually scheduled for their next screening appointment in 12 months or later unless they are considered at high risk for STDR, based on risk factors including HbA1c and blood pressure, in which case, they will be screened at a shorter screening interval. Some RAMP clinics use the Icelandic model as a reference to stratify the individual risk of STDR based on the level of risk factors.
 
Grader requirements and quality assurance
The graders undergo a structured training programme to identify different features of DR, periodic assessments, and continuous monitoring of grading performance. The graders are required to achieve and maintain sensitivity of ≥95% and specificity of ≥85% at all levels of grading. For quality assurance, a set of images were sent to an international DR grading centre, the Ophthalmic Reading Centre, Royal Liverpool University Hospital, Liverpool, UK, and the grades given were compared with those given by the local Hong Kong graders. There was a high level of agreement between the local graders and those from the international grading centre (unpublished data).
 
This screening system in Hong Kong has the advantage of taking digital fundus photographs, which is feasible, affordable in terms of time and cost, reproducible, and allows a relatively easy grading process. The major challenge in this method is the number of referrals generated—particularly for patients with maculopathy. In ENSP, patients who have a single-dot haemorrhage or exudate close to the fovea are referred to the specialist ophthalmology clinic. Most of these patients, particularly mild cases who do not have clinically significant macular oedema, do not require treatment or intervention. In addition, patients with grade R2, which includes grades of moderate and severe NPDR, may or may not need immediate treatment. Nevertheless, the system used in Hong Kong is cautious in that the patients with STDR who require treatment will be identified earlier rather than later.
 
Prevalence of diabetic retinopathy/sight-threatening diabetic retinopathy from systematic screening
From August 2010 to March 2014, a total of 262 661 screening episodes were performed with a total number of 174 532 patients receiving DR screening. The prevalence of any DR at first screening was 39% (68 058/174 532) and of STDR 9.8% (17 116/174 532).58
 
The future of diabetic retinopathy screening
 
Screening of DR is currently performed by trained professionals, such as ophthalmologists, optometrists, or specially trained graders. Since it requires screening of large populations and is time-consuming, the role of automated grading is currently being explored. In this, a computer system uses image processing and pattern recognition techniques to detect the lesions of DR. The pattern recognition consists of two distinct methods: the digital image processing method and the neural network method. The image processing method is suitable for detecting and counting early lesions of DR such as haemorrhages, microaneurysms, hard exudates, and cotton wool spots. The neural network method is suitable for solving pattern recognition problems such as lesion patterns of various stages of severity of DR; thus the neural network method is helpful in grading DR.59 Results from computer-aided analysis of the retina or automated analysis of diabetic subjects, based on the appearance of blood vessels in their ocular fundus, are encouraging.60 61 An internet-based tele-ophthalmology system could correctly identify clinically significant macular oedema and PDR based on Joint Photographic Experts Group–compressed stereoscopic photographic files when compared with standard ETDRS-graded stereoscopic slide film photography.62 Researchers are now focusing on automated diagnosis of retinopathy by content-based image retrieval that is the process of retrieving related images from a large database collection based on their pictorial content.62
 
Use of optical coherence tomography in screening
Optical coherence tomography (OCT) provides high-resolution in-vivo imaging of the different cellular layers of the macula (Fig 4).25 It is an important non-invasive procedure that has revolutionised the management of diabetic macular oedema in a way that helps to assess and monitor macular thickness, monitor macular oedema, identify vitreomacular traction and other forms of macular abnormalities in patients with diabetic macular oedema.25 63 Classification by OCT of diabetic macular oedema helps to objectively quantify and monitor the severity of macular oedema (Table 3).63 64 65 In the DR screening programmes using non-stereoscopic digital retinal photos, the presence of maculopathy is judged using 2-dimensional fundus photographs and many cases identified in this way do not warrant treatment. Recently ENSP has started introducing OCT as a screening tool for maculopathy at their screening sites (unpublished data).
 

Figure 4. Optical coherence tomographic image of a patient with diabetic macular oedema demonstrating ovoid cystic spaces (white arrows)
 

Table 3. Optical coherence tomographic (OCT) classification of diabetic macular oedema65
 
Conclusion
This review has summarised the recommendations and methods of DR screening adopted in various countries globally and in Hong Kong. Development of low-cost cameras with integration of DR screening in public health care programmes could facilitate the availability of DR screening to populations of different income groups in various countries, particularly in developing countries. Sustainability of a quality-assured screening programme, ensuring that patients are compliant with appropriate screening intervals and treatment, is one of the greatest challenges that can be overcome by educating the population and empowering primary eye care workers and health care workers. Continued efforts are required by all eye care professionals.
 
Declaration
All authors have disclosed no conflicts of interest.
 
References
1. Gakidou E, Mallinger L, Abbott-Klafter J, et al. Bulletin of the World Heath Organization. Management of diabetes and associated cardiovascular risk factors in seven countries: a comparison of data from national health examination surveys. Available from: http://www.who.int/bulletin/volumes/89/3/10-080820/en/#. Accessed 22 Oct 2015.
2. World Health Organization. Diabetes programme: diabetes. Available from: http://www.who.int/diabetes/en/. Accessed 13 Jan 2016.
3. World Health Organization. Media centre: diabetes. Available from: http://www.who.int/mediacentre/factsheets/fs312/en/. Accessed 13 Jan 2016.
4. Dodson PM. Diabetic retinopathy: screening to treatment. Oxford: Oxford University Press; 2008. Crossref
5. Fowler MJ. Microvascular and macrovascular complications of diabetes. Clin Diabetes 2008;26:77-82. Crossref
6. Yau JW, Rogers SL, Kawasaki R, et al. Global prevalence and major risk factors of diabetic retinopathy. Diabetes Care 2012;35:556-64. Crossref
7. Zhu CH, Zhang SS, Kong Y, Bi YF, Wang L, Zhang Q. Effects of intensive control of blood glucose and blood pressure on microvascular complications in patients with type II diabetes mellitus. Int J Ophthalmol 2013;6:141-5.
8. Stratton IM, Kohner EM, Aldington SJ, et al. UKPDS 50: risk factors for incidence and progression of retinopathy in Type II diabetes over 6 years from diagnosis. Diabetologia 2001;44:156-63. Crossref
9. Matthews DR, Stratton IM, Aldington SJ, Holman RR, Kohner EM, Group UKPDS. Risks of progression of retinopathy and vision loss related to tight blood pressure control in type 2 diabetes mellitus: UKPDS 69. Arch Ophthalmol 2004;122:1631-40. Crossref
10. Preliminary report on effects of photocoagulation therapy. The Diabetic Retinopathy Study Research Group. Am J Ophthalmol 1976;81:383-96. Crossref
11. Treatment techniques and clinical guidelines for photocoagulation of diabetic macular edema. Early Treatment Diabetic Retinopathy Study report number 2. Early Treatment Diabetic Retinopathy Study Research Group. Ophthalmology 1987;94:761-74.
12. Early photocoagulation for diabetic retinopathy. ETDRS report number 9. Early Treatment Diabetic Retinopathy Study Research Group. Ophthalmology 1991;98(5 Suppl):766S-785S.
13. Wenick AS, Bressler NM. Diabetic macular edema: current and emerging therapies. Middle East Afr J Ophthalmol 2012;19:4-12. Crossref
14. Stewart MW. Anti-VEGF therapy for diabetic macular edema. Curr Diab Rep 2014;14:510. Crossref
15. Garg S, Davis RM. Diabetic retinopathy screening update. Clin Diabetes 2009;27:140-5. Crossref
16. Happich M, Reitberger U, Breitscheidel L, Ulbig M, Watkins J. The economic burden of diabetic retinopathy in Germany in 2002. Graefes Arch Clin Exp Ophthalmol 2008;246:151-9. Crossref
17. Wilson JM, Jungner G. Principles and practice of screening for disease. Geneva: World Health Organization; 1968.
18. Rohan TE, Frost CD, Wald NJ. Prevention of blindness by screening for diabetic retinopathy: a quantitative assessment. BMJ 1989;299:1198-201. Crossref
19. Stefánsson E, Bek T, Porta M, Larsen N, Kristinsson JK, Agardh E. Screening and prevention of diabetic blindness. Acta Ophthalmol Scand 2000;78:374-85. Crossref
20. Crijns H, Casparie AF, Hendrikse F. Continuous computer simulation analysis of the cost-effectiveness of screening and treating diabetic retinopathy. Int J Technol Assess Health Care 1999;15:198-206. Crossref
21. Jones S, Edwards RT. Diabetic retinopathy screening: a systematic review of the economic evidence. Diabet Med 2010;27:249-56. Crossref
22. Javitt JC, Aiello LP. Cost-effectiveness of detecting and treating diabetic retinopathy. Ann Intern Med 1996;124:164-9. Crossref
23. Lian J, McGhee SM, Gangwani RA, et al. The impact of a co-payment on the cost-effectiveness of screening for diabetic retinopathy. J Public Health (Oxf) 2015 Nov 14. Epub ahead of print. Crossref
24. Diabetes care and research in Europe: the Saint Vincent declaration. Diabet Med 1990;7:360. Crossref
25. American Academy of Ophthalmology. Diabetic retinopathy preferred practice pattern guidelines 2014. Available from: http://one.aao.org/preferred-practice-pattern/diabetic-retinopathy-ppp-2014. Accessed 10 Jan 2015.
26. Harding S, Greenwood R, Aldington S, et al. Grading and disease management in national screening for diabetic retinopathy in England and Wales. Diabet Med 2003;20:965-71. Crossref
27. Harding S, Garvican L, Talbot J. The impact of national diabetic retinopathy screening on ophthalmology: the need for urgent planning. Eye (Lond) 2005;19:1009-11. Crossref
28. Screening for diabetic retinopathy in Europe 15 years after the St. Vincent Declaration. Available from: http://reseau-ophdiat.aphp.fr/Document/Doc/confliverpool.pdf. Accessed 6 Oct 2015.
29. Ministry of Public Health. Thailand healthy lifestyle strategic plan 2011-2020. Bangkok, Thailand: The War Veterans Organizations of Thailand; 2011: 58.
30. World Diabetes Foundation mobile eye care WDF08-395. Available from: http://www.worlddiabetesfoundation.org/projects/thailand-wdf08-395. Accessed 8 Apr 2013.
31. American Diabetes Association. Standards of medical care in diabetes—2014. Diabetes Care 2014;37 Suppl 1:S14-80. Crossref
32. Diabetes—diabetic eye screening. Available from: http://www.nhs.uk/conditions/Diabetes/Pages/diabetic-eye-screening.aspx. Accessed 13 Jan 2016.
33. Aspelund T, Thornórisdóttir O, Olafsdottir E, et al. Individual risk assessment and information technology to optimise screening frequency for diabetic retinopathy. Diabetologia 2011;54:2525-32. Crossref
34. McGhee S, Harding SP, Wong D. Individual risk assessment and information technology to optimise screening frequency for diabetic retinopathy by Aspelund et al. (2011) Diabetologia 54:2525-2532. Graefes Arch Clin Exp Ophthalmol 2012;250:477-8. Crossref
35. Grading diabetic retinopathy from stereoscopic color fundus photographs—an extension of the modified Airlie House classification. ETDRS report number 10. Early Treatment Diabetic Retinopathy Study Research Group. Ophthalmology 1991;98(5 Suppl):786S-806S. Crossref
36. Ryder RE, Vora JP, Atiea JA, Owens DR, Hayes TM, Young S. Possible new method to improve detection of diabetic retinopathy: Polaroid non-mydriatic retinal photography. Br Med J (Clin Res Ed) 1985;291:1256-7. Crossref
37. Ku JJ, Landers J, Henderson T, Craig JE. The reliability of single-field fundus photography in screening for diabetic retinopathy: the Central Australian Ocular Health Study. Med J Aust 2013;198:93-6. Crossref
38. Williams GA, Scott IU, Haller JA, Maguire AM, Marcus D, McDonald HR. Single-field fundus photography for diabetic retinopathy screening: a report by the American Academy of Ophthalmology. Ophthalmology 2004;111:1055-62. Crossref
39. Scanlon PH, Malhotra R, Greenwood RH, et al. Comparison of two reference standards in validating two field mydriatic digital photography as a method of screening for diabetic retinopathy. Br J Ophthalmol 2003;87:1258-63. Crossref
40. Boucher MC, Gresset JA, Angioi K, Olivier S. Effectiveness and safety of screening for diabetic retinopathy with two nonmydriatic digital images compared with the seven standard stereoscopic photographic fields. Can J Ophthalmol 2003;38:557-68. Crossref
41. Scanlon PH. The English national screening programme for sight-threatening diabetic retinopathy. J Med Screen 2008;15:1-4. Crossref
42. Lin DY, Blumenkranz MS, Brothers RJ, Grosvenor DM. The sensitivity and specificity of single-field nonmydriatic monochromatic digital fundus photography with remote image interpretation for diabetic retinopathy screening: a comparison with ophthalmoscopy and standardized mydriatic color photography. Am J Ophthalmol 2002;134:204-13. Crossref
43. Vujosevic S, Benetti E, Massignan F, et al. Screening for diabetic retinopathy: 1 and 3 nonmydriatic 45-degree digital fundus photographs vs 7 standard early treatment diabetic retinopathy study fields. Am J Ophthalmol 2009;148:111-8. Crossref
44. Silva PS, Cavallerano JD, Tolls D, et al. Potential efficiency benefits of nonmydriatic ultrawide field retinal imaging in an ocular telehealth diabetic retinopathy program. Diabetes Care 2014;37:50-5. Crossref
45. Kim JD, Warren C, Shachar T, Goldberg MR, Kim JE. Comparison of non-mydriatic ultra-widefield fundus photography to standard early treatment of diabetic retinopathy study 7-fields in diabetic retinopathy screening. Invest Ophthalmol Vis Sci 2015;56:600.
46. Haddock LJ, Kim DY, Mukai S. Simple, inexpensive technique for high-quality smartphone fundus photography in human and animal eyes. J Ophthalmol 2013;2013:518479. Crossref
47. Olafsdottir E, Stefánsson E. Biennial eye screening in patients with diabetes without retinopathy: 10-year experience. Br J Ophthalmol 2007;91:1599-601. Crossref
48. Kristinsson JK. Diabetic retinopathy. Screening and prevention of blindness. A doctoral thesis. Acta Ophthalmol Scand Suppl 1997;(223):1-76.
49. Massin P, Chabouis A, Erginay A, et al. OPHDIAT: a telemedical network screening system for diabetic retinopathy in the Ile-de-France. Diabetes Metab 2008;34:227-34. Crossref
50. Raman R, Bhojwani DN, Sharma T. How accurate is the diagnosis of diabetic retinopathy on telescreening? The Indian scenario. Rural Remote Health 2014;14:2809.
51. Fung CS, Chin WY, Dai DS, et al. Evaluation of the quality of care of a multi-disciplinary risk factor assessment and management programme (RAMP) for diabetic patients. BMC Fam Pract 2012;13:116. Crossref
52. Jiao FF, Fung CS, Wong CK, et al. Effects of the Multidisciplinary Risk Assessment and Management Program for Patients with Diabetes Mellitus (RAMP-DM) on biomedical outcomes, observed cardiovascular events and cardiovascular risks in primary care: a longitudinal comparative study. Cardiovasc Diabetol 2014;13:127. Crossref
53. Klein BE. Overview of epidemiologic studies of diabetic retinopathy. Ophthalmic Epidemiol 2007;14:179-83. Crossref
54. Rema M, Premkumar S, Anitha B, Deepa R, Pradeepa R, Mohan V. Prevalence of diabetic retinopathy in urban India: the Chennai Urban Rural Epidemiology Study (CURES) eye study, I. Invest Ophthalmol Vis Sci 2005;46:2328-33. Crossref
55. Kinshuck D. Examining and grading retinopathy, for professionals. Available from: http://www.diabeticretinopathy.org.uk/gradingretinopathy.htm. Accessed 20 Aug 2015.
56. The Royal College of Ophthalmologists. Diabetic retinopathy guidelines. Available from: https://www.rcophth.ac.uk/wp-content/uploads/2014/12/2013-SCI-301-FINAL-DR-GUIDELINES-DEC-2012-updated-July-2013.pdf. Accessed 6 Nov 2015.
57. International Diabetes Federation. IDF diabetes atlas 6th edition, 2013. Available from: http://www.idf.org/diabetesatlas. Accessed 20 Aug 2015.
58. Lian JX, Gangwani RA, McGhee SM, et al. Systematic screening for diabetic retinopathy (DR) in Hong Kong: prevalence of DR and visual impairment among diabetic population. Br J Ophthalmol 2016;100:151-5. Crossref
59. Lee SC, Lee ET, Kingsley RM, et al. Comparison of diagnosis of early retinal lesions of diabetic retinopathy between a computer system and human experts. Arch Ophthalmol 2001;119:509-15. Crossref
60. Niemeijer M, van Ginneken B, Cree MJ, et al. Retinopathy online challenge: automatic detection of microaneurysms in digital color fundus photographs. IEEE Trans Med Imaging 2010;29:185-95. Crossref
61. Li Q, You J, Zhang D. Vessel segmentation and width estimation in retinal images using multiscale production of matched filter responses. Expert Syst Appl 2012;39:7600-10. Crossref
62. Chaum E, Karnowski TP, Govindasamy VP, Abdelrahman M, Tobin KW. Automated diagnosis of retinopathy by content-based image retrieval. Retina 2008;28:1463-77. Crossref
63. Virgili G, Menchini F, Murro V, Peluso E, Rosa F, Casazza G. Optical coherence tomography (OCT) for detection of macular oedema in patients with diabetic retinopathy. Cochrane Database Syst Rev 2011;(7):CD008081. Crossref
64. Al Kharousi N, Wali UK, Azeem S. Current applications of optical coherence tomography in ophthalmology. Available from: http://www.intechopen.com/books/optical-coherence-tomography/current-applications-of-optical-coherence-tomography-in-ophthalmology. Accessed 13 Jan 2016.
65. Kim BY, Smith SD, Kaiser PK. Optical coherence tomographic patterns of diabetic macular edema. Am J Ophthalmol 2006;142:405-12. Crossref

Extracorporeal blood purification for sepsis

Hong Kong Med J 2016 Oct;22(5):478–85 | Epub 19 Aug 2016
DOI: 10.12809/hkmj164876
© Hong Kong Academy of Medicine. CC BY-NC-ND 4.0
 
REVIEW ARTICLE
Extracorporeal blood purification for sepsis
HP Shum, FRCP, FHKAM (Medicine)1; WW Yan, FRCP, FHKAM (Medicine)1; TM Chan, MD, FHKAM (Medicine)2
1 Department of Intensive Care, Pamela Youde Nethersole Eastern Hospital, Chai Wan, Hong Kong
2 Department of Medicine, The University of Hong Kong, Queen Mary Hospital, Pokfulam, Hong Kong
 
Corresponding author: Dr HP Shum (shumhp@ha.org.hk)
 
 
 Full paper in PDF
 
Abstract
It has been speculated that extracorporeal blood purification therapies might improve the clinical outcome for patients with severe sepsis, with or without acute kidney injury, since the removal of inflammatory mediators and/or bacterial toxins from circulation could modulate the inflammatory responses that result in organ damage. Despite initial enthusiasm based on promising preliminary results, subsequent investigations did not show sustainable survival benefit. We review the principles and development of blood purification techniques for sepsis and septic acute kidney injury.


Introduction
The concepts underlying the pathogenesis of septic acute kidney injury (AKI) are complex. It is characterised by renal macro- and micro-circulatory disturbance, surge of inflammatory markers, and de-regulation of oxidative stress, followed by a bioenergetic adaptive response and controlled cell cycle arrest aimed at preventing cell death.1 Continuous renal replacement therapy is commonly performed in the critical care setting for patients with septic AKI. The use of low- or normal-volume continuous venovenous haemodialysis or haemofiltration, however, has failed to demonstrate any improvement of patient outcome in severe sepsis.2 3 Extracorporeal blood purification therapies have been proposed to improve the outcome for patients with severe sepsis with and without AKI. The underlying principle is the removal of excessive inflammatory mediators and/or bacterial toxins from the blood compartment in order to modulate the inflammatory response. This involves various techniques including haemoperfusion/haemoadsorption, high-adsorption haemofiltration, high-volume haemofiltration (HVHF), high cut-off (HCO) membrane haemofiltration/haemodialysis, plasma exchange, and coupled plasma filtration adsorption (CPFA) [Table 1]. These techniques are gaining popularity in Europe and Japan. This overview discusses the concept and latest advances in blood purification for sepsis and septic AKI.
 

Table 1. Comparison between major blood purification techniques
 
Therapeutic concept of extracorporeal blood purification
During sepsis, triacylated peptides, diacylated peptides, or lipopolysaccharides (LPS) are released by pathogens, and are recognised by the Toll-like receptors located on the surface of antigen-presenting cells.4 5 Toll-like receptors also recognise locally produced damage-associated molecular patterns (DAMPs) from ischaemic renal tissue and circulating DAMPs released from extensive extrarenal tissue damage in sepsis.6 This triggers the activation of leukocytes, endothelial cells, and epithelial cells that release more inflammatory mediators such as tumour necrosis factor–alpha (TNF-α), interleukin-1 (IL-1), IL-6, IL-8 and IL-10, causing cellular and tissue damage.7 8 This is called a ‘cytokine storm’, and can also occur in non-infectious conditions such as severe trauma, extensive burns, acute necrotising pancreatitis, and post–cardiac arrest. A cytokine storm per se, in the absence of life-threatening triggering factors, can induce haemodynamic instability and multi-organ failure as illustrated by Suntharalingam et al.9 Moreover, immunoparalysis might occur after a cytokine storm and contribute to severe secondary nosocomial infections.10 As demonstrated in a postmortem by Boomer et al,11 patients who die of severe sepsis have biochemical and immunohistochemical findings consistent with immunosuppression. This gives rise to the concept of immunomodulation in sepsis. Low-dose steroid administration has been shown to improve septic shock reversal but is not associated with any survival benefits and is currently out of favour.12 13 The clinical benefit of intravenous immunoglobulins and anti–TNF-α in the treatment of severe sepsis is controversial and inconclusive.14 15 Blood purification may offer non-specific clearance of inflammatory mediators and/or microbial toxins and thus help to restore immune homeostasis. Five theories have been proposed to explain the potential benefit of blood purification in sepsis. First, Ronco et al16 proposed the “cytokine peak concentration hypothesis” and suggested that eliminating the peaks in cytokine blood concentration during the early phase of sepsis could stop the inflammatory cascade, limit organ damage, and consequently decrease the incidence of multi-organ failure syndrome. Second, Honoré and Matson17 proposed the “threshold immunomodulation hypothesis” that indicated cytokines will equilibrate between the blood and tissue compartments. This provided an explanation for the clinical benefit of blood purification techniques even without any significant changes in cytokine level within the blood compartment. Third, Di Carlo and Alexander18 proposed the “mediator delivery hypothesis” and suggested that high-volume fluid replacement during haemofiltration might promote lymphatic flow and displace inflammatory mediators to the blood compartment, making them available for removal. Fourth, Peng et al19 suggested that blood purification therapies could act directly at the cellular level to restore immune function. Finally, Rimmelé and Kellum20 proposed the “cytokinetic model” which indicated that blood purification techniques remove cytokines from the blood compartment and widen the cytokine/chemokine concentration gradient between blood and infected tissue. This improves leukocyte trafficking towards the infective foci, and thus promotes bacterial killing.
 
Haemoperfusion/haemoadsorption
This technique binds toxins and other mediators in the extracorporeal circuit and removes them from the blood compartment.20 The sorbents, which consist of microfibres or resin-covered beads, are normally contained in cartridges that are placed in series within the extracorporeal circuit. They have a selective or non-selective binding capacity for cytokines, chemokines, super-antigens, or endotoxins by means of hydrophobic interaction, van der Waals forces, or ionic interactions.20 Initial clinical applications were complicated by severe thrombocytopenia and leukopenia but these were subsequently managed using a biocompatible coating.
 
Polymyxin B–immobilised fibre column
Polymyxin B (PMX)–immobilised fibre column haemoperfusion (Toraymyxin, Toray Industries, Tokyo, Japan) is the most commonly used approach, and has been used for the treatment of septic shock since 1994 in Japan and since 2002 in Europe. It has gained popularity worldwide in recent years, especially after the landmark EUPHAS (Early Use of Polymyxin B Hemoperfusion in Abdominal Sepsis) study.21 The PMX is a group of cyclic cationic polypeptide antibiotics derived from Bacillus polymyxa. Endotoxins are heat and pH stable, and thus can be difficult to remove from protein-rich solutions such as blood. The PMX is capable of binding and neutralising endotoxins. Nephrotoxicity and neurotoxicity, however, are very common and thus limit their clinical use.22 To overcome this problem, PMX is immobilised onto polystyrene fibres that effectively remove endotoxin without leaching. The blood is perfused at a rate of 80 to 100 mL/min through a PMX-immobilised fibre column. Anticoagulation is achieved using unfractionated heparin, low-molecular-weight heparin, or the protease inhibitor nafamostat mesylate. Treatment usually lasts for 2 to 27 hours once or in some patients up to 4 times, depending on the clinical response. Three meta-analyses (approximately 1000 patients) were published before 2015: Studies by Mitaka and Tomita23 (17 studies, 975 patients) and Cruz et al24 (28 studies, 1425 patients) included both randomised controlled trials (RCTs) and observational studies. When reported, Gram-negative infections were identified in approximately 70% of patients (range, 37.9%-100% in individual studies). In general, PMX treatment led to significant haemodynamic improvement with a reduction in the use of inotropic agents/vasopressors in patients with sepsis. Moreover, it was associated with a decreased endotoxin level, modulation of inflammatory markers, and improvement of the PaO2/FiO2 ratio (ratio of the partial pressure of oxygen in arterial blood to the inspired oxygen fraction) in most included studies.23 24 Treatment by PMX significantly reduced 28-day mortality compared with conventional therapy. The meta-analysis by Zhou et al25 (8 studies, 370 patients) included RCTs only and focused on mortality, and showed significant survival benefit compared with conventional treatment. Only a few clinically important adverse effects were reported during PMX haemoperfusion, including cartridge clotting, hypotension, and hypersensitivity. Nonetheless, the largest multicentre RCT (232 patients) testing the performance of PMX haemoperfusion in peritonitis-induced septic shock was published in April 2015, and reported contrasting findings.26 No significant differences in 28-day mortality (27.7% in PMX-treated group vs 19.5% in controls; P=0.14), haemodynamic patterns, or organ failure evolution were observed. This negative result was similar to a large retrospective study (642 patients) by Iwagami et al27 who examined the effect of postoperative PMX haemoperfusion on peritonitis-induced septic shock. Patients treated with one or two PMX haemoperfusion sessions showed similar mortality at day 28 (17%) to propensity-matched patients without PMX treatment (16.3%). EUPHRATES (safety and efficacy of PMX haemoperfusion for septic shock study), a very large multicentre US-based phase III trial in patients with confirmed endotoxaemia, is currently underway and results should be available after July 2017.28 Based on current evidence, the clinical benefit of PMX haemoperfusion in Gram-negative sepsis is unclear. Moreover, the cost of individual haemoperfusion cartridges is very high (approximately HK$40 000 per cartridge) and limits its clinical use in local settings. Currently, PMX-immobilised fibre column haemoperfusion is not available in Hong Kong.
 
MATISSE-Fresenius system
The MATISSE-Fresenius system (Fresenius SE, Bad Homburg, Germany) binds endotoxins to human albumin. The extracorporeal circuit is maintained by the Fresenius haemoadsorption machine using the MATISSE haemoadsorber that contains human serum albumin immobilised on polymethacrylate beads. Trends in the improvement of morbidity and organ dysfunction were reported in initial non-randomised studies,29 30 although a subsequent multicentre RCT could not identify any significant clinical benefit, which then limited its clinical use.31 Currently, the MATISSE-Fresenius system is not available in Hong Kong.
 
Alteco Lipopolysaccharide Adsorber
The Alteco LPS Adsorber (Alteco Medical AB, Lund, Sweden) captures endotoxins using specially designed synthetic peptides. This device was launched in 2006. Tailor-made synthetic peptides with a high affinity for endotoxins are attached to the surface of the polyethylene plates using a covalent bonding technique. Clinical experience with this device is scarce, and is limited mainly to case reports and case series.32 33 34 In general, these case series report a shorter vasopressor infusion duration in adsorber-treated patients compared with controls. Only one underpowered RCT has been published by local investigators.35 The study was terminated early and showed no significant clinical benefit (disease severity score, vasopressor use, length of study, and 28-day mortality) following the addition of the Alteco LPS Adsorber to conventional therapy in patients who had intra-abdominal sepsis with shock.35 The side-effect profile of this novel device was acceptable but a recent ex-vivo experimental study showed that the Alteco LPS Adsorber could not achieve acceptable LPS clearance in serum, heparinised plasma, or whole blood.36 Therefore, the potential benefit of the Alteco LPS Adsorber in sepsis is not clear.
 
Cytokines haemoadsorptive device
Several cytokine-absorbing columns have been tested in animal studies, showing excellent adsorption rates for inflammatory cytokines such as TNF-α, IL-1β, IL-6, and IL-8.37 Human data are limited to case reports and case series.38 39 40 CytoSorb (CytoSorbents Corporation; Monmouth Junction [NJ], US) is a novel synthetic haemabsorption column that targets inflammatory mediators.41 It is currently the only European-approved extracorporeal device for cytokine haemoadsorption. Case reports show good cytokine clearance and haemodynamic improvement with this device.41 42 43 44 Further studies focused on clinically relevant endpoints are highly recommended. CytoSorb is not available in Hong Kong.
 
High-adsorption haemofiltration
The AN69 and polymethylmethacrylate (PMMA) membrane haemofilters are the currently available options for performing high-adsorption haemofiltration in septic patients. Both have a high cytokine adsorption capacity but surface treatment can further modify their haemoadsorptive properties.45 46 47
 
oXiris haemofilter
oXiris (Gambro Hospal, Stockholm, Sweden) is an AN69-based membrane haemofilter that is surface-treated with a polyethyleneimine and grafted with heparin (Table 2). The AN69 core membrane has superior cytokine-binding capacity compared with the traditional polysulphone membrane. Surface treatment with polyethyleneimine enhances endotoxin capture,48 while heparin coating reduces membrane thrombogenicity, and prolongs the filter life and improves efficiency. A case-control study by Shum et al49 involving Gram-negative septicaemic patients (n=6) showed that oXiris continuous venovenous haemofiltration (CVVH) was associated with a greater reduction in Sequential Organ Failure Assessment score compared with conventional polysulphone-based CVVH (n=24). Subsequent large case series (n=40) suggested that oXiris treatment had a positive effect on haemodynamics with a reduction in cytokine levels (IL-6).50 Treatment usually lasts for 72 hours (manufacturer’s recommendation) and costs approximately HK$8000 per haemofilter. As of mid 2015, at least five public hospitals in Hong Kong have clinical experience with oXiris haemofilters in the treatment of septic shock. A large-scale RCT will be necessary to determine the potential benefit of this device, however.
 

Table 2. Characteristics of locally available filters used in high cut-off haemodialysis, highly adsorptive haemofiltration, and plasmapheresis
 
Polymethylmethacrylate haemofilter
The PMMA membrane has a higher cytokine adsorption capacity than the traditional polyacrylonitrile and polysulphone membrane.51 Membrane binding site saturation is one of the main concerns during treatment involving highly adsorptive haemofiltration. The PMMA haemofilter can maintain its cytokine adsorption capacity for at least 24 hours after being changed.52 The initial clinical experience of PMMA continuous haemodiafiltration in the treatment of sepsis is encouraging, with significant haemodynamic improvement and potential survival benefit.53 54 A local RCT (Australian New Zealand Clinical Trial Registry ACTRN12611000652976) that is aimed at investigating the clinical benefit of PMMA-based CVVH in patients with septic shock and AKI is currently underway. Treatment usually lasts for 24 to 48 hours and costs approximately HK$300 per haemofilter.
 
High-volume haemofiltration
In 2002, HVHF was defined as >35 mL/kg/h, based on recommendations from the Acute Dialysis Quality Initiative Workgroup.55 Nonetheless in clinical practice, 35 mL/kg/h is not that high and can be achieved with ease, especially in those with low body weight. To clarify this issue, Honore et al56 defined continuous HVHF as 50 to 70 mL/kg/h, and 100 to 120 mL/kg/h for 4 to 8 hours followed by conventional CVVH as pulse HVHF. In addition, HVHF is regarded as effective blood purification therapy because circulating inflammatory mediators are mostly water-soluble and range between 5 kDa and 60 kDa. They are more effectively removed by convective means than by diffusion techniques. Moreover, haemofilter membranes have some adsorptive properties that allow the removal of mediators with a molecular weight higher than the membrane cut-off point. It is clear that conventional haemofiltration with low ultrafiltration rates is ineffective for cytokine removal.2 3 Increasing the ultrafiltration flow rate can increase the adsorption capacity of the haemofilter because of its effect on transmembrane pressure (greater membrane site recruitment) and the exposure of more available adsorptive surface area.57 Only two RCTs that investigated the potential benefit of HVHF over conventional CVVH in septic patients were available before the publication of the landmark trial (high-volume versus standard-volume haemofiltration for septic shock patients with acute kidney injury study) in 2013.57 58 Cole et al57 performed the first randomised crossover clinical trial that involved 11 patients with septic shock and multi-organ failure. Patients were assigned to either 8 hours of HVHF (6 L/h) or 8 hours of standard CVVH (1 L/h) in a random order. The results showed that HVHF was associated with a greater reduction in vasopressor use. A study by Boussekey et al58 (HVHF 65 mL/kg/h vs control 35 mL/kg/h; n=20) yielded similar findings and showed no survival benefit of HVHF over conventional CVVH. Multiple non-randomised studies showed decreased mortality with HVHF for septic shock patients but most of the studies were relatively small.59 60 61 Despite the initially encouraging results, HVHF has not gained in popularity because the use of a large volume of ultrapure replacement solution equates to significant increases in treatment cost, risk of severe electrolyte disturbance, and nursing workload. The landmark IVORIE study was published in 2013.62 This multicentre RCT involved 140 critically ill septic shock patients who were randomised to receive either HVHF at 70 mL/kg/h or standard CVVH treatment at 35 mL/kg/h. It showed neither significant survival benefit nor haemodynamic improvement for HVHF compared with standard treatment. Subsequently two meta-analyses (4 studies with approximately 500 patients) published in 2014 concluded that neither HVHF nor pulse HVHF offered any added clinical benefit when compared with standard-volume haemofiltration.63 64 Therefore, the routine use of HVHF for treatment of sepsis is not recommended.
 
High cut-off haemodialysis/haemofiltration
Inflammatory mediators are relatively large (TNF-α: 17 kDa, IL-6: 26 kDa, and IL-8: 8 kDa), and are classified as middle molecules. The conventional high-flux haemofilter has a cut-off point at approximately 20 kDa and is unlikely to achieve good cytokine clearance.2 3 The nominal cut-off point for HCO membranes ranges from 60 to 150 kDa and the clinical cut-off point in blood ranges from 40 to 100 kDa.65 This can greatly increase the sieving coefficients of various inflammatory mediators at the expense of loss of albumin (66 kDa), antithrombin-III (60 kDa), protein C (62 kDa), and many other vital proteins. Reducing the pore size slightly can limit vital protein loss but also decrease cytokine removal. Ex-vivo studies showed that HCO haemofiltration displayed the greatest consistency in cytokine removal when compared with standard haemofiltration.66 The CPFA and haemoadsorption appeared to offer a similar level of cytokine clearance to the HCO technique. Albumin loss was comparable between HCO haemofiltration, HCO haemodialysis, and HCO haemodiafiltration.66 Morgera et al67 published the first study on the use of HCO haemofiltration among septic shock patients and showed good IL-6 (but not TNF-α) clearance. Subsequently, Morgera et al68 conducted an RCT that involved 30 septic AKI patients who were randomised to HCO or conventional haemofiltration. The HCO group showed a significant decline in vasopressor use and cytokine level.68 The largest RCT was the High Cut-Off Continuous Veno-venous Hemodialysis (CVVHD) in Patients Treated for Acute Renal Failure After Systemic Inflammatory Response Syndrome (SIRS)/Septic Shock (HICOSS) study.69 The estimated sample size was 120 patients but the study was terminated early because of a lack of difference between the groups after 81 patients had been recruited. There was no difference in 28-day mortality, vasopressor use, duration of mechanical ventilation, length of stay in intensive care unit, or albumin level between the groups.69 This underpowered RCT (due to premature termination) cannot provide a clear answer about the potential benefit of HCO haemofiltration/haemodialysis in septic patients and a further large-scale prospective RCT is recommended. Only the septeX (Gambro Hospal, Stockholm, Sweden) and EMiC 2 (Fresenius SE, Bad Homburg, Germany) HCO haemofilters are available in Hong Kong (Table 2). Treatment usually lasts for 24 to 72 hours and costs approximately HK$8000 per HCO haemofilter.
 
Plasmapheresis and coupled plasma filtration adsorption
The nominal cut-off point for the plasma filter ranges from 400 to 800 kDa and therefore can achieve good cytokine removal with significant albumin loss (Table 2). Only three RCTs have been published to date. Busund et al70 published the largest RCT involving 106 adult septic patients randomised to receive either two sessions of plasmapheresis or standard therapy. Plasmapheresis offered better 28-day survival compared with the control group (67% vs 47%). Studies by Reeves et al71 and Long et al72 showed no survival benefit, however. Therefore, the debate regarding the benefit of plasmapheresis in sepsis continues. One important drawback of plasmapheresis is the significant loss of albumin, fibrinogen, antithrombin, and immunoglobulin that takes a long time to regenerate in the absence of post-treatment replacement.73 This problem can be resolved with the use of CPFA (Lynda, Bellco, Mirandola, Italy). This CPFA therapy comprises a plasma filter, a non-selective hydrophobic resin cartridge with high affinity for inflammatory mediators, and a high-flux haemofilter for convective solute removal (Fig).74 Only filtrated plasma has direct contact with the sorbents that have no biocompatibility problems when compared with direct haemoperfusion. Treatment lasts for approximately 10 hours and requires cartridge changes due to saturation problems. Livigni et al75 published the only multicentre RCT focused on patients with septic shock. Patients were randomised to standard treatment with or without CPFA. The CPFA therapy was performed daily for 5 days and lasted at least 10 hours/day. The estimated sample size was 330 patients but the study was terminated early on the grounds of futility after 192 patients had been recruited. No significant benefits for mortality, organ dysfunction, or intensive care unit stay were observed. Therefore, based on the available evidence, the routine use of CPFA for treatment of septic shock is not recommended. The CPFA is currently not available in Hong Kong.
 

Figure. Schematic of coupled plasma filtration adsorption
 
Conclusion
Building on the concept of excessive inflammatory mediator release, blood purification techniques have emerged as an adjunctive therapy for patients with severe sepsis and septic AKI. They are effective in clearing endotoxin or inflammatory mediators and are well tolerated. Despite initially promising results, most blood purification techniques have not provided any sustainable mortality benefits. In severe sepsis, source control, early appropriate antibiotics, and haemodynamic support are the three most important treatment components.76 As a supportive treatment, blood purification techniques may not significantly affect patient mortality. Since the outcome for septic patients has improved over time, much larger sample sizes will be needed to detect the relatively small effects of these new therapies on sepsis.77 Large-scale, well-designed, prospective RCTs are the way forward. The application of these novel techniques should be individualised but more specific recommendations must await further evidence.
 
Declaration of interests
All authors have disclosed no conflicts of interest.
 
References
1. Shum HP, Yan WW, Chan TM. Recent knowledge on the pathophysiology of septic acute kidney injury: A narrative review. J Crit Care 2016;31:82-9. Crossref
2. Cole L, Bellomo R, Hart G, et al. A phase II randomized, controlled trial of continuous hemofiltration in sepsis. Crit Care Med 2002;30:100-6. Crossref
3. Payen D, Mateo J, Cavaillon JM, et al. Impact of continuous venovenous hemofiltration on organ failure during the early phase of severe sepsis: a randomized controlled trial. Crit Care Med 2009;37:803-10. Crossref
4. Prince LR, Whyte MK, Sabroe I, Parker LC. The role of TLRs in neutrophil activation. Curr Opin Pharmacol 2011;11:397-403. Crossref
5. Nakayama H, Kurokawa K, Lee BL. Lipoproteins in bacteria: structures and biosynthetic pathways. FEBS J 2012;279:4247-68. Crossref
6. Zarbock A, Gomez H, Kellum JA. Sepsis-induced acute kidney injury revisited: pathophysiology, prevention and future therapies. Curr Opin Crit Care 2014;20:588-95. Crossref
7. Angus DC, van der Poll T. Severe sepsis and septic shock. N Engl J Med 2013;369:2063. Crossref
8. Gomez H, Ince C, De Backer D, et al. A unified theory of sepsis-induced acute kidney injury: inflammation, microcirculatory dysfunction, bioenergetics, and the tubular cell adaptation to injury. Shock 2014;41:3-11. Crossref
9. Suntharalingam G, Perry MR, Ward S, et al. Cytokine storm in a phase 1 trial of the anti-CD28 monoclonal antibody TGN1412. N Engl J Med 2006;355:1018-28. Crossref
10. Limaye AP, Kirby KA, Rubenfeld GD, et al. Cytomegalovirus reactivation in critically ill immunocompetent patients. JAMA 2008;300:413-22. Crossref
11. Boomer JS, To K, Chang KC, et al. Immunosuppression in patients who die of sepsis and multiple organ failure. JAMA 2011;306:2594-605. Crossref
12. Wang C, Sun J, Zheng J, et al. Low-dose hydrocortisone therapy attenuates septic shock in adult patients but does not reduce 28-day mortality: a meta-analysis of randomized controlled trials. Anesth Analg 2014;118:346-57. Crossref
13. Kalil AC, Sun J. Low-dose steroids for septic shock and severe sepsis: the use of Bayesian statistics to resolve clinical trial controversies. Intensive Care Med 2011;37:420-9. Crossref
14. Alejandria MM, Lansang MA, Dans LF, Mantaring JB 3rd. Intravenous immunoglobulin for treating sepsis, severe sepsis and septic shock. Cochrane Database Syst Rev 2013;(9):CD001090.
15. Bernard GR, Francois B, Mira JP, et al. Evaluating the efficacy and safety of two doses of the polyclonal anti-tumor necrosis factor-alpha fragment antibody AZD9773 in adult patients with severe sepsis and/or septic shock: randomized, double-blind, placebo-controlled phase IIb study. Crit Care Med 2014;42:504-11. Crossref
16. Ronco C, Tetta C, Mariano F, et al. Interpreting the mechanisms of continuous renal replacement therapy in sepsis: the peak concentration hypothesis. Artif Organs 2003;27:792-801. Crossref
17. Honoré PM, Matson JR. Extracorporeal removal for sepsis: Acting at the tissue level—the beginning of a new era for this treatment modality in septic shock. Crit Care Med 2004;32:896-7. Crossref
18. Di Carlo JV, Alexander SR. Hemofiltration for cytokine-driven illnesses: the mediator delivery hypothesis. Int J Artif Organs 2005;28:777-86.
19. Peng Z, Singbartl K, Simon P, et al. Blood purification in sepsis: a new paradigm. Contrib Nephrol 2010;165:322-8. Crossref
20. Rimmelé T, Kellum JA. Clinical review: blood purification for sepsis. Crit Care 2011;15:205. Crossref
21. Cruz DN, Antonelli M, Fumagalli R, et al. Early use of polymyxin B hemoperfusion in abdominal septic shock: the EUPHAS randomized controlled trial. JAMA 2009;301:2445-52. Crossref
22. Shoji H. Extracorporeal endotoxin removal for the treatment of sepsis: endotoxin adsorption cartridge (Toraymyxin). Ther Apher Dial 2003;7:108-14. Crossref
23. Mitaka C, Tomita M. Polymyxin B–immobilized fiber column hemoperfusion therapy for septic shock. Shock 2011;36:332-8. Crossref
24. Cruz DN, Perazella MA, Bellomo R, et al. Effectiveness of polymyxin B–immobilized fiber column in sepsis: a systematic review. Crit Care 2007;11:R47. Crossref
25. Zhou F, Peng Z, Murugan R, Kellum JA. Blood purification and mortality in sepsis: a meta-analysis of randomized trials. Crit Care Med 2013;41:2209-20. Crossref
26. Payen DM, Guilhot J, Launey Y, et al. Early use of polymyxin B hemoperfusion in patients with septic shock due to peritonitis: a multicenter randomized control trial. Intensive Care Med 2015;41:975-84. Crossref
27. Iwagami M, Yasunaga H, Doi K, et al. Postoperative polymyxin B hemoperfusion and mortality in patients with abdominal septic shock: a propensity-matched analysis. Crit Care Med 2014;42:1187-93. Crossref
28. Klein DJ, Foster D, Schorr CA, Kazempour K, Walker PM, Dellinger RP. The EUPHRATES trial (Evaluating the Use of Polymyxin B Hemoperfusion in a Randomized controlled trial of Adults Treated for Endotoxemia and Septic shock): study protocol for a randomized controlled trial. Trials 2014;15:218. Crossref
29. Ullrich H, Jakob W, Frohlich D, et al. A new endotoxin adsorber: first clinical application. Ther Apher 2001;5:326-34. Crossref
30. Staubach KH, Boehme M, Zimmermann M, Otto V. A new endotoxin adsorption device in Gram-negative sepsis: use of immobilized albumin with the MATISSE adsorber. Transfus Apher Sci 2003;29:93-8. Crossref
31. Reinhart K, Meier-Hellmann A, Beale R, et al. Open randomized phase II trial of an extracorporeal endotoxin adsorber in suspected Gram-negative sepsis. Crit Care Med 2004;32:1662-8. Crossref
32. Kulabukhov VV. Use of an endotoxin adsorber in the treatment of severe abdominal sepsis. Acta Anaesthesiol Scand 2008;52:1024-5. Crossref
33. Yaroustovsky M, Abramyan M, Popok Z, et al. Preliminary report regarding the use of selective sorbents in complex cardiac surgery patients with extensive sepsis and prolonged intensive care stay. Blood Purif 2009;28:227-33. Crossref
34. Ala-Kokko TI, Laurila J, Koskenkari J. A new endotoxin adsorber in septic shock: observational case series. Blood Purif 2011;32:303-9. Crossref
35. Shum HP, Leung YW, Lam SM, Chan KC, Yan WW. Alteco endotoxin hemoadsorption in Gram-negative septic shock patients. Indian J Crit Care Med 2014;18:783-8. Crossref
36. Harm S, Falkenhagen D, Hartmann J. Endotoxin adsorbents in extracorporeal blood purification: do they fulfill expectations? Int J Artif Organs 2014;37:222-32. Crossref
37. Taniguchi T. Cytokine adsorbing columns. Contrib Nephrol 2010;166:134-41. Crossref
38. Kellum JA, Venkataraman R, Powner D, Elder M, Hergenroeder G, Carter M. Feasibility study of cytokine removal by hemoadsorption in brain-dead humans. Crit Care Med 2008;36:268-72. Crossref
39. Kobe Y, Oda S, Matsuda K, Nakamura M, Hirasawa H. Direct hemoperfusion with a cytokine-adsorbing device for the treatment of persistent or severe hypercytokinemia: a pilot study. Blood Purif 2007;25:446-53. Crossref
40. Tsuchida K, Takemoto Y, Sugimura K, Yoshimura R, Nakatani T. Direct hemoperfusion by using Lixelle column for the treatment of systemic inflammatory response syndrome. Int J Mol Med 2002;10:485-8. Crossref
41. Morris C, Gray L, Giovannelli M. Early report: The use of CytoSorb haemabsorption column as an adjunct in managing severe sepsis: initial experiences, review and recommendations. J Intensive Care Soc 2015;16:257-64. Crossref
42. Hinz B, Jauch O, Noky T, Friesecke S, Abel P, Kaiser R. CytoSorb, a novel therapeutic approach for patients with septic shock: a case report. Int J Artif Organs 2015;38:461-4. Crossref
43. Wiegele M, Krenn CG. CytoSorb in a patient with Legionella pneumonia–associated rhabdomyolysis: a case report. ASAIO J 2015;61:e14-6. Crossref
44. Hetz H, Berger R, Recknagel P, Steltzer H. Septic shock secondary to beta-hemolytic streptococcus-induced necrotizing fasciitis treated with a novel cytokine adsorption therapy. Int J Artif Organs 2014;37:422-6. Crossref
45. Bouman CS, van Olden RW, Stoutenbeek CP. Cytokine filtration and adsorption during pre- and postdilution hemofiltration in four different membranes. Blood Purif 1998;16:261-8. Crossref
46. De Vriese AS, Colardyn FA, Philippé JJ, Vanholder RC, De Sutter JH, Lameire NH. Cytokine removal during continuous hemofiltration in septic patients. J Am Soc Nephrol 1999;10:846-53.
47. Hirasawa H, Oda S, Matsuda K. Continuous hemodiafiltration with cytokine-adsorbing hemofilter in the treatment of severe sepsis and septic shock. Contrib Nephrol 2007;156:365-70. Crossref
48. Mitzner S, Schneidewind J, Falkenhagen D, Loth F, Klinkmann H. Extracorporeal endotoxin removal by immobilized polyethylenimine. Artif Organs 1993;17:775-81. Crossref
49. Shum HP, Chan KC, Kwan MC, Yan WW. Application of endotoxin and cytokine adsorption haemofilter in septic acute kidney injury due to Gram-negative bacterial infection. Hong Kong Med J 2013;19:491-7. Crossref
50. Turani F, Candidi F, Barchetta R, et al. Continuous renal replacement therapy with the adsorbent membrane oXiris in septic patients: a clinical experience. Crit Care 2013;17 Suppl 2:63. Crossref
51. Matsuda K, Hirasawa H, Oda S, Shiga H, Nakanishi K. Current topics on cytokine removal technologies. Ther Apher 2001;5:306-14. Crossref
52. Nakada TA, Hirasawa H, Oda S, Shiga H, Matsuda K. Blood purification for hypercytokinemia. Transfus Apher Sci 2006;35:253-64. Crossref
53. Nakada TA, Oda S, Matsuda K, et al. Continuous hemodiafiltration with PMMA hemofilter in the treatment of patients with septic shock. Mol Med 2008;14:257-63. Crossref
54. Matsuda K, Moriguchi T, Harii N, Yanagisawa M, Harada D, Sugawara H. Comparison of efficacy between continuous hemodiafiltration with a PMMA high-performance membrane dialyzer and a PAN membrane hemofilter in the treatment of septic shock patients with acute renal failure. Contrib Nephrol 2011;173:182-90. Crossref
55. Kellum JA, Mehta RL, Angus DC, Palevsky P, Ronco C, ADQI Workgroup. The first international consensus conference on continuous renal replacement therapy. Kidney Int 2002;62:1855-63. Crossref
56. Honore PM, Joannes-Boyau O, Boer W, Collin V. High-volume hemofiltration in sepsis and SIRS: current concepts and future prospects. Blood Purif 2009;28:1-11. Crossref
57. Cole L, Bellomo R, Journois D, Davenport P, Baldwin I, Tipping P. High-volume haemofiltration in human septic shock. Intensive Care Med 2001;27:978-86. Crossref
58. Boussekey N, Chiche A, Faure K, et al. A pilot randomized study comparing high and low volume hemofiltration on vasopressor use in septic shock. Intensive Care Med 2008;34:1646-53. Crossref
59. Cornejo R, Downey P, Castro R, et al. High-volume hemofiltration as salvage therapy in severe hyperdynamic septic shock. Intensive Care Med 2006;32:713-22. Crossref
60. Joannes-Boyau O, Rapaport S, Bazin R, Fleureau C, Janvier G. Impact of high volume hemofiltration on hemodynamic disturbance and outcome during septic shock. ASAIO J 2004;50:102-9. Crossref
61. Piccinni P, Dan M, Barbacini S, et al. Early isovolaemic haemofiltration in oliguric patients with septic shock. Intensive Care Med 2006;32:80-6. Crossref
62. Joannes-Boyau O, Honoré PM, Perez P, et al. High-volume versus standard-volume haemofiltration for septic shock patients with acute kidney injury (IVOIRE study): a multicentre randomized controlled trial. Intensive Care Med 2013;39:1535-46. Crossref
63. Lehner GF, Wiedermann CJ, Joannidis M. High-volume hemofiltration in critically ill patients: a systematic review and meta-analysis. Minerva Anestesiol 2014;80:595-609.
64. Clark E, Molnar AO, Joannes-Boyau O, Honoré PM, Sikora L, Bagshaw SM. High-volume hemofiltration for septic acute kidney injury: a systematic review and meta-analysis. Crit Care 2014;18:R7. Crossref
65. Haase M, Bellomo R, Morgera S, Baldwin I, Boyce N. High cut-off point membranes in septic acute renal failure: a systematic review. Int J Artif Organs 2007;30:1031-41.
66. Atan R, Crosbie D, Bellomo R. Techniques of extracorporeal cytokine removal: a systematic review of the literature. Blood Purif 2012;33:88-100. Crossref
67. Morgera S, Rocktäschel J, Haase M, et al. Intermittent high permeability hemofiltration in septic patients with acute renal failure. Intensive Care Med 2003;29:1989-95. Crossref
68. Morgera S, Haase M, Kuss T, et al. Pilot study on the effects of high cutoff hemofiltration on the need for norepinephrine in septic patients with acute renal failure. Crit Care Med 2006;34:2099-104. Crossref
69. Honore P, Beck W, editors. High cut-off continuous venovenous hemodialysis (CVVHD) in patients treated for acute renal failure after systemic inflammatory response syndrome (SIRS)/septic shock (HICOSS). Proceedings of the 10th Congress of the World Federation of Societies of Intensive and Critical Care Medicine (WFSICCM); 2009 Aug 28-Sep 1; Florence, Italy.
70. Busund R, Koukline V, Utrobin U, Nedashkovsky E. Plasmapheresis in severe sepsis and septic shock: a prospective, randomised, controlled trial. Intensive Care Med 2002;28:1434-9. Crossref
71. Reeves JH, Butt WW, Shann F, et al. Continuous plasmafiltration in sepsis syndrome. Plasmafiltration in Sepsis Study Group. Crit Care Med 1999;27:2096-104. Crossref
72. Long EJ, Shann F, Pearson G, Buckley D, Butt W. A randomised controlled trial of plasma filtration in severe paediatric sepsis. Crit Care Resusc 2013;15:198-204.
73. Stegmayr B, Abdel-Rahman EM, Balogun RA. Septic shock with multiorgan failure: from conventional apheresis to adsorption therapies. Semin Dial 2012;25:171-5. Crossref
74. Formica M, Inguaggiato P, Bainotti S, Wratten ML. Coupled plasma filtration adsorption. Contrib Nephrol 2007;156:405-10. Crossref
75. Livigni S, Bertolini G, Rossi C, et al. Efficacy of coupled plasma filtration adsorption (CPFA) in patients with septic shock: a multicenter randomised controlled clinical trial. BMJ Open 2014;4:e003536. Crossref
76. Dellinger RP, Levy MM, Rhodes A, et al. Surviving sepsis campaign: international guidelines for management of severe sepsis and septic shock: 2012. Crit Care Med 2013;41:580-637. Crossref
77. Kaukonen KM, Bailey M, Suzuki S, Pilcher D, Bellomo R. Mortality related to severe sepsis and septic shock among critically ill patients in Australia and New Zealand, 2000-2012. JAMA 2014;311:1308-16. Crossref

Clinical applications of high-intensity focused ultrasound

Hong Kong Med J 2016 Aug;22(4):382–92 | Epub 6 Jul 2016
DOI: 10.12809/hkmj154755
© Hong Kong Academy of Medicine. CC BY-NC-ND 4.0
 
REVIEW ARTICLE  CME
Clinical applications of high-intensity focused ultrasound
WH She, MB, BS, FRCS1; TT Cheung, MS, FRCS1; Caroline R Jenkins, MB, BS, FRCA2; Michael G Irwin, MD, FRCA2
1 Department of Surgery, The University of Hong Kong, Queen Mary Hospital, Pokfulam, Hong Kong
2 Department of Anaesthesiology, The University of Hong Kong, Queen Mary Hospital, Pokfulam, Hong Kong
 
Corresponding author: Dr TT Cheung (tantocheung@hotmail.com)
 
A video clip showing clinical applications of high-intensity focused ultrasound is available at www.hkmj.org
 
 Full paper in PDF
Abstract
Ultrasound has been developed for therapeutic use in addition to its diagnostic ability. The use of focused ultrasound energy can offer a non-invasive method for tissue ablation, and can therefore be used to treat various solid tumours. High-intensity focused ultrasound is being increasingly used in the treatment of both primary and metastatic tumours as these can be precisely located for ablation. It has been shown to be particularly useful in the treatment of uterine fibroids, and various solid tumours including those of the pancreas and liver. High-intensity focused ultrasound is a valid treatment option for liver tumours in patients with significant medical co-morbidity who are at high risk for surgery or who have relatively poor liver function that may preclude hepatectomy. It has also been used as a form of bridging therapy while patients awaiting cadaveric donor liver transplantation. In this article, we outline the principles of high-intensity focused ultrasound and its clinical applications, including the management protocol development in the treatment of hepatocellular carcinoma in Hong Kong by performing a search on MEDLINE (OVID), EMBASE, and PubMed. The search of these databases ranged from the date of their establishment until December 2015. The search terms used were: high-intensity focused ultrasound, ultrasound, magnetic resonance imaging, liver tumour, hepatocellular carcinoma, pancreas, renal cell carcinoma, prostate cancer, breast cancer, fibroids, bone tumour, atrial fibrillation, glaucoma, Parkinson’s disease, essential tremor, and neuropathic pain.
 
 
Introduction
High-intensity focused ultrasound (HIFU) was initially used in the 1940s to treat brain pathologies such as Parkinson’s disease.1 2 3 In the 1990s, it was introduced to ophthalmology to treat raised intra-ocular pressure, traumatic capsular tears, glaucoma, retinal detachment, and vitreous haemorrhage.4 5 6 7 8 9 This technique has a unique ability to target deep-seated soft tissue tumours. Furthermore, as long as the lesions within solid organs can be clearly visualised on magnetic resonance imaging (MRI) or ultrasonography (USG)—that is, the presence of the acoustic window to allow the transmission of ultrasound energy—many lesions can be targeted such as those in the liver, kidney, pancreas and breast; and uterine fibroids, benign prostatic hypertrophy, and prostate cancer. In recent years, HIFU has been used to treat both benign and malignant lesions of various solid organs. This non-invasive modality allows treatment of tumours without surgery and offers a new treatment option for those patients who are not candidates for surgery, or who do not want surgery.
 
Methods
A search was performed on the following electronic databases: MEDLINE (OVID), EMBASE, and PubMed. The search of these databases ranged from the date of their establishment until December 2015. The search terms used were: high-intensity focused ultrasound, ultrasound, magnetic resonance imaging, liver tumour, hepatocellular carcinoma, pancreas, renal cell carcinoma, prostate cancer, breast cancer, fibroids, bone tumour, atrial fibrillation, glaucoma, Parkinson’s disease, essential tremor, and neuropathic pain. Only studies reported in English were included. Full papers were selected if they contained facts, data, or scientific evidence related to the treatment of HIFU. The reference lists of articles selected were screened for full-text review.
 
Mechanism of high-intensity focused ultrasound
High-intensity focused ultrasound incorporates multiple ultrasound beams produced by piezoelectric or piezoceramic transducers directed into a three-dimensional focal point of typically 1 to 5 mm in diameter and 10 to 50 mm in length.10 Various mechanisms have been proposed for the subsequent tissue destruction with a synergistic effect from thermal and mechanical means. This technique induces heat generation due to absorption of the acoustic energy with the temperature rising rapidly to 60°C or higher, causing coagulation necrosis in a short period of time. Focusing is an important component as only a small volume (eg 1 mm diameter and 9 mm length) is targeted by the ultrasound beam and hence HIFU induces minimal thermal damage to tissue located between the transducer and the focal point.11
 
A mechanical effect is produced by acoustic pulses only at higher intensities. Various phenomena are observed, including cavitation, microstreaming, and radiation forces. Cavitation is defined as the creation or motion of a gas cavity in an acoustic field due to alternating compression and expansion of tissue as an ultrasound burst propagates through it.12 There are two forms of cavitation to consider: stable and inertial.11 If the tissue expansion or rarefaction pressure is of sufficient magnitude, gas can be extracted from the tissue, resulting in bubble formation. In stable cavitation, the bubble is exposed to a low-pressure acoustic field, resulting in stable oscillation of the size of the bubble. In inertial cavitation, exposure of the bubble to the acoustic filed results in violent oscillations of the bubble and rapid growth during the rarefaction phase, eventually leading to the violent collapse and destruction of the bubble. It will produce shock waves of very high pressure (20-30 000 bars) and a high temperature (2000-5000 K) in the microenvironment.13 14 Micro-streaming is a phenomenon produced by stable cavitation in which rapid movement of fluid occurs near the bubble due to its oscillating motion. It can produce high shear forces that can cause transient damage to cell membranes and may play a role in ultrasound-enhanced drug or gene delivery when damage to the cell membrane is transient.13 15
 
Radiation forces are developed when a wave is either absorbed or reflected. If the reflecting or absorbing medium is tissue or other solid material, the force presses against the medium, producing a pressure termed ‘radiation pressure’. If the medium is liquid and can move under pressure, then streaming results.16
 
The intention of HIFU is to raise and maintain an isolated part of the volume above 60°C for more than 1 second or longer, in order to cause coagulative necrosis and immediate cell death.17 18 It aims to deliver the energy required to raise the tissue temperature to a cytotoxic level sufficiently fast that the tissue vasculature does not have a significant effect on the extent of cell killing.19 20 In a study of the application of HIFU in the liver, 2 hours of exposure resulted in a rim of glycogen-free cells of about 10 cells wide. These cells were dead 48 hours later, and showed signs of coagulative necrosis typical of thermal injury.19
 
Limitations of high-intensity focused ultrasound
Of all the ablative modalities, HIFU has the advantage that it does not require the introduction of an applicator in order to achieve the ablative effect and is the only non-invasive option. This makes it a very attractive choice. It has several limitations, however. This technique is essentially USG and, therefore, any artefacts, such as acoustic shadowing, reverberation, and refraction also apply to it. Superficial lesions are treated most effectively by HIFU due to the limitations of ultrasound penetrance through many tissues, but the sound wave reflected carries very high energy, and can also produce burns in tissues that lie between the target and the transducer. Many collateral injuries have been reported due to scattered and reflected high-intensity ultrasound waves, such as skin burns, peripheral nerve damage, and bowel injury.21 22 Great care also needs to be taken in areas that are subject to respiratory movement, because of a lack of precision, or the presence of sonic shadowing due to overlying bony substances.21 In such situations it may be necessary for the anaesthetist to use controlled ventilation. The amount of energy absorbed by the tissue may vary, as fibrotic, fatty, and highly vascularised tissues attenuate sound energy differently. Excessive energy absorption may result in an unpredictable distribution of cell death.23 Careful planning is therefore required to ensure adequate tumour coverage, as coagulation, desiccation, and vapour formation are detrimental to ultrasound energy propagation, as well as precise localisation of the lesion.24
 
The high-intensity focused ultrasound system
Both USG and MRI can be used to visualise, target, and monitor the status of tissue destruction.
 
Ultrasonography
This is the most common method to target and monitor the status of HIFU destruction.25 The therapeutic and diagnostic transducers can be packaged into one instrument that allows real-time monitoring of the delivery of HIFU, the outcome of the lesion, and the outcome of the peripheral tissues. Although it is cost-effective, it has relatively low spatial resolution that limits its accuracy for targeting and it is also hard to visualise the details of the structures in close proximity to the bowel because of the gas-containing portions (air conducts sound very poorly). In our unit, we use an USG-guided HIFU system.26
 
Magnetic resonance imaging
This offers excellent resolution and tumour detail. It locates the tumour boundary very clearly and is particularly useful in patients in whom tumours cannot be visualised with USG, for example, in obese patients.27 Magnetic resonance imaging possesses real-time thermal resolution with high spatial resolution, and provides temperature data within seconds of HIFU exposure. This allows detection of small temperature elevations before any irreversible tissue damage occurs.28 Nonetheless, MRI guidance is expensive, labour intensive, noisy, and bulky. Equipment such as that used for monitoring and anaesthesia needs to be non-ferrous and MRI-safe and treatment time is prolonged.
 
High-intensity focused ultrasound device
There are several devices available for the treatment of various diseases, including extracorporeal, transrectal, and interstitial devices.
 
Extracorporeal devices
Organs lying externally or those that are readily accessible—such as breasts, cutaneous tissue, limbs, abdomen, and brain—are usually treated with extracorporeal HIFU that is guided by either USG or MRI. As long as there is a suitable acoustic window on the skin that allows uninterrupted propagation of the HIFU energy beam to the target organs, one can consider the use of extracorporeal HIFU for treatment.
 
Ultrasonography-guided transcutaneous high-intensity focused ultrasound
We are currently using a HIFU machine produced by Haifu Technology Company (Chongqing, China) [Figs 1, 2, 3]. It has been used and shown to be effective in treatment of a variety of benign and malignant solid organ tumours, such as liver and pancreatic cancer, uterine fibroids, soft tissue tumours, breast cancer, and bladder cancer.29 30 31 This system consists of three selectable therapeutic transducers and a real-time imaging transducer. The transducers are mounted in a water reservoir with the beam axis directed upward, and the patient is positioned above the transducers in a prone or decubitus position. The HIFU exposure level is adjusted until a hyperechoic region is seen on the USG image.
 

Figure 1. The usual setup of the high-intensity focused ultrasound (HIFU) system
(a) Control system; (b) HIFU machine and patient lying on the treatment table; and (c) anaesthetic machine
 

Figure 2. Computer controls the degassed water in and out of the tank
 

Figure 3. The lesion (arrow) is identified and fired by high-intensity focused ultrasound
 
Magnetic resonance imaging–guided high-intensity focused ultrasound
Two major clinical MRI-HIFU systems are available worldwide: InSightec (Tirat Carmel, Israel) and Philips Healthcare (Vantaa, Finland).32 33 Their HIFU transducers are similar in terms of enabling both mechanical and electronic adjustment of HIFU focus and MR thermometric temperature monitoring, but their sonication strategies are different and hence they differ in energy efficiency.34 These machines are not available in Hong Kong.
 
Transrectal devices
Transrectal devices were developed for the treatment of benign and malignant prostatic diseases. They aim to ablate the entire prostate. Both USG-guided probes and MRI-guided systems have been developed. The USG probes are inserted per rectum and incorporate both imaging and therapeutic transducers in one unit,35 36 37 38 39 40 41 such as Ablatherm (Edap Technomed, France) and the Sonablate (Focus Surgery Inc, US), whereas a prostate-dedicated MRI-HIFU system makes use of either the transrectal (ExAblate OR; InSightec) or transurethral (Philips Healthcare) approach.42 43
 
Interstitial devices
Ultrasonographic transducers with different shapes and sizes were developed in order to place the focused applicators as close as possible to the target area. Several shapes are available, including cylindrical, semi-cylindrical, cylindrical with focusing by wave reflection, plane and cylindrical array. Various applicators have been developed to facilitate access and guidance of the device, such as the flexible applicator in an endoscopically placed HIFU device for the treatment of cholangiocarcinoma44 or oesophageal tumours45; or rigid applicators for a linear approach. Probes for percutaneous and laparoscopic treatment are also being developed and it is likely that the therapeutic indications will increase.
 
Current clinical applications
High-intensity focused ultrasound has been used to treat various benign and malignant solid tumours. It is also used in conditions such as ablation for atrial fibrillation,46 glaucoma,47 and benign obstetric and gynaecological procedures such as fibroids.32
 
Liver tumours
In general, liver resection is still the mainstay of treatment of hepatocellular carcinoma (HCC), provided the patient is surgically fit, has fair liver function with good liver remnant and resectable tumour. Liver transplantation is planned for patients whose tumour is within the transplant criteria, and a living or deceased donor is available.
 
Ablative therapy, such as radiofrequency ablation (RFA), is considered for patients with a relatively small tumour, preserved liver function, and favourable location, that is, away from pleural or gastrointestinal tract. For those patients whose tumours are relatively small, located at the dome of the liver, with clinical evidence of ascites or pleural effusion, HIFU would be an alternative as long as the lesion can be visualised and located by USG. For those patients with multifocal tumours that are not amenable to surgical resection or ablation, and who have reasonable liver function without evidence of ascites, transarterial chemoembolisation is the treatment of choice. Sorafenib is an effective target therapy for patients undergoing palliative care, but has significant side-effects.
 
High-intensity focused ultrasound is now one of the treatment modalities in our centre for HCC and has been used as bridging therapy for patients who are awaiting cadaveric donor liver transplantation. This technique can be utilised for patients who are not suitable for percutaneous RFA but have a satisfactory general condition as assessed by an anaesthesiologist. They should have intact skin over the ablative region.
 
High-intensity focused ultrasound treatment procedure
Before treatment, the patient undergoes USG screening to ensure that the targeted lesions are visible on the USG localisation system. An anaesthesiologist will assess the patient’s co-morbidities and suitability for general anaesthesia as many patients may be unfit for open surgery. Standard fasting and drug administration guidelines apply. Before treatment starts, the patient’s skin is cleansed with degassed water and a negative-pressure aspirator is used to degas the skin and reduce the dampening effect of ultrasonic waves.
 
We use the JC HIFU system (Chongqing Haifu Technology, Chongqing, China); HIFU ablation is performed under general anaesthesia by a team of surgeons and radiologists. Total intravenous anaesthesia is favoured in our centre because of its titratability, avoidance of nitrous oxide, and no need for scavenging waste anaesthetic gases that may be hazardous to the health of attendant staff.48 A dose of antibiotic (Augmentin 1.2 g; Beecham Pharmaceuticals, Brentford, UK) is given just before the procedure begins. Artificial pleural effusion of 500 mL of normal saline is introduced if the liver tumour is located at the dome, in order to facilitate better ultrasound access to this region and protect the lung. In addition, intermittent cessation of respiratory movement by the anaesthesiologist facilitates better localisation of the lesions during energy transfer. For right-sided lesions, the patient is placed in the right lateral position after tracheal intubation. For left-sided lesions, the patient is placed in the prone position. The JC HIFU system consists of a treatment unit that delivers focused ultrasound energy with a focal length of 12 cm deep. The body is immersed in a degassed water circulation unit that provides a medium for ultrasound transmission. Grey-scale changes at the ablation site are observed during the procedure, indicating the temperature change inside the targeted lesion. Oral antibiotics are given for 5 days after treatment.49
 
When ablating a large tumour, the ultrasound energy is focused on the deep margin of the lesion first so as to avoid prohibition of effective penetration of energy by the cavitation effect and the presence of coagulation necrosis. Meticulous planning of the focus point before the procedure, in which the ablation sequence is from the deepest layer to the most superficial layer, is required for maximal destruction of the targeted lesion. Intermittent cessations of the procedure allow recovery of the cavitation effect shown under USG monitoring, giving additional allowance for ablation of the residual lesion in the periphery.50
 
Treatment results
Although a minimally invasive approach can be employed in patients with HCC and liver cirrhosis, hepatectomy is contra-indicated in patients with decompensated cirrhosis.51 Our pilot studies suggested that HIFU is relatively safe and effective.52 53 Patients who have poor liver function can still be offered HIFU.54 Its effectiveness in treating small HCC of size <3 cm was proven to be comparable with percutaneous RFA.55 Furthermore, its application in recurrent HCC allows patients to undergo ablation, especially when the abdomen is hostile due to previous surgery, or there is inadequate liver remnant due to previous major hepatectomy.56 In the treatment of HCC in non-surgical candidates, 1- and 3-year overall survival rates of 87.7% and 62.4%, respectively were achieved in 49 patients with a median tumour size of 2.2 cm.49 In addition, our prospective study suggested that the response rate for those patients with HCC who underwent HIFU as the bridging treatment while awaiting cadaveric liver transplantation was higher than in those who underwent transarterial chemoembolisation.52 It is particularly useful in patients who also have poor liver function with clinical ascites, as ascites itself is a good acoustic media for HIFU.57
 
High-intensity focused ultrasound does carry certain risks in the treatment for HCC. Minor complications such as skin and subcutaneous tissue injury occur in most patients.54 At our centre, there has been a case of post-HIFU bile duct stricture requiring endoscopic retrograde cholangiography.
 
Pancreatic cancer
Inoperable locally advanced pancreatic cancer remains difficult to treat. Local ablative therapy with HIFU has been used in patients with unresectable pancreatic cancer and proven to be safe in both clinical trials and retrospective studies,31 58 59 60 with no damage to the exocrine or endocrine function.61 62 63 It has been used as a form of palliative treatment in some pilot studies with a median survival ranging from 10 to 12.6 months, either alone or combined with chemotherapy.62 63 64 65 Pain relief was also found to be effective.31 58 59 63 65 66 Unfortunately, treatment after HIFU usually lacked histomorphological examination. The survival benefit needs to be tested in further studies, and preferably confirmed by randomised controlled trials.
 
Urological applications
Prostate cancer
Transrectal HIFU is advocated as a form of minimally invasive treatment for localised prostate cancer. It is suggested primarily for patients with low- to intermediate-risk prostate cancer, according to D’Amico Risk stratification.67 68 69 70 71 72 It has also been used to treat locally recurrent prostate cancer. Patients with unifocal and multifocal prostate cancer were subjected to HIFU and had no evidence of disease on MRI at 12 months.73 Good functional outcome was achieved after the treatment, such as continence and good erectile function. Nonetheless, complications such as acute retention of urine or more severe rectal wall injury can occur. More sophisticated MRI-guided HIFU will allow more precise localisation of such lesions.74 To date, most studies have been in the form of retrospective studies or case series only with no randomised controlled trial of HIFU for the treatment of prostate cancer.
 
Renal tumours
International consensus panels recommend ablative techniques in patients who are unfit for surgery, who are not considered candidates for or elect against active surveillance, and who have a small renal mass.75 76 European Association of Urology guidelines recommend the use of an ablative method only in tumours of less than 4 cm.76 In fact, HIFU has been investigated in the treatment of both primary and metastatic renal tumours.77 78 79 Results suggest that there were discrete zones of ablation in 67% of patients in the final histology and HIFU achieved stable lesions in two thirds of patients with minimal morbidity; 90% of patients had good pain control immediately after HIFU.79 There were several limitations, however, such as the degree of subcutaneous and perinephric fat and the position of the tumour in relation to the ribs.80 Higher acoustic output is needed to compensate for the energy loss due to the thickness of the perinephric fat that might in turn increase the risk of prefocal and surrounding tissue damage.81 Currently, there is no controlled study to suggest the superiority of HIFU over various ablative techniques, such as RFA or cryoablation.
 
Brain diseases
High-intensity focused ultrasound was first used in the 1950s to treat Parkinson’s disease.82 83 84 It required access through the skull to the brain and, therefore, craniotomy was necessary. It subsequently became unpopular due to the concurrent development of the drug levodopa. With the advancement of MRI guidance, there has been a resurgence of interest as a non-invasive treatment for essential tremor, neuropathic pain, and Parkinson’s disease. It is safe, without major risk of infection or bleeding, but may result in transient oedema. In Parkinson’s disease, as the disease progresses, patients will eventually require levodopa that is associated with tolerance and, eventually, development of levodopa-resistant symptoms with movement fluctuations and dyskinesias. At this time surgical intervention may be considered. High-intensity focused ultrasound can allow ablation of the fibres that join the thalamus with the globus pallidus. Results of a pilot study suggested that there was improvement in terms of the functional score as rated by the Unified Parkinson’s Disease Rating Scale.85
 
Essential tremor is a common neurological condition usually managed conservatively, or with propranolol and primidone. For those treatment-resistant patients, surgical intervention may be considered. Usually RFA, stereotactic radiosurgery, gamma knife thalamotomy, or deep brain stimulation are used to either cause tissue destruction or to block abnormal nerve signals. High-intensity focused ultrasound has been used in a clinical trial context with promising results and marked reduction (>80%) of tremor.86 87
 
Neuropathic pain is a complex condition often associated with damage to or dysfunction of the nerve fibres that then send incorrect signals to the pain centres with minimal stimulation. High-intensity focused ultrasound can be directed to the part of the central lateral thalamic nucleus of those patients suffering from chronic therapy-resistant neuropathic pain. Significant pain relief has been observed with long-term follow-up in a pilot study.88
 
Breast tumour
High-intensity focused ultrasound is an ideal breast-conserving therapy because it does not significantly change the patients’ breast shape and does not cause bleeding or scarring. It does not require general anaesthesia, and hence has a reduced recovery time. Both USG- and MRI-guided HIFU ablations have been used. The aim is to achieve complete tumour necrosis but results have been inconsistent with some showing complete necrosis,89 and others residual tumour of less than 10% and residual tumour between 10% and 90%.90 91 92 93 94 A negative margin is the most important basis and factor for local control of the breast cancer.95 96 Nonetheless, it is difficult to ensure a negative margin after HIFU therapy with the aid of imaging alone, hence adjuvant radiotherapy has been suggested. Currently, there is limited prospective study or randomised trial in this area. Most work has been pilot studies or feasibility studies only.
 
Complications include pain, skin burns, oedema, pectoralis major muscle injury,97 and rib pain.98 These are relatively minor compared with those following traditional breast surgery with its attendant potential complications of wound pain, infection, bleeding, and impaired wound healing.
 
Fibroids
Uterine fibroid is a common benign gynaecological condition in women of childbearing age. Patients usually suffer symptoms such as heavy, painful, and prolonged menstrual bleeding, mass effect with urinary urgency, and constipation.99 Conservative medical therapy with non-steroidal anti-inflammatory drugs, contraceptive steroids, and gonadotropin-releasing hormone agonists are the first-line treatment. Ablative treatment as well as surgery will be necessary for those in whom conservative management fails or in those with progressive symptoms. Treatment is by means of myomectomy or hysterectomy. In cases where the patient does not want surgery, or where the patient is planning a future pregnancy, HIFU is a good option.100 101 Extracorporeal HIFU enables ablation of various sizes and shape of fibroid. Symptoms are reduced by more than 50% in terms of pain,102 103 104 bulk-related and menstrual symptoms, comparable with the results of conventional surgery.105 After HIFU, the ablated fibroid volume is decreased, and is related to the non-perfused volume of the tumour immediately after treatment.44 106 107 Nonetheless, HIFU cannot propagate through air-filled viscera such as bowel. There is a potential risk of bowel perforation if it lies close to the fibroids.108 Most of the articles were from China, as HIFU has been used in China for treatment of fibroids. In our hospital, the following criteria are used for patient selection: (1) premenopausal women with no plans for further childbearing; (2) severe fibroid symptoms (as defined by a transformed symptom severity score of >41 on the Uterine Fibroid Symptom and Quality of Life questionnaire); (3) a clinical uterine size of less than 20 weeks’ gestation, a dominant fibroid of less than 10 cm in diameter without areas of necrosis as judged by contrast-enhanced MRI, a non-pedunculated fibroid, and a fibroid not suspicious of malignancy; (4) no evidence of known or suspected extensive pelvic adhesions such as history of acute pelvic inflammatory disease, severe pelvic endometriosis, or lower abdominal surgery; and (5) an abdominal wall thickness of less than 5 cm.109
 
Bone tumour
Bone metastases
In palliative treatment of bone tumours, therapeutic goals include pain palliation, tumour reduction, prevention of impending pathological fractures, and/or tumour decompression. Opioid analgesics and radiation therapy are widely used for pain control in patients suffering from bone metastases but this does not always provide desired relief in many patients and is associated with undesirable side-effects.110 111 112 113 114 115 Research reveals that MRI-guided HIFU is safe and effective in the treatment of painful bone tumours.116 117 118 Periosteal denervation and tumour debulking may play a significant role in symptom relief.74 116 117 Response to HIFU is rapid and good pain control has been seen within days of treatment. This greatly improves the quality of life for many patients with disseminated cancer.119 There is also evidence of a reduction in lesion viability after HIFU and a remineralisation of spongious bone.120
 
Tumour ablation in curative treatment aims for complete coagulation necrosis of the primary lesion. Primary bone malignancy such as osteosarcoma has been treated with HIFU. A combination of chemotherapy with HIFU seems to be as effective as limb-sparing surgery and chemotherapy for malignant bone tumours.121 This is potentially useful for patients who are not fit for surgery. Treatment complications include skin burns, procedure-related pain, and post-treatment fractures.121 122 Most of the studies were clinical trials. More studies should focus on the treatment outcome in terms of the function, quality of life, and survival.
 
Glaucoma
The specific advantage of HIFU is that the energy can be focused through non-optically transparent media without uncontrolled energy absorption, thus reducing the effects on adjacent tissues. It allows a defined and adjustable tissue volume to be heated and treated at any depth or location within the eye. Intra-ocular pressure is decreased both by reducing aqueous humour production (aqueous inflow) and by facilitating the evacuation of aqueous humour from the eye (aqueous outflow).123 Prospective case series suggest there is a significant reduction in intra-ocular pressure without significant peri- or post-treatment side-effects.124
 
Atrial fibrillation
High-intensity focused ultrasound has been used to treat atrial fibrillation in cardiac surgery. This is designed to deliver pulmonary vein and posterior left atrial wall isolation on the beating heart using an encircling ‘cinch’ and create left atrial lines using a handheld wand device. It then ablates areas around the ganglionic plexi where dense collections of complex fractionated atrial electrograms are found. It has been proven to be safe and effective.125 Patients can be reverted to sinus rhythm and the results are more pronounced in patients with paroxysmal atrial fibrillation.46 126 Selected use of this technique has been suggested.127 If symptoms persist, other modalities should be considered.125
 
Conclusions
High-intensity focused ultrasound has many applications in both benign and malignant diseases. It offers an alternative to those patients for whom surgery is contra-indicated or inappropriate. The results of HIFU in the management of HCC patients in our centre are particularly promising. Further studies of the application of HIFU in various organs should be conducted for both clinical trials as well as comparative studies with other ablative modalities in the form of randomised controlled trials.
 
Declaration
No funding was received for the study or its publication. None of the authors has any conflict of interest with regard to the study or its publication.
 
References
1. Lynn JG, Zwemer RL, Chick AJ, Miller AE. A new method for the generation and use of focused ultrasound in experimental biology. J Gen Physiol 1942;26:179-93. Crossref
2. Fry WJ, Fry FJ. Fundamental neurological research and human neurosurgery using intense ultrasound. IRE Trans Med Electron 1960;ME-7:166-81. Crossref
3. Lynn JG, Putnam TJ. Histology of cerebral lesions produced by focused ultrasound. Am J Pathol 1944;20:637-49.
4. Coleman DJ, Lizzi FL, el-Mofty AA, Driller J, Franzen LA. Ultrasonically accelerated resorption of vitreous membranes. Am J Ophthalmol 1980;89:490-9. Crossref
5. Coleman DJ, Lizzi FL, Torpey JH, et al. Treatment of experimental lens capsular tears with intense focused ultrasound. Br J Ophthalmol 1985;69:645-9. Crossref
6. Coleman DJ, Lizzi FL, Driller J, et al. Therapeutic ultrasound in the treatment of glaucoma. II. Clinical applications. Ophthalmology 1985;92:347-53. Crossref
7. Rosenberg RS, Purnell EW. Effects of ultrasonic radiation to the ciliary body. Am J Ophthalmol 1967;63:403-9. Crossref
8. Silverman RH, Vogelsang B, Rondeau MJ, Coleman DJ. Therapeutic ultrasound for the treatment of glaucoma. Am J Ophthalmol 1991;111:327-37. Crossref
9. Rosecan LR, Iwamoto T, Rosado A, Lizzi FL, Coleman DJ. Therapeutic ultrasound in the treatment of retinal detachment: clinical observations and light and electron microscopy. Retina 1985;5:115-22. Crossref
10. Mearini L. High intensity focused ultrasound, liver disease and bridging therapy. World J Gastroenterol 2013;19:7494-9. Crossref
11. Dubinsky TJ, Cuevas C, Dighe MK, Kolokythas O, Hwang JH. High-intensity focused ultrasound: current potential and oncologic applications. AJR Am J Roentgenol 2008;190:191-9. Crossref
12. Yang R, Reilly CR, Rescorla FJ, et al. High-intensity focused ultrasound in the treatment of experimental liver cancer. Arch Surg 1991;126:1002-9; discussion 1009-10. Crossref
13. Holland CK, Apfel RE. Thresholds for transient cavitation produced by pulsed ultrasound in a controlled nuclei environment. J Acoust Soc Am 1990;88:2059-69. Crossref
14. Marmottant P, Hilgenfeldt S. Controlled vesicle deformation and lysis by single oscillating bubbles. Nature 2003;423:153-6. Crossref
15. Pitt WG, Husseini GA, Staples BJ. Ultrasonic drug delivery—a general review. Expert Opin Drug Deliv 2004;1:37-56. Crossref
16. Vaezy S, Shi X, Martin RW, et al. Real-time visualization of high-intensity focused ultrasound treatment using ultrasound imaging. Ultrasound Med Biol 2001;27:33-42. Crossref
17. Sapareto SA, Dewey WC. Thermal dose determination in cancer therapy. Int J Radiat Oncol Biol Phys 1984;10:787-800. Crossref
18. Dewhirst MW, Viglianti BL, Lora-Michiels M, Hanson M, Hoopes PJ. Basic principles of thermal dosimetry and thermal thresholds for tissue damage from hyperthermia. Int J Hyperthermia 2003;19:267-94. Crossref
19. ter Haar GR, Robertson D. Tissue destruction with focused ultrasound in vivo. Eur Urol 1993;23 Suppl 1:8-11.
20. Wu F, Chen WZ, Bai J, et al. Pathological changes in human malignant carcinoma treated with high-intensity focused ultrasound. Ultrasound Med Biol 2001;27:1099-106. Crossref
21. Kim YS, Rhim H, Choi MJ, Lim HK, Choi D. High-intensity focused ultrasound therapy: an overview for radiologists. Korean J Radiol 2008;9:291-302. Crossref
22. Li JJ, Xu GL, Gu MF, et al. Complications of high intensity focused ultrasound in patients with recurrent and metastatic abdominal tumors. World J Gastroenterol 2007;13:2747-51. Crossref
23. Sibille A, Prat F, Chapelon JY, et al. Extracorporeal ablation of liver tissue by high-intensity focused ultrasound. Oncology 1993;50:375-9. Crossref
24. Roberts WW, Hall TL, Ives K, Wolf JS Jr, Fowlkes JB, Cain CA. Pulsed cavitational ultrasound: a noninvasive technology for controlled tissue ablation (histotripsy) in the rabbit kidney. J Urol 2006;175:734-8. Crossref
25. ter Haar G. Ultrasound focal beam surgery. Ultrasound Med Biol 1995;21:1089-100. Crossref
26. Hynynen K, Freund WR, Cline HE, et al. A clinical, noninvasive, MR imaging–monitored ultrasound surgery method. Radiographics 1996;16:185-95. Crossref
27. Yagel S. High-intensity focused ultrasound: a revolution in non-invasive ultrasound treatment? Ultrasound Obstet Gynecol 2004;23:216-7. Crossref
28. Hynynen K, Pomeroy O, Smith DN, et al. MR imaging–guided focused ultrasound surgery of fibroadenomas in the breast: a feasibility study. Radiology 2001;219:176-85. Crossref
29. Dong X, Yang Z. High-intensity focused ultrasound ablation of uterine localized adenomyosis. Curr Opin Obstet Gynecol 2010;22:326-30. Crossref
30. Jung SE, Cho SH, Jang JH, Han JY. High-intensity focused ultrasound ablation in hepatic and pancreatic cancer: complications. Abdom Imaging 2011;36:185-95. Crossref
31. Orsi F, Zhang L, Arnone P, et al. High-intensity focused ultrasound ablation: effective and safe therapy for solid tumors in difficult locations. AJR Am J Roentgenol 2010;195:W245-52. Crossref
32. Tempany CM, Stewart EA, McDannold N, Quade BJ, Jolesz FA, Hynynen K. MR imaging–guided focused ultrasound surgery of uterine leiomyomas: a feasibility study. Radiology 2003;226:897-905. Crossref
33. Kim YS, Keserci B, Partanen A, et al. Volumetric MR-HIFU ablation of uterine fibroids: role of treatment cell size in the improvement of energy efficiency. Eur J Radiol 2012;81:3652-9. Crossref
34. Kim YS. Advances in MR image–guided high-intensity focused ultrasound therapy. Int J Hyperthermia 2015;31:225-32. Crossref
35. Sanghvi NT, Foster RS, Bihrle R, et al. Noninvasive surgery of prostate tissue by high intensity focused ultrasound: an updated report. Eur J Ultrasound 1999;9:19-29. Crossref
36. Beerlage HP, Thüroff S, Debruyne FM, Chaussy C, de la Rosette JJ. Transrectal high-intensity focused ultrasound using the Ablatherm device in the treatment of localized prostate carcinoma. Urology 1999;54:273-7. Crossref
37. Andreou C, Blana A, Orovan W, Hassouna M, Warner J, Woods E. Technical review: high-intensity focused ultrasound for prostate cancer. Can J Urol 2005;12:2684-5; discussion 2686.
38. Christopher T. HIFU focusing efficiency and a twin annular array source for prostate treatment. IEEE Trans Ultrason Ferroelectr Freq Control 2005;52:1523-33. Crossref
39. Curiel L, Chavrier F, Souchon R, Birer A, Chapelon JY. 1.5-D high intensity focused ultrasound array for non-invasive prostate cancer surgery. IEEE Trans Ultrason Ferroelectr Freq Control 2002;49:231-42. Crossref
40. Rebillard X, Gelet A, Davin JL, et al. Transrectal high-intensity focused ultrasound in the treatment of localized prostate cancer. J Endourol 2005;19:693-701. Crossref
41. Saleh KY, Smith NB. A 63 element 1.75 dimensional ultrasound phased array for the treatment of benign prostatic hyperplasia. Biomed Eng Online 2005;4:39. Crossref
42. Lindner U, Ghai S, Spensieri P, et al. Focal magnetic resonance guided focused ultrasound for prostate cancer: Initial North American experience. Can Urol Assoc J 2012;6:E283-6.
43. Siddiqui K, Chopra R, Vedula S, et al. MRI-guided transurethral ultrasound therapy of the prostate gland using real-time thermal mapping: initial studies. Urology 2010;76:1506-11. Crossref
44. Lafon C, Chapelon JY, Prat F, et al. Design and preliminary results of an ultrasound applicator for interstitial thermal coagulation. Ultrasound Med Biol 1998;24:113-22. Crossref
45. Melodelima D, Salomir R, Chapelon JY, Theillère Y, Moonen C, Cathignol D. Intraluminal high intensity ultrasound treatment in the esophagus under fast MR temperature mapping: in vivo studies. Magn Reson Med 2005;54:975-82. Crossref
46. Reyes G, Ruyra X, Valderrama F, et al. High intensity focused ultrasound ablation for atrial fibrillation: results from the National Spanish Registry. Minerva Cardioangiol 2015 May 26. Epub ahead of print.
47. Melamed S, Goldenfeld M, Cotlear D, Skaat A, Moroz I. High-intensity focused ultrasound treatment in refractory glaucoma patients: results at 1 year of prospective clinical study. Eur J Ophthalmol 2015;25:483-9. Crossref
48. Yao CL, Trinh T, Wong GT, Irwin MG. Anaesthesia for high intensity focused ultrasound (HIFU) therapy. Anaesthesia 2008;63:865-72. Crossref
49. Ng KK, Poon RT, Chan SC, et al. High-intensity focused ultrasound for hepatocellular carcinoma: a single-center experience. Ann Surg 2011;253:981-7. Crossref
50. Cheung TT, Poon RT, Jenkins CR, et al. Survival analysis of high-intensity focused ultrasound therapy vs. transarterial chemoembolization for unresectable hepatocellular carcinomas. Liver Int 2014;34:e136-43. Crossref
51. Cheung TT, Poon RT, Yuen WK, et al. Long-term survival analysis of pure laparoscopic versus open hepatectomy for hepatocellular carcinoma in patients with cirrhosis: a single-center experience. Ann Surg 2013;257:506-11. Crossref
52. Cheung TT, Fan ST, Chan SC, et al. High-intensity focused ultrasound ablation: an effective bridging therapy for hepatocellular carcinoma patients. World J Gastroenterol 2013;19:3083-9. Crossref
53. Wu F, Wang ZB, Chen WZ, et al. Advanced hepatocellular carcinoma: treatment with high-intensity focused ultrasound ablation combined with transcatheter arterial embolization. Radiology 2005;235:659-67. Crossref
54. Cheung TT, Chu FS, Jenkins CR, et al. Tolerance of high-intensity focused ultrasound ablation in patients with hepatocellular carcinoma. World J Surg 2012;36:2420-7. Crossref
55. Cheung TT, Fan ST, Chu FS, et al. Survival analysis of high-intensity focused ultrasound ablation in patients with small hepatocellular carcinoma. HPB (Oxford) 2013;15:567-73. Crossref
56. Chan AC, Cheung TT, Fan ST, et al. Survival analysis of high-intensity focused ultrasound therapy versus radiofrequency ablation in the treatment of recurrent hepatocellular carcinoma. Ann Surg 2013;257:686-92. Crossref
57. Chok KS, Cheung TT, Lo RC, et al. Pilot study of high-intensity focused ultrasound ablation as a bridging therapy for hepatocellular carcinoma patients wait-listed for liver transplantation. Liver Transpl 2014;20:912-21. Crossref
58. Orgera G, Krokidis M, Monfardini L, et al. High intensity focused ultrasound ablation of pancreatic neuroendocrine tumours: report of two cases. Cardiovasc Intervent Radiol 2011;34:419-23. Crossref
59. Wang K, Zhu H, Meng Z, et al. Safety evaluation of high-intensity focused ultrasound in patients with pancreatic cancer. Onkologie 2013;36:88-92. Crossref
60. Sung HY, Jung SE, Cho SH, et al. Long-term outcome of high-intensity focused ultrasound in advanced pancreatic cancer. Pancreas 2011;40:1080-6. Crossref
61. Shi Y, Ying X, Hu X, et al. Influence of high intensity focused ultrasound (HIFU) treatment to the pancreatic function in pancreatic cancer patients. Pak J Pharm Sci 2015;28 Suppl:1097-100.
62. Zhao H, Yang G, Wang D, et al. Concurrent gemcitabine and high-intensity focused ultrasound therapy in patients with locally advanced pancreatic cancer. Anticancer Drugs 2010;21:447-52. Crossref
63. Gao HF, Wang K, Meng ZQ, et al. High intensity focused ultrasound treatment for patients with local advanced pancreatic cancer. Hepatogastroenterology 2013;60:1906-10.
64. Xiong LL, Hwang JH, Huang XB, et al. Early clinical experience using high intensity focused ultrasound for palliation of inoperable pancreatic cancer. JOP 2009;10:123-9.
65. Wang K, Chen Z, Meng Z, et al. Analgesic effect of high intensity focused ultrasound therapy for unresectable pancreatic cancer. Int J Hyperthermia 2011;27:101-7. Crossref
66. Wu F, Wang ZB, Zhu H, et al. Feasibility of US-guided high-intensity focused ultrasound treatment in patients with advanced pancreatic cancer: initial experience. Radiology 2005;236:1034-40. Crossref
67. Uchida T, Shoji S, Nakano M, et al. Transrectal high-intensity focused ultrasound for the treatment of localized prostate cancer: eight-year experience. Int J Urol 2009;16:881-6. Crossref
68. Blana A, Walter B, Rogenhofer S, Wieland WF. High-intensity focused ultrasound for the treatment of localized prostate cancer: 5-year experience. Urology 2004;63:297-300. Crossref
69. Ripert T, Azémar MD, Ménard J, et al. Six years’ experience with high-intensity focused ultrasonography for prostate cancer: oncological outcomes using the new ‘Stuttgart’ definition for biochemical failure. BJU Int 2011;107:1899-905. Crossref
70. Crouzet S, Chapelon JY, Rouvière O, et al. Whole-gland ablation of localized prostate cancer with high-intensity focused ultrasound: oncologic outcomes and morbidity in 1002 patients. Eur Urol 2014;65:907-14. Crossref
71. Mearini L, D’Urso L, Collura D, Nunzi E, Muto G, Porena M. High-intensity focused ultrasound for the treatment of prostate cancer: A prospective trial with long-term follow-up. Scand J Urol 2015;49:267-74. Crossref
72. Heidenreich A, Bastian PJ, Bellmunt J, et al. EAU guidelines on prostate cancer. part 1: screening, diagnosis, and local treatment with curative intent—update 2013. Eur Urol 2014;65:124-37. Crossref
73. Ahmed HU, Hindley RG, Dickinson L, et al. Focal therapy for localised unifocal and multifocal prostate cancer: a prospective development study. Lancet Oncol 2012;13:622-32. Crossref
74. Napoli A, Anzidei M, De Nunzio C, et al. Real-time magnetic resonance–guided high-intensity focused ultrasound focal therapy for localised prostate cancer: preliminary experience. Eur Urol 2013;63:395-8. Crossref
75. Van Poppel H, Becker F, Cadeddu JA, et al. Treatment of localised renal cell carcinoma. Eur Urol 2011;60:662-72. Crossref
76. Ljungberg B, Bensalah K, Canfield S, et al. EAU guidelines on renal cell carcinoma: 2014 update. Eur Urol 2015;67:913-24. Crossref
77. Illing RO, Kennedy JE, Wu F, et al. The safety and feasibility of extracorporeal high-intensity focused ultrasound (HIFU) for the treatment of liver and kidney tumours in a Western population. Br J Cancer 2005;93:890-5. Crossref
78. Ritchie RW, Leslie T, Phillips R, et al. Extracorporeal high intensity focused ultrasound for renal tumours: a 3-year follow-up. BJU Int 2010;106:1004-9. Crossref
79. Wu F, Wang ZB, Chen WZ, Bai J, Zhu H, Qiao TY. Preliminary experience using high intensity focused ultrasound for the treatment of patients with advanced stage renal malignancy. J Urol 2003;170(6 Pt 1):2237-40. Crossref
80. Kohrmann KU, Michel MS, Gaa J, Marlinghaus E, Alken P. High intensity focused ultrasound as noninvasive therapy for multilocal renal cell carcinoma: case study and review of the literature. J Urol 2002;167:2397-403. Crossref
81. Ritchie R, Collin J, Coussios C, Leslie T. Attenuation and de-focusing during high-intensity focused ultrasound therapy through peri-nephric fat. Ultrasound Med Biol 2013;39:1785-93. Crossref
82. Fry WJ, Mosberg WH Jr, Barnard JW, Fry FJ. Production of focal destructive lesions in the central nervous system with ultrasound. J Neurosurg 1954;11:471-8. Crossref
83. Fry WJ, Barnard JW, Fry EJ, Krumins RF, Brennan JF. Ultrasonic lesions in the mammalian central nervous system. Science 1955;122:517-8. Crossref
84. Fry FJ. Precision high intensity focusing ultrasonic machines for surgery. Am J Phys Med 1958;37:152-6. Crossref
85. Jeanmonod D, Moser D, Magara A, et al. Study of incisionless transcranial magnetic resonance–guided focused ultrasound treatment of Parkinson’s disease: Safety, accuracy and initial clinical outcomes. Proceedings of the Current and Future Applications of Focused Ultrasound 2012, 3rd International Symposium; 2012 Oct 14-17; Washington, DC Metro Area, United States.
86. Elias WJ, Huss D, Voss T, et al. A pilot study of focused ultrasound thalamotomy for essential tremor. N Engl J Med 2013;369:640-8. Crossref
87. Lipsman N, Schwartz ML, Huang Y, et al. MR-guided focused ultrasound thalamotomy for essential tremor: a proof-of-concept study. Lancet Neurol 2013;12:462-8. Crossref
88. Jeanmonod D, Werner B, Morel A, et al. Transcranial magnetic resonance imaging–guided focused ultrasound: noninvasive central lateral thalamotomy for chronic neuropathic pain. Neurosurg Focus 2012;32:E1. Crossref
89. Wu F, Wang ZB, Cao YD, et al. Changes in biologic characteristics of breast cancer treated with high-intensity focused ultrasound. Ultrasound Med Biol 2003;29:1487-92. Crossref
90. Furusawa H, Namba K, Thomsen S, et al. Magnetic resonance–guided focused ultrasound surgery of breast cancer: reliability and effectiveness. J Am Coll Surg 2006;203:54-63. Crossref
91. Gianfelice D, Khiat A, Amara M, Belblidia A, Boulanger Y. MR imaging–guided focused US ablation of breast cancer: histopathologic assessment of effectiveness—initial experience. Radiology 2003;227:849-55. Crossref
92. Gianfelice D, Khiat A, Amara M, Belblidia A, Boulanger Y. MR imaging–guided focused ultrasound surgery of breast cancer: correlation of dynamic contrast-enhanced MRI with histopathologic findings. Breast Cancer Res Treat 2003;82:93-101. Crossref
93. Zippel DB, Papa MZ. The use of MR imaging guided focused ultrasound in breast cancer patients; a preliminary phase one study and review. Breast Cancer 2005;12:32-8. Crossref
94. Khiat A, Gianfelice D, Amara M, Boulanger Y. Influence of post-treatment delay on the evaluation of the response to focused ultrasound surgery of breast cancer by dynamic contrast enhanced MRI. Br J Radiol 2006;79:308-14. Crossref
95. Poggi MM, Danforth DN, Sciuto LC, et al. Eighteen-year results in the treatment of early breast carcinoma with mastectomy versus breast conservation therapy: the National Cancer Institute randomized trial. Cancer 2003;98:697-702. Crossref
96. van Dongen JA, Bartelink H, Fentiman IS, et al. Factors influencing local relapse and survival and results of salvage treatment after breast-conserving therapy in operable breast cancer: EORTC trial 10801, breast conservation compared with mastectomy in TNM stage I and II breast cancer. Eur J Cancer 1992;28A(4-5):801-5. Crossref
97. Myers MR. Transient temperature rise due to ultrasound absorption at a bone/soft-tissue interface. J Acoust Soc Am 2004;115:2887-91. Crossref
98. Zderic V, Foley J, Luo W, Vaezy S. Prevention of post-focal thermal damage by formation of bubbles at the focus during high intensity focused ultrasound therapy. Med Phys 2008;35:4292-9. Crossref
99. Vollenhoven BJ, Lawrence AS, Healy DL. Uterine fibroids: a clinical review. Br J Obstet Gynaecol 1990;97:285-98. Crossref
100. Wu F, Wang ZB, Chen WZ, et al. Extracorporeal focused ultrasound surgery for treatment of human solid carcinomas: early Chinese clinical experience. Ultrasound Med Biol 2004;30:245-60. Crossref
101. Smart OC, Hindley JT, Regan L, Gedroyc WM. Magnetic resonance guided focused ultrasound surgery of uterine fibroids—the tissue effects of GnRH agonist pre-treatment. Eur J Radiol 2006;59:163-7. Crossref
102. Yoon SW, Kim KA, Cha SH, et al. Successful use of magnetic resonance–guided focused ultrasound surgery to relieve symptoms in a patient with symptomatic focal adenomyosis. Fertil Steril 2008;90:2018.e13-5. Crossref
103. Fennessy FM, Tempany CM, McDannold NJ, et al. Uterine leiomyomas: MR imaging–guided focused ultrasound surgery—results of different treatment protocols. Radiology 2007;243:885-93. Crossref
104. Lénárd ZM, McDannold NJ, Fennessy FM, et al. Uterine leiomyomas: MR imaging–guided focused ultrasound surgery—imaging predictors of success. Radiology 2008;249:187-94. Crossref
105. Mikami K, Murakami T, Okada A, Osuga K, Tomoda K, Nakamura H. Magnetic resonance imaging–guided focused ultrasound ablation of uterine fibroids: early clinical experience. Radiat Med 2008;26:198-205. Crossref
106. LeBlang SD, Hoctor K, Steinberg FL. Leiomyoma shrinkage after MRI-guided focused ultrasound treatment: report of 80 patients. AJR Am J Roentgenol 2010;194:274-80. Crossref
107. Zhang L, Chen WZ, Liu YJ, et al. Feasibility of magnetic resonance imaging–guided high intensity focused ultrasound therapy for ablating uterine fibroids in patients with bowel lies anterior to uterus. Eur J Radiol 2010;73:396-403. Crossref
108. Kennedy JE, Ter Haar GR, Cranston D. High intensity focused ultrasound: surgery of the future? Br J Radiol 2003;76:590-9. Crossref
109. Cheung VY. Sonographically guided high-intensity focused ultrasound for the management of uterine fibroids. J Ultrasound Med 2013;32:1353-8. Crossref
110. Chow E, Harris K, Fan G, Tsao M, Sze WM. Palliative radiotherapy trials for bone metastases: a systematic review. J Clin Oncol 2007;25:1423-36. Crossref
111. Hartsell WF, Scott CB, Bruner DW, et al. Randomized trial of short- versus long-course radiotherapy for palliation of painful bone metastases. J Natl Cancer Inst 2005;97:798-804. Crossref
112. Cleeland CS. The measurement of pain from metastatic bone disease: capturing the patient’s experience. Clin Cancer Res 2006;12(20 Pt 2):6236s-42s. Crossref
113. van der Linden YM, Lok JJ, Steenland E, et al. Single fraction radiotherapy is efficacious: a further analysis of the Dutch Bone Metastasis Study controlling for the influence of retreatment. Int J Radiat Oncol Biol Phys 2004;59:528-37. Crossref
114. Mundy GR. Metastasis to bone: causes, consequences and therapeutic opportunities. Nat Rev Cancer 2002;2:584-93. Crossref
115. Saarto T, Janes R, Tenhunen M, Kouri M. Palliative radiotherapy in the treatment of skeletal metastases. Eur J Pain 2002;6:323-30. Crossref
116. Catane R, Beck A, Inbar Y, et al. MR-guided focused ultrasound surgery (MRgFUS) for the palliation of pain in patients with bone metastases—preliminary clinical experience. Ann Oncol 2007;18:163-7. Crossref
117. Gianfelice D, Gupta C, Kucharczyk W, Bret P, Havill D, Clemons M. Palliative treatment of painful bone metastases with MR imaging–guided focused ultrasound. Radiology 2008;249:355-63. Crossref
118. Liberman B, Gianfelice D, Inbar Y, et al. Pain palliation in patients with bone metastases using MR-guided focused ultrasound surgery: a multicenter study. Ann Surg Oncol 2009;16:140-6. Crossref
119. Zeng L, Chow E, Bedard G, et al. Quality of life after palliative radiation therapy for patients with painful bone metastases: results of an international study validating the EORTC QLQ-BM22. Int J Radiat Oncol Biol Phys 2012;84:e337-42. Crossref
120. Napoli A, Anzidei M, Marincola BC, et al. Primary pain palliation and local tumor control in bone metastases treated with magnetic resonance–guided focused ultrasound. Invest Radiol 2013;48:351-8. Crossref
121. Chen W, Zhu H, Zhang L, et al. Primary bone malignancy: effective treatment with high-intensity focused ultrasound ablation. Radiology 2010;255:967-78. Crossref
122. Hurwitz MD, Ghanouni P, Kanaev SV, et al. Magnetic resonance–guided focused ultrasound for patients with painful bone metastases: phase III trial results. J Natl Cancer Inst 2014;106:dju082. Crossref
123. Aptel F, Begle A, Razavi A, et al. Short- and long-term effects on the ciliary body and the aqueous outflow pathways of high-intensity focused ultrasound cyclocoagulation. Ultrasound Med Biol 2014;40:2096-106. Crossref
124. Aptel F, Dupuy C, Rouland JF. Treatment of refractory open-angle glaucoma using ultrasonic circular cyclocoagulation: a prospective case series. Curr Med Res Opin 2014;30:1599-605. Crossref
125. Davies EJ, Bazerbashi S, Asopa S, Haywood G, Dalrymple-Hay M. Long-term outcomes following high intensity focused ultrasound ablation for atrial fibrillation. J Card Surg 2014;29:101-7. Crossref
126. Garcia R, Sacher F, Oses P, et al. Electrophysiological study 6 months after Epicor high-intensity focused ultrasound atrial fibrillation ablation. J Interv Card Electrophysiol 2014;41:245-51. Crossref
127. Colli A, Romero-Ferrer B. It is time to revisit the theory of acute conduction block: efficacy of high-intensity focused ultrasound epicardial ablation. Eur J Cardiothorac Surg 2013;43:451-2. Crossref

Oral health of Hong Kong children: a historical and epidemiological perspective

Hong Kong Med J 2016 Aug;22(4):372–81 | Epub 20 May 2016
DOI: 10.12809/hkmj154686
© Hong Kong Academy of Medicine. CC BY-NC-ND 4.0
 
REVIEW ARTICLE
Oral health of Hong Kong children: a historical and epidemiological perspective
Gillian HM Lee, FCDSHK (Paediatric Dentistry), FHKAM (Dental Surgery); Harry N Pang, FCDSHK (Orthodontics), FHKAM (Dental Surgery); Colman McGrath, FFDRCS (Ire), PhD (Eng); Cynthia KY Yiu, FHKAM (Dental Surgery), FCDSHK (Paediatric Dentistry)
Faculty of Dentistry, The University of Hong Kong, Pokfulam, Hong Kong
 
Corresponding author: Dr Gillian HM Lee (lee.gillian@gmail.com)
 
 Full paper in PDF
Abstract
Objective: To provide a historical and epidemiological overview of the oral health of Hong Kong children.
 
Methods: Literature published before 2014 related to the oral health of Hong Kong children, supplemented with information accessed from government-archived oral health reports, was sourced using electronic databases and hand searches. Dental caries experience, periodontal health, enamel defects, and malocclusion of Hong Kong children were reviewed.
 
Results: A decline in the prevalence and extent of dental caries was observed among Hong Kong schoolchildren and adolescents after the 1960s. Among preschool children, however, dental caries remains common and the extent appears to have increased. The periodontal health of Hong Kong children remains unsatisfactory. Recently, enamel defects/dental fluorosis have considerably reduced. Information about malocclusion in Hong Kong children is limited.
 
Conclusions: Since the 1960s, following public health policies, health promotion activities, and the introduction of a School Dental Care Service, improvements in the oral health of schoolchildren are evident. Nonetheless, the oral health of preschool children remains a concern. Policies and practices to improve the oral health of preschool children in Hong Kong are required.


Introduction
Over the past 50 years, a number of dental public health measures and policies have been established by the government in Hong Kong to help improve the oral health of the population. Children have been the focus for many of these dental public health practices since the 1960s and these have included prevention strategies, oral health education, and the provision of the School Dental Care Service (SDCS).
 
Historical development of Hong Kong’s public health measures for children
Water fluoridation is one of the most successfully implemented dental public health measures in Hong Kong. The project was launched in 1961 and has remarkably reduced the prevalence of dental caries in Hong Kong.1 All areas with a centralised water supply are fluoridated. Prior to its implementation, the natural fluoride concentration of drinking water in Hong Kong was less than 0.13 parts per million (ppm). Several adjustments have been made to the water fluoride level in Hong Kong since its implementation: from 0.7 ppm for summer months and 0.9 ppm for winter months in 1961, to 1 ppm in 1967; then reduced to 0.7 ppm in 1978; and further to 0.5 ppm in 1988 because of concerns of an increased prevalence of dental fluorosis in the population.
 
In late 1979, the SDCS was introduced to provide prevention and dental treatment to primary schoolchildren in Hong Kong. The SDCS also aims to promote oral health by delivering oral health education to schoolchildren. Preschool children in Hong Kong are not routinely eligible for the SDCS. They receive oral health care and treatment largely from dentists working in the private sector. Oral health education for preschool children was introduced through the ‘Brighter Smiles for the New Generation’ programme by the government in 1993. This programme promotes oral health awareness by educating children aged under 6 years about good oral health–related behaviour. It also aims to increase their teachers’ and parents’ oral health care knowledge.
 
The community is served by registered professional oral health care personnel. The Faculty of Dentistry at the University of Hong Kong was established in 1981 and began training dentists and supporting dental personnel in the same year. More than one third of local practising dentists have been educated in Hong Kong.2 The number of practising dentists currently serving the community has increased to about 2310 personnel, a per capita ratio of 1:3125.3 Before 1973, there were only about 440 practising dentists, a per capita ratio of 1:9000. In the past, it was often only the economic affluent who sought treatment from private dental practitioners. For many others, teeth were considered a dispensable commodity.2 Although this situation has improved, access to dental care for the Hong Kong population remains inadequate.
 
Oral health care products (fluoridated toothpaste, mouth rinses, toothbrushes, and floss) are now widely available in Hong Kong.4 These easily accessible fluoride-containing products provide an additional benefit to the oral health of the Hong Kong population. Most locally available toothpastes have a fluoride concentration of 1000 to 1500 ppm, while those for children have 600 ppm. Mouth rinse with 0.05% sodium fluoride is also freely available, though its use among children is not common and it is not recommended for the very young.
 
Over the years, dentistry in Hong Kong has advanced and oral health care has greatly improved under several government public health policies. Although children have been the primary target of such initiatives, information and review of the effects of the changes and trends in the oral health of Hong Kong children are limited. This is in part due to the limited dissemination of findings, particularly those of earlier government reports. Understanding the trends and current oral health condition of Hong Kong children is important. It can provide a historical and epidemiological overview of dental activity and inform the planning of future public health measures, prevention, and services for children. It may also help set future oral health targets and specific goals.
 
This paper reviews all available oral health epidemiological data and information of Hong Kong children from published literature before 2014 through electronic database searches, supplemented with information accessed from government-archived oral health reports. Reference lists of articles retrieved from the electronic databases were hand-searched for any other articles that might provide information relevant to the objectives of this paper. Major oral health problems of Hong Kong children—including dental caries experience, periodontal health, enamel defects, malocclusion, and orthodontic treatment need—are described.
 
Dental caries experience
A number of population-based oral epidemiological studies involving children have been conducted in Hong Kong since the 1960s. Available epidemiological data regarding dental caries experience and the extent/severity of dental caries among Hong Kong children are summarised in Table 1.4 5 6 7 8 9 10 11 12 13 14 15 16 17 18 19 20 These studies employed different sampling methods as criteria of assessment differed prior to the 1970s. More recent surveys have followed World Health Organization’s criteria for caries assessment.
 

Table 1. Dental caries experience in Hong Kong children4 5 6 7 8 9 10 11 12 13 14 15 16 17 18 19 20
 
Dental caries experience of schoolchildren and adolescents (aged 6-18 years)
To date, there are 13 population-based epidemiological studies reporting the prevalence and extent of dental caries experience among Hong Kong schoolchildren and adolescents. A remarkable decrease in caries experience and severity among schoolchildren and adolescents has been observed since the 1960s.
 
The earliest report of dental caries experience among schoolchildren and adolescents was carried out in 1960, a year before the implementation of water fluoridation.5 The epidemiological findings gave cause for concern. Almost all children aged 6 to 11 years who participated in the study (aged 6-8: 97.5%; aged 9-11: 93.4%) had dental caries. The mean number of decayed, missing, or filled permanent teeth (DMFT) in 6-8-year-olds and 9-11-year-olds was 2.7 and 4.4, respectively; the mean decayed, missing, or filled primary teeth (dmft) in 6-8- and 9-11-year-olds was 9.2 and 3.8, respectively. Decayed teeth constituted the major component (>90%) of the dmft/DMFT index in both dentitions, and extracted and filled teeth components were minimal. This signified that there were no systematic dental care services available at the time and with limited preventive measures.
 
In 1962, the second population-wide oral health survey was conducted using similar sampling methodology to the 1960 survey,6 1 year after the implementation of water fluoridation. There was a reported slight decrease in the prevalence of dental caries experience (for those aged 6-8 years: 96.4%; for those aged 9-11 years: 90.0%). The mean dmft and DMFT showed a significant decline of approximately 20% (mean DMFT: 2.2 for those aged 6-8 years and 3.5 for those aged 9-11 years; mean dmft: 8.4 for those aged 6-8 years and 3.1 for those aged 9-11 years). As in the 1960 survey, decayed teeth constituted the major component of the DMFT, showing limited change in the provision/usage of dental care services. As this survey was conducted a year after water fluoridation, the decrease in dental caries could not be fully explained by exposure to fluoridated water. No report on the difference in dmft/DMFT among children who had received fluoridated water for the whole time, intermittently, or not at all was provided.
 
The third oral health survey of Hong Kong was completed in 1968, 7 years after the introduction of water fluoridation.7 The sampling method differed to the earlier surveys. Subjects aged 3 to 54 years were selected. The dental caries experience in the primary dentition was 83.8% (mean dmft: 5.0) for 3-8-year-olds, whereas the dental caries experience in the permanent dentition was 67.2% (mean DMFT: 2.0) for 9-14-year-olds, and 84.0% (mean DMFT: 4.6) for 15-19-year-olds. It represented a significant decrease in both caries experience and its extent among children when compared with previous surveys. This favourable change was attributed to water fluoridation as there were no other widely available caries preventive measures or systematic dental care services in the 1960s.
 
In 1980, another population-based dental health survey collected baseline data for future evaluation of the SDCS.8 The majority of schoolchildren (aged 6-11 years) examined were caries-free in their permanent dentition. The mean DMFT was <1 for children aged <9 years and 1.5 for 11-year-olds. The caries experience in the primary dentition of the children was high, however. The mean dmft for 6-year-olds was 4.3. The number of extracted and filled teeth for both dentitions was low. More than 90% of decayed teeth were untreated, indicating the lack of utilisation of dental services and a very high unmet treatment need.
 
The epidemiological studies conducted in the 1980s after the commencement of SDCS to monitor the effect of fluoride on dental caries experience of Hong Kong schoolchildren and adolescents after over 20 years of water fluoridation showed a further decrease in caries experience and severity. The reported mean DMFT of schoolchildren and adolescents in these surveys ranged from 0.3 to 2.89 10 11 12 and the mean dmft was 2.2.11 The caries experience was >65% in primary dentition and 18.3% to 77% in permanent dentition.11 12 The major component of the DMFT of the children of this time was decayed teeth, demonstrating that there was still a high unmet need for dental services, although the SDCS was already enacted. Caries was mostly experienced in molar teeth for children aged 9 to 12 years.
 
The caries prevalence and extent among Hong Kong schoolchildren and adolescents continued to show improvements. Kwan13 reported the first survey of schoolchildren aged 13 and 15 years who joined the SDCS in 1992. The dental caries experience was approximately 55%, with a mean DMFT of 1.3 for 13-year-olds and 1.6 for 15-year-olds. The result corresponded to a study by Yiu et al14 that reported a caries experience of 51% and a mean DMFT of 1.4 among 15-year-olds. In 1992, Evans and Lo15 also studied the effects of the SDCS on the dental status of primary teeth among a sample of Chinese children aged 6 to 12 years. The caries experience was 68%, with dmft indices for 6-, 7-, 8-, 9-, and 10-year-olds being 2.8, 3.1, 2.9, 2.3, and 1.3, respectively. The ratio of decayed-to-filled teeth decreased from 3.2 at age 6 to 1.0 at age 9. The mean number of filled teeth was the major component of the dmft index in these surveys, indicating that many children had received dental care.
 
The Hong Kong SAR Government conducted a population-based survey of the oral health status of 12-year-old children in 2001 and 2011.16 17 More than one-third (37.8%) of the children in 2001 had a caries experience in their permanent dentition and in 2011, 22.6% of the children had a caries experience. The extent/severity of caries was low (mean DMFT: 0.8 in 2001, 0.4 in 2011). Most of the decay experience was attributed to the filled component. The proportion of untreated decay was also rather low, with only 5.4% reported to have untreated decayed teeth in 2011. This positive development in oral health was associated with reported better oral health knowledge and oral care habits in both parents and children. A large number of the participants claimed they had regular dental check-ups.
 
In the past 50 years, for Hong Kong schoolchildren and adolescents, the prevalence of dental caries experience in permanent teeth has reduced from more than 90% (in the 1960s) to approximately 50% in the 1980s/90s and to less than 25% currently. The mean number of DMFT has also declined from over 4 in the 1960s to approximately 2 in the 1980s/90s, and to less than 1 currently.
 
Dental caries experience of preschool children (aged ≤5 years)
There were seven epidemiological studies reporting dental caries experience among preschool children. Improvement among preschool children is less since the 1960s, compared with improvements among schoolchildren and adolescents and it remains a considerable problem.
 
The earliest oral health survey that involved young children was the population-based survey conducted in 1968.7 The prevalence of dental caries experience among 3-8-year-old children at that time was over 80%, with a dmft of 5. One quarter of the primary teeth of the children were decayed. The second report of preschool children caries experience in Hong Kong was drawn up by Wei et al.18 Conducted between 1986 and 1988 among approximately 10% of 5-year-old children, the percentage of children with caries in their primary dentition was 63%. The mean dmft was 3.2. Dental caries experience was higher for children from socio-economically disadvantaged families. Over 70% of the children had never visited a dentist.
 
The caries experience of Hong Kong preschool children further decreased to about 50% in the late 1990s.4 The mean dmft of children (4-6-year-olds) was 1.6. More than 90% of the dmft score was attributed to decayed untreated teeth. Similar to the findings of Wei et al,18 the children’s caries experience was associated with underprivileged socio-economic background, and parental educational level, dental knowledge, and attitudes.
 
In the recent decade, no great changes among preschool children caries status have been observed. The caries prevalence in preschool children remains similar, with a reported prevalence of 35% to 51%.16 17 19 20 The extent/severity of caries, however, showed a slight increase when compared with the late 1990s (mean dmft of children aged 3-5 years ranged from 1.5 to 2.5). Over 90% of the decayed teeth of the children were untreated. Almost one tenth of the children presented with abscess, with a higher percentage reported in the 2011 survey than in the 2001 survey.16 17 These recent surveys also found that children’s caries experience was associated with their place of birth, socio-economic background, and dietary habits.
 
Periodontal health status
Detailed information about the periodontal status of Hong Kong children is less readily available when compared with information about dental caries experience. Different assessment criteria have been used to assess periodontal health among children and adolescents, making it difficult to compare surveys.
 
The earliest report of the periodontal health status of Hong Kong children (aged 3-19 years) was drawn up by Wong in 1968.7 Wong7 reported that “oral hygiene was only fair in 70% of the children” and that “over 60% of the children had inflamed gingiva, and material alba was found on over 90% of the teeth surfaces”. Inflamed gingiva (gingivitis) is the reversible and non-destructive form of periodontal disease. This suggested that the children had poor periodontal health, though the criteria of assessment were not defined.
 
Law8 provided more specific details about the periodontal health status of 5-14-year-old Hong Kong children. Approximately 85% were reported to have soft deposits (assume plaque), of whom approximately one (19.2%) in five had ‘intensive gingivitis’ (inflamed gingiva). Calculus was observed among over a quarter (26.4%) of the children, and the percentage of calculus deposits increased with age.
 
Epidemiological studies conducted in the late 1980s employed the Community Periodontal Index (CPI) to assess the periodontal health status. It is the standard epidemiological index for assessing periodontal health,21 and results of the surveys were comparable. The epidemiological studies reporting periodontal health status of Hong Kong children using the CPI are shown in Table 2.10 11 13 14 16 17 The majority reported periodontal health status of adolescents. Among adolescents (13-18 years old), two of three studies10 13 14 reported that less than 10% had ‘healthy’ periodontal status (CPI=0) and more than half had evidence of calculus in some parts of the mouth (CPI=2). This showed that the periodontal health of Hong Kong adolescents was unsatisfactory.
 

Table 2. Periodontal health status of Hong Kong children10 11 13 14 16 17
 
For Hong Kong schoolchildren, the first detailed report of their periodontal health status was conducted by Wong11 among 7882 primary schoolchildren (aged 6-11 years) in 1987. More than half of the sextants (3.9) of the children had healthy gingiva (CPI=0). Nonetheless, more than half (56.1%) of the children had bleeding gingiva (CPI=1) or calculus deposits (CPI=2).
 
Two population-based oral health surveys among schoolchildren (12-year-old children) were conducted by the government in 2001 and 2011.16 17 The 2011 survey showed an improvement in periodontal health status. More schoolchildren were found to have healthy gingiva (CPI=0) in 2011: 13.8% compared with 5.5% in the 2001 survey; and less children had calculus deposits (CPI=2) in 2011: 22.4% compared with 59.5% in the 2001 survey. Of note, more than half of their sextants had either bleeding gingiva or calculus deposits in 2001 and an average of two of the sextants had these problems in 2011.
 
Studies that applied the Visible Plaque Index to assess periodontal health of Hong Kong preschool children are shown in Table 3.16 17 22 Such Index was introduced by Ainamo and Bay23 as a standardised assessment of oral hygiene status. It is simple and reliable to use and has been employed in surveys as a proxy of gingival health, representing the site prevalence of ‘clearly visible dental plaque’ at the gingival margin. The oral hygiene of the preschool children in Hong Kong was poor.16 17 22 Almost all 5-year-old children (97%) had at least one site with ‘clearly visible dental plaque’.16 17 The mean percentage of tooth surfaces with visible dental plaque was 22.1% in 2011 and 23.5% in 2001. A study conducted among 531 children aged 3 to 4 years in 2009, however, reported that 49.7% of the tooth surfaces had visible plaque.22 In general, the gingival condition and tooth cleanliness of both schoolchildren and preschool children were unsatisfactory and required much improvement.
 

Table 3. Periodontal health status of Hong Kong preschool children16 17 22
 
Dental fluorosis/enamel defects
Dental fluorosis consequent to exposure to fluoride may develop during the formation of teeth in young children. Table 4 outlines the studies reporting dental fluorosis using Dean’s Index in Hong Kong to date.5 6 10 11 Epidemiological studies reporting dental fluorosis showed that the level was low in the 1960s.5 6 Nearly all examined children aged 6 to 11 years had ‘normal’ enamel. Less than 1% were assessed as having a ‘mild’ or ‘questionable’ degree of fluorosis in 1960 or having a ‘moderate’ or ‘questionable’ degree of fluorosis in 1962.
 

Table 4. Dental fluorosis in Hong Kong children5 6 10 11
 
Dental fluorosis was reported to be more prevalent in the 1980s, particularly among adolescents.10 11 Over 80% of the 15-19-year-olds in the study by Lind et al10 exhibited signs of dental fluorosis; and approximately 50% of the 6-11-year-olds in the study by Wong11 showed various degrees of dental fluorosis.
 
King24 reported the prevalence of enamel defects among a random sample of 12-year-old children in Hong Kong. The prevalence of teeth with opacities was 99.6%; 82.8% had evidence of hypoplasia and 16.6% had discoloured teeth. The author believed that many of the enamel defects were likely to be related to dental fluorosis. The findings in the 1980s suggested a marked increase in the level of dental fluorosis since the introduction of water fluoridation in the 1960s and it was then advocated to lower the water fluoridated level.1 The prevalence declined considerably over the decades when the level of fluoride in the water supply was adjusted and lowered.25 At present the level of water fluoridation is optimal at 0.5 ppm. The trend of decreasing dental fluorosis prevalence was evident in the study by Evans and Stamm.26 The prevalence decreased from 64% to 47% across the cohort of children from older (aged 12) to younger (aged 7) born before and after reduction of fluoride level to 0.7 ppm in 1978.
 
The prevalence and severity of developmental defects of enamel (DDE) have also been studied. Cross-sectional surveys showed that the prevalence of diffuse opacities among random samples of 12-year-old children (based on maxillary incisors and assessed using standardised intra-oral photographs) declined from 89.3% in 1983 to 32.4% in 2001, but increased to 42.1% in 2010.27 The mouth prevalence of DDE among maxillary incisor teeth of the children also decreased from 92.1% in 1983 to 35.2% in 2001.28 Wong et al29 also reported the prevalence of DDE among Hong Kong 12-year-old children at 90% in a 2010 cohort study (89.5% had diffuse opacities, 8.6% demarcated opacities, and 1.8% hypoplasia), using the modified version of the DDE index by FDI (Fédération Dentaire Internationale) to diagnose DDE.30 The prevalence of molar incisor hypomineralisation was reported as 2.8% among Primary 6 Chinese schoolchildren in a 2006 retrospective study.31
 
Malocclusion and orthodontic treatment need
Epidemiological data on malocclusion and orthodontic treatment need among Hong Kong children are scant. Relatively few surveys have been conducted since the 1960s but details of the available studies are shown in Table 5.7 8 10 11 32 33 The studies were heterogeneous in terms of criteria used to assess dentofacial anomalies that require orthodontic intervention and age of the sampled children. Comparison and description of estimates of orthodontic treatment are difficult.
 

Table 5. Malocclusion and orthodontic treatment need among Hong Kong children7 8 10 11 32 33
 
Earlier epidemiological studies of malocclusion and orthodontic treatment need among Hong Kong children suggested that dentofacial deformities requiring treatment intervention was ≤20%. More recent studies suggest orthodontic treatment need to be closer to 40%. It is estimated that about one third of children have a ‘definite’ orthodontic treatment need. A report by Allwright and Burndred32 provided the first published study of the prevalence of dentofacial anomalies requiring treatment intervention among Hong Kong children. Their study included 31% of the 6-11-year-old children who participated in the 1962 oral health survey6 and reported that 40.9% of the children exhibited certain dentofacial anomalies. The most common malocclusions were crowding (20.3%), maxillary overjet (14.5%), mandibular overjet (8.1%), overbite (6.9%), spacing (2.9%), and open bite (1.1%). The prevalence of handicapping dentofacial anomalies was higher among those aged 9 to 11 years (54.2%) than among those aged 6 to 8 years (36.4%).
 
Wong7 reported that approximately one (20.6%) in five of 5-14-year-old children had dentofacial anomalies that required dental treatment. The most common dentofacial anomaly was crowding (17.6%), followed by maxillary overjet (9.5%), overbite (4.2%), mandibular overjet (2.7%), spacing (1.1%), and open bite (0.7%). The prevalence of anomalies was higher among those aged 9 to 15 years (28.2%) than among those aged 5 to 8 years (16.4%). The reduction in the prevalence estimates of malocclusion when compared with the 1960 study6 could be due to the participation of different examiners (orthodontists in 1960 study vs general dental practitioners in 1968 study) and the wider age range of children involved in the 1968 survey.7
 
In the 1980s, the reported prevalence of dentofacial anomalies that required treatment was 10% to 36%.8 10 11 The percentage of children with cleft palates and/or lip was approximately 0.2%, with a slightly higher proportion of children with cleft lip.8 11 The most common reported dentofacial anomalies that required treatment were crowding (3.3-18.5%), maxillary overjet (2.8-5.1%), cross-bite (2.4-7.5%), reverse overjet anomaly (1%), deep overbite (0.9-5.4%), and open bite (0.5-1.9%). The prevalence of dentofacial anomalies was higher among 9-11-year-old children (13-38%) compared with 6-8-year-old children (6.7-34%).8 11 Among all the reported studies, only Wang et al33 used DHC IOTN (Dental Health Component of the Index of Orthodontic Treatment Need)34 to assess treatment need. The prevalence of malocclusion was estimated to be 88% and over a third (37%) of the study sample were deemed to have a ‘definite’ orthodontic treatment need and 33% had a moderate need.
 
Discussion
The introduction of water fluoridation in the 1960s resulted in improvements in dental caries in Hong Kong. Prior to its implementation, nearly all children in the population had dental caries, with a high mean number of decayed, missing, or filled teeth because of tooth decay (mean dmft of 9.2 and DMFT of 4.4).5 The implementation of water fluoridation in the community led to a gradual decline in the caries experience and severity in children, as confirmed by the first three oral epidemiological studies in Hong Kong.5 6 7 The caries experience remained constant (plateaued) with approximately 50% of preschool children and 20% to 40% of schoolchildren since 1980s/1990s having a dental caries experience. This indicates that children in Hong Kong are benefiting from the continual effects of water fluoridation as well as exposure to fluoride from other sources, together with changing living conditions, lifestyles, and improved oral self-care habits in recent decades. The stable caries prevalence in recent years signifies that dental caries in children is controlled to a certain degree, but still remains prevalent, however.
 
Despite great improvements in the oral health of Hong Kong children over the past 50 years, dental caries remains an oral health burden in the community, in particular among preschool children where prevalence and incidence remain high. Although caries prevalence and severity among preschool children declined during the first 30 years following water fluoridation, the prevalence remains similar and its extent/severity has been even higher in recent decades.16 17 19 20 This suggests that there remain some preschool children for whom the current measures alone (water fluoridation and oral health education) are insufficient to ensure optimal oral health.
 
The dental caries prevalence and severity in preschool children tended to rise with increasing age.4 19 20 From the epidemiological studies, it is thus common to find a higher percentage of caries experience in children at the upper end of the preschool age range. Moreover, caries experience is not uniformly distributed within populations of children. Children from disadvantaged and socially marginalised populations had a higher caries experience and severity.4 18 19 20 Preventive measures and oral health education should start earlier among younger children and their parents or caregivers. In particular, efforts should focus on the underprivileged population in our community.
 
The dental caries condition among Hong Kong schoolchildren (12 years old) is relatively good by international comparisons. Dental caries affects 60% to 90% of schoolchildren in most industrialised countries.35 36 The current dental caries experience in 12-year-old Hong Kong children is relatively very low.16 17 Of note, most of the dental caries experience was related to filled teeth, few (approximately 1 in 20) had untreated decay. This pattern can be largely attributed to the contribution of the SDCS, which began in the 1980s as a school-based dental care system that effectively overcomes many social barriers to dental care access by schoolchildren (eg family income, education, dental health awareness). Schoolchildren receive regular quality dental care and treatment through the SDCS. The observed low level of untreated dental caries among schoolchildren is in stark contrast to findings prior to the introduction of SDCS when most decay remained untreated or was treated by extraction.5 6 7 8 The SDCS has also raised awareness of oral health among schoolchildren. Education about the importance of oral health has likely changed children’s lifestyle and improved their self-care practice and use of fluoride oral health care products.
 
Dental attendance among primary schoolchildren is high because of high participation in the SDCS,37 but remains worryingly low among secondary school and preschool children. Many adolescents and their parents do not consider there to be a need for such care. Less than a third of such children reported regular attendance for dental check-ups, presumably because this group of children have to be seen privately to access dental care.10 13 16 17 18 19 20 Early and regular dental check-ups to enable preventive care should be advocated.
 
Conclusions
The introduction of a number of public health measures in Hong Kong, mainly water fluoridation and the SDCS, has improved the oral health of Hong Kong children over the past 50 years. There has been a decline in dental caries among schoolchildren and adolescents. Nonetheless, the dental caries experience has remained unchanged in recent decades for preschool children; even a slight increase in extent/severity has been observed. Although there is evidence of improvement, the overall periodontal health of Hong Kong children remains unsatisfactory. A decrease in the prevalence and severity of enamel defects among Hong Kong children was observed, but there has recently been a slight increase. In view of the limited data regarding malocclusion in Hong Kong children, epidemiological studies should be considered. The utilisation of dental services is low, especially among preschool children who are not covered by the SDCS. New policies to develop dental care protocols to ensure evidence-based standards of care, and to advocate regular access to dental care and preventive services may further improve the oral health of Hong Kong children.
 
References
1. Evans RW, Lo EC, Lind OP. Changes in dental health in Hong Kong after 25 years of water fluoridation. Community Dent Health 1987;4:383-94.
2. Chiu GK, Davies WI. The historical development of dentistry in Hong Kong. Hong Kong Med J 1998;4:73-6.
3. Hong Kong Department of Health. Health Statistics. Surveillance &amp Epidemiology Branch, Centre for Health Protection. Health facts of Hong Kong. Available from: http://www.dh.gov.hk/english/statistics/statistics_hs/files/Health_Statistics_pamphlet_E.pdf. Accessed Oct 2014.
4. Chu CH, Fung DS, Lo EC. Dental caries status of preschool children in Hong Kong. Br Dent J 1999;187:616-20. Crossref
5. Medical and Health Department. Report on the 1st (pre-fluoridation) dental survey of school children in Hong Kong. Medical and Health Department, Hong Kong; 1960.
6. Medical and Health Department. Report on the 2nd (post-fluoridation) dental survey of school children in Hong Kong. Medical and Health Department, Hong Kong; 1962.
7. Wong KK. Report of a dental survey in Hong Kong 1968. The Government Dental Service, Hong Kong and the World Health Organization; 1968.
8. Law YH. Dental health status of primary school children in Hong Kong. The Bulletin. Hong Kong Soc Community Med 1981;12:1-16.
9. King NM, Ling JY, Ng BV, Wei SH. The dental caries status and dental treatment patterns of 12-year-old children in Hong Kong. J Dent Res 1986;65:1371-4. Crossref
10. Lind OP, Evans RW, Holmgren CJ, Corbet EF, Lim LP, Davies WI. Hong Kong Survey of Adult Oral Health 1984. Hong Kong: Department of Periodontology and Public Health, Faculty of Dentistry, University of Hong Kong; 1986.
11. Wong PY. A report on a dental survey of primary school children in Hong Kong. Medical and Health Department, Hong Kong; 1987.
12. Lo EC, Evans RW, Lind OP. Dental caries status and treatment needs of the permanent dentition of 6-12-year-olds in Hong Kong. Community Dent Oral Epidemiol 1990;18:9-11. Crossref
13. Kwan EL. Oral health status of 13 and 15 year-old secondary school children in Hong Kong [dissertation]. Hong Kong: University of Hong Kong; 1992.
14. Yiu C, Wong MC, Chan M, et al. Oral health of 15-year-old secondary school students in H.K. Hong Kong: Faculty of Dentistry, University of Hong Kong; 2001.
15. Evans RW, Lo EC. Effects of School Dental Care Service in Hong Kong—primary teeth. Community Dent Oral Epidemiol 1992;20:193-5. Crossref
16. Hong Kong Department of Health. Oral health survey 2001: common dental diseases and oral health related behaviour. Hong Kong SAR: Dental Services Head Office, Department of Health; 2002.
17. Hong Kong Department of Health. Oral health survey 2011: common dental diseases and oral health related behaviour. Hong Kong SAR: Dental Services Head Office, Department of Health; 2012.
18. Wei SH, Holm AK, Tong LS, Yuen SW. Dental caries prevalence and related factors in 5-year-old children in Hong Kong. Pediatr Dent 1993;15:116-9.
19. Lo EC, Loo EK, Lee CK. Dental health status of Hong Kong preschool children. Hong Kong Dent J 2009;6:6-12.
20. Chu CH, Ho PL, Lo EC. Oral health status and behaviours of preschool children in Hong Kong. BMC Public Health 2012;12:767. Crossref
21. Ainamo J, Barmes D, Beagrie G, Cutress T, Martin J, Sardo-Infirri J. Development of the World Health Organization (WHO) community periodontal index of treatment needs (CPITN). Int Dent J 1982;32:281-91.
22. Wu D. Provision of outreach dental service and caries risk assessment to preschool children in Hong Kong [dissertation]. Hong Kong: University of Hong Kong; 2011.
23. Ainamo J, Bay I. Problems and proposals for recording gingivitis and plaque. Int Dent J 1975;25:229-35.
24. King NM. Developmental defects of enamel in Chinese girls and boys in Hong Kong. Adv Dent Res 1989;3:120-5.
25. Evans RW. Changes in dental fluorosis following an adjustment to the fluoride concentration of Hong Kong’s water supplies. Adv Dent Res 1989;3:154-60.
26. Evans RW, Stamm JW. Dental fluorosis following downward adjustment of fluoride in drinking water. J Public Health Dent 1991;51:91-8. Crossref
27. Wong HM, McGrath C, King NM. Diffuse opacities in 12-year-old Hong Kong children—four cross-sectional surveys. Community Dent Oral Epidemiol 2014;42:61-9. Crossref
28. Wong HM, McGrath C, Lo EC, King NM. Association between developmental defects of enamel and different concentrations of fluoride in the public water supply. Caries Res 2006;40:481-6. Crossref
29. Wong HM, Peng SM, Wen YF, King NM, McGrath CP. Risk factors of developmental defects of enamel—a prospective cohort study. PLoS One 2014;9:e109351. Crossref
30. A review of the developmental defects of enamel index (DDE Index). Commission on Oral Health, Research & Epidemiology. Report of an FDI Working Group. Int Dent J 1992;42:411-26.
31. Cho SY, Ki Y, Chu V. Molar incisor hypomineralization in Hong Kong Chinese children. Int J Paediatr Dent 2008;18:348-52. Crossref
32. Allwright WC, Burndred WH. A survey of handicapping dentofacial anomalies among Chinese in Hong Kong. Int Dent J 1964;14:505-19.
33. Wang G, Hägg U, Ling J. The orthodontic treatment need and demand of Hong Kong Chinese children. Chin J Dent Res 1999;2:84-92.
34. Brook PH, Shaw WC. The development of an index of orthodontic treatment priority. Eur J Orthod 1989;11:309-20.
35. Petersen PE, Bourgeois D, Ogawa H, Estupinan-Day S, Ndiaye C. The global burden of oral diseases and risks to oral health. Bull World Health Organ 2005;83:661-9.
36. Dye BA, Tan S, Smith V, et al. Trends in oral health status: United States, 1988-1994 and 1999-2004. Vital Health Stat 11 2007;(248):1-92.
37. King NM. Paediatric dentistry in Hong Kong. Int J Paediatr Dent 1998;8:1-2. Crossref

Magnetic resonance imaging of the fetal brain

Hong Kong Med J 2016 Jun;22(3):270–8 | Epub 22 Apr 2016
DOI: 10.12809/hkmj154678
© Hong Kong Academy of Medicine. CC BY-NC-ND 4.0
 
REVIEW ARTICLE
Magnetic resonance imaging of the fetal brain
Lawrence MF Tee, FHKCR, FHKAM (Radiology)1; Elaine YL Kan, FHKCR, FHKAM (Radiology)1; Joey CY Cheung, MHlthSc (MRS)1; WC Leung, MD, FRCOG2
1 Department of Diagnostic and Interventional Radiology, Kwong Wah Hospital, Yaumatei, Hong Kong
2 Department of Obstetrics and Gynaecology, Kwong Wah Hospital, Yaumatei, Hong Kong
 
Corresponding author: Dr Lawrence MF Tee (lmftee@gmail.com)
 
 Full paper in PDF
Abstract
Introduction: This review covers the recent literature on fetal brain magnetic resonance imaging, with emphasis on techniques, advances, common indications, and safety.
 
Methods: We conducted a search of MEDLINE for articles published after 2010. The search terms used were “(fetal OR foetal OR fetus OR foetus) AND (MR OR MRI OR [magnetic resonance]) AND (brain OR cerebral)”. Consensus statements from major authorities were also included. As a result, 44 relevant articles were included and formed the basis of this review.
 
Results: One major challenge is fetal motion that is largely overcome by ultra-fast sequences. Currently, single-shot fast spin-echo T2-weighted imaging remains the mainstay for motion resistance and anatomical delineation. Recently, a snap-shot inversion recovery sequence has enabled robust T1-weighted images to be obtained, which is previously a challenge for standard gradient-echo acquisitions. Fetal diffusion-weighted imaging, diffusion tensor imaging, and magnetic resonance spectroscopy are also being developed. With multiplanar capabilities, superior contrast resolution and field of view, magnetic resonance imaging does not have the limitations of sonography, and can provide additional important information. Common indications include ventriculomegaly, callosum and posterior fossa abnormalities, and twin complications. There are safety concerns about magnetic resonance–induced heating and acoustic damage but current literature showed no conclusive evidence of deleterious fetal effects. The American College of Radiology guideline states that pregnant patients can be accepted to undergo magnetic resonance imaging at any stage of pregnancy if risk-benefit ratio to patients warrants that the study be performed.
 
Conclusions: Magnetic resonance imaging of the fetal brain is a safe and powerful adjunct to sonography in prenatal diagnosis. It can provide additional information that aids clinical management, prognostication, and counselling.


Introduction
Fetal magnetic resonance (MR) imaging has been an invaluable adjunct to sonography in evaluation of the fetal brain since its introduction in the 1980s. In recent years, there has been an exponential growth in its clinical use, facilitated by technological advancements such as ultra-fast imaging sequences, diffusion-weighted imaging (DWI), and parallel imaging techniques. To date, sonography remains the mainstay modality in prenatal evaluation, owing to its low cost, abundant availability, and well-established literature support. Nonetheless, MR imaging has been shown to provide useful complementary information to sonography,1 2 and has a number of advantages over sonography, including superior contrast resolution, increased field of view (FOV), and the ability to image unhampered by an ossified calvarium, large maternal body habitus, or oligohydramnios.3 4 5 Currently, fetal MR imaging is most commonly used to confirm or characterise an abnormality that is suspected on sonography, or to screen fetuses at increased risk of neurodevelopmental disabilities.
 
In this article, we review the recent literature and developments in MR imaging of the fetal brain, with an emphasis on the safety, imaging techniques and protocols, and common clinical indications.
 
Methods
We performed a MEDLINE search for all the relevant scientific articles published in 2010 or later, using the keywords “(fetal OR foetal OR fetus OR foetus) AND (MR OR MRI OR [magnetic resonance]) AND (brain OR cerebral)”. All papers published in English and on human subjects were included. This yielded a total of 331 articles. These were then evaluated for their content and relevance to this review article, with case reports being excluded. Ultimately, 40 articles were deemed relevant and used as the literature basis of this review. In addition, four consensus statements and clinical guidelines from major authorities, including the American College of Radiology (ACR), the International Commission on Non-Ionizing Radiation Protection (ICNIRP), the Health and Safety Executive (HSE), and the American Academy of Pediatrics, were included. Relevant or important citations in the articles were also reviewed. With reference to the data from these articles, we describe the imaging techniques and recent developments, common clinical indications, and safety issues of MR imaging of the fetal brain.
 
Safety
Fetal imaging is a relatively new MR application. While it is generally believed to be a safe and noninvasive procedure,6 safety concerns have been raised regarding the possible or theoretical adverse effects related to the radiofrequency (RF) field and acoustic exposure.7 A number of animal studies have been performed to assess the safety of MR imaging in pregnant animals and animal fetuses, but there is a lack of consensus regarding the actual risks, if any.7 In addition, these studies were performed under various conditions and MR protocols, making it difficult to directly extrapolate the results to human fetal MR examination. Overall, most studies have shown no deleterious effects of MR imaging on the developing fetus.4 7 8 9
 
Radiofrequency-induced hyperthermia
Radiofrequency-induced hyperthermia is a potential hazard in MR imaging. During an MR examination, RF energy is converted to heat via Faraday’s law and is normally dissipated by blood flow. The amount of heat generated is a function of magnetic field strength, RF field, body size, tissue resistance, and scan time. Generally, pregnant women have a similar ability to maintain heat balance to non-pregnant women in a warm environment. Since the fetus does not possess the effective heat dissipation mechanisms of an adult, fetal temperature is dissipated via amniotic fluid and umbilical blood flow to the mother, and is thus coupled to maternal temperature, which is usually 0.5°C higher. Therefore, the fetus is considered to be more sensitive to hyperthermia. The 2004 ICNIRP report concludes that “Excessive heating is a potential teratogen; because of uncertainties in the RF dosimetry during pregnancy, it is recommended that exposure duration should be reduced to the minimum and that only the normal operation level is used”, and that “It seems reasonable to assume that adverse developmental effects will be avoided with a margin of safety if the body temperature of pregnant women does not rise by more than 0.5°C and the temperature of the fetus is less than 38°C”.10
 
Acoustic exposure
A characteristic of the switching gradient fields is the production of acoustic noise. When the alternating low-frequency currents flow through the gradient coils, which are immersed in the high static magnetic field B0, forces are exerted on the gradient coils that move like a loudspeaker coil and generate sound waves. Exposure to excessive loud noises can result in a reduced sensitivity of the hair cells in the organ of Corti and cause a temporary shift in the threshold of hearing. The impact depends on the sound pressure level (measured in A-weighted decibel, dB[A]) and duration of exposure. A sufficient injurious acoustic exposure can result in a permanent hearing loss; 85 dB(A) is the threshold for permanent hearing loss following long-term exposure. Thus, the ICNIRP recommends that hearing protection should be provided to patients when sound levels exceed 80 dB(A).10 It is unclear how these guidelines can be applied to the fetus, in whom the cochlea is developing, and the external auditory canal and middle ear cavity are fluid-filled instead of air-filled. Therefore, concerns have been raised regarding possible effects of acoustic exposure during fetal MR on the developing auditory system of the fetus, especially in echo-planar imaging that is the loudest sequence in current clinical use.
 
In the literature reviews published by HSE and American Academy of Pediatrics, most published studies were limited by their methodology and study design, and no conclusive evidence of acoustic damage was shown.11 12 A 3-year follow-up study of children who underwent fetal MR imaging showed no adverse long-term effect on hearing, although this was limited by the relatively small sample size.7 Compared with adult patients, the exact effect of acoustic noise on the fetus is difficult to ascertain, because there are a number of variables that could alter the effect, for instance, maternal body size, volume of amniotic fluid, MR sequences used, and duration of scanning. In a study by Glover et al,13 the authors aimed to simulate the in-utero acoustic environment by inserting a microphone into the fluid-filled stomach of a volunteer, and found a >30 dB attenuation in sound intensity. This provides some reassurance that a level close to the instantaneous damage threshold (120 dB[A]) could be reduced to an acceptable level (<90 dB[A]). Overall, the data from the current literature provide reassuring clinical and experimental evidence that suggests no significant risk of acoustic injury to the fetus during prenatal MR imaging.
 
Gadolinium contrast medium
Gadolinium is a pregnancy class C drug, and currently there are no documented indications for use of gadolinium contrast in fetal MR imaging.9 Gadolinium can pass through the placental barrier and enter the fetal circulation, with unknown and potentially harmful effects on the fetus. In animal studies, large doses of MR imaging gadolinium-based contrast agents have been shown to be associated with intrauterine death and congenital anomalies.7 The 2013 ACR guidance document on MR safe practices states that “MR contrast agents should not be routinely provided to pregnant patients”.14
 
Summary
The 2013 ACR guidance document on MR safe practices states that “Pregnant patients can be accepted to undergo MR scans at any stage of pregnancy if, in the determination of a level 2 MR personnel-designated attending radiologist, the risk-benefit ratio to the patient warrants that the study be performed”.14 While present data have not conclusively documented any deleterious effects of MR imaging exposure on the developing fetus, as a precaution, it is generally recommended to wait until the second trimester onwards before performing fetal MR imaging. This has the additional benefit of minimising the technical challenges due to the small size and excessive motion of younger fetuses.
 
Techniques and protocols
Coil selection
Fetal MR imaging is typically performed on a 1.5-tesla magnet. Currently, either multi-channel phased-array coils or cardiac surface coils are employed for fetal brain MR, with the coils placed directly over the fetal head.6 These coils generally lack mechanical design and flexibility, as maternal size is highly variable and is also dependent on the gestational age of the fetus. With the advent of parallel imaging techniques, the numbers of elements in phased-array coils have continuously increased to achieve a higher signal-to-noise ratio (SNR) and shorter scan times. More recently, the invention of the digital coil platform combined with multiple coil elements has further enhanced SNR beyond the capabilities of the adult eight-channel torso coil routinely used in fetal imaging.
 
Patient positioning
Patients are placed in a semi-decubitus position, rotating about 45° to the left side to avoid compression of the inferior vena cava and supported with foam pads to maximise comfort so as to minimise maternal and fetal movement. No maternal or fetal sedation is required.
 
Scout views
Scout images are obtained to localise the fetus and also serve as a general survey of the feto-placental unit. An initial localiser is obtained in three orthogonal planes with respect to the mother, using 6- to 8-mm thick slices with a 1- to 2-mm gap and a large FOV. The localiser is used to visualise the position of the fetus and determine fetal sidedness, as well as to ensure that the coil is centred over the fetal brain. At our centre, we use a gradient-echo scout localiser with a large FOV of 450 mm to cover the abdomen and pelvis of the mother, with a resolution of 1.76 x 1.76 x 10 mm3, and 20 slices in three orthogonal planes. A repeat localiser is then placed in the three orthogonal planes of the fetal brain. During the examination, each sequence also serves as a scout for the next. Due to fetal movement throughout the scanning process, repeating of scout localisers and repositioning of the coil are sometimes necessary. Therefore efforts should be made to keep the scanning time short.
 
Sequences
High image quality and resolution are crucial to accurate diagnosis; at the same time, a relatively short scan time is required to minimise the effects of fetal movement. Therefore, the choice of technical parameters should strike a balance between image quality and scan time (Table).
 

Table. Typical sequence parameters for fetal brain MR imaging at our centre (Achieva XR 1.5T; Philips Medical Systems, Best, Netherlands)
 
Single-shot fast spin-echo (SSFSE) T2-weighted imaging is regarded as the mainstay of fetal MRI.3 5 6 8 9 15 16 17 18 19 It provides excellent delineation of cerebral anatomy and requires a total acquisition time of <1 second per image. On our 1.5T MR scanner system (Achieva XR 1.5T; Philips Medical Systems, Best, Netherlands), SSFSE T2-weighted sequences in the axial, coronal, and sagittal plane of the fetal brain are acquired, with 25 slices in 35 seconds, resolution at 0.79 x 0.79 x 3.2 mm, 0.3 mm gap, long echo train length (ETL) of 227 and relatively short repetition time (TR) of 1450 ms, and use of the driven equilibrium pulse to enhance T2 contrast with a shorter TR.
 
Single-shot multiplanar T1-weighted turbo field-echo sequences are acquired to detect haemorrhage, fat, or calcification.3 5 6 8 9 Snap-shot inversion recovery, a dedicated optimised inversion-recovery-prepared SSFSE T1-weighted sequence, offers detailed delineation of normal fetal brain anatomy and myelination near term.20 At our centre, we use an inversion time of about 400 ms, resolution at 0.8 x 0.8 x 4 mm, 25 slices in 3 minutes 20 seconds, and single-shot mode with ETL of 230.
 
Diffusion-weighted imaging provides quantitative information about water motion and tissue microstructure, and can be used to identify focal areas of injury and delineate subtle anatomical structures and maturational changes.3 8 15 21 22 Other advanced techniques are also being developed and may provide functional and physiological information, including fetal MR spectroscopy, diffusion tensor imaging, and functional imaging,7 8 23 24 25 26 27 28 29 30 although their development is still at an early stage.
 
Indications
Fetal MR imaging is often performed to further evaluate a suspected abnormality detected on sonography. By providing additional information on the suspected abnormality and detecting associated cerebral abnormalities that are otherwise occult on sonography, fetal MR imaging can guide antenatal and perinatal management, as well as assist in the counselling of current and future pregnancies.5 31 32 33 34 It has also been shown to demonstrate a high diagnostic accuracy when compared with repeat or postnatal MR imaging.35 36 The most common clinical indications for fetal MR imaging will be discussed below.
 
Ventriculomegaly
Ventriculomegaly is one of the most common clinical indications for fetal MR imaging, mainly to detect other associated abnormalities that are occult on sonography. Ventriculomegaly is defined as atrial width of >10 mm on sonography, measured in the axial plane, at the level of the frontal horns and cavum septi pellucidi, at the level of the glomus of the choroid plexus, and perpendicular to the long axis of the lateral ventricle.3 5 6
 
Ventriculomegaly is a relatively common abnormality detected on prenatal sonography. It is a heterogeneous disease with various aetiologies that can be classified into developmental, destructive, and obstructive pathologies. An important prognostic factor is whether the ventriculomegaly is isolated, or with additional associated abnormalities.26 Studies have shown that up to 80% of fetuses with ventriculomegaly have other associated central nervous system (CNS) abnormalities, and is associated with poor postnatal neurological and developmental outcomes3 37 (Fig 1). These include agenesis of the corpus callosum, cortical malformation, periventricular nodular heterotopia, and destructive processes such as periventricular leukomalacia, porencephaly, and intra-ventricular and subependymal haemorrhage.3 6 37 On the other hand, the majority of fetuses with isolated mild ventriculomegaly show normal neurodevelopmental outcomes. Fetal MR imaging has been shown to have a high sensitivity and specificity for these brain abnormalities18 that may be occult and unidentified on sonography.25 34 38 39 40 These data highlight the role of fetal MR imaging in the prognostication of ventriculomegaly, and have significant implications on parental counselling and perinatal management.
 

Figure 1. A fetus with a history of borderline ventriculomegaly and suspected partial agenesis of corpus callosum on antenatal ultrasound at 35 gestational weeks
(a) An axial T2 image performed at 35 gestational weeks showing mild ventriculomegaly. There is no evidence of agenesis of corpus callosum. Neonatal magnetic resonance imaging performed at 1 month of age: (b) T1 inversion recovery sequence showing persistent mild ventriculomegaly with prominence of choroid plexuses (arrows), and (c) T1-weighted sequence with gadolinium revealing diffuse enhancement of the choroid plexuses (arrows); overall findings suggest diffuse villous hyperplasia of choroid plexus
 
Corpus callosum abnormalities
The corpus callosum is the main commissural pathway in the brain and comprises the rostrum, genu, body, and splenium. Beginning at 8 weeks of gestation, it develops from the lamina of His, with an apparent anteroposterior progression, starting from the genu, progressing posteriorly to the body and splenium, followed by the rostrum. By 15 to 20 weeks, the corpus callosum has assumed its final shape with fusion of all of its parts.6 Thus caution should be exercised when evaluating the corpus callosum before 20 weeks.
 
Abnormalities of the corpus callosum include agenesis, hypogenesis, dysgenesis, hypoplasia, and destruction. The precise incidence of corpus callosum abnormalities is difficult to ascertain because of selection bias in reported series. In a large population-based study looking at data from the California Birth Defect Monitoring Program,41 the authors identified 630 (0.019%) cases of agenesis or hypoplasia of the corpus callosum in 3.4 million live births. While agenesis of the corpus callosum can sometimes be seen in asymptomatic individuals, most patients exhibit variable neurological symptoms, including developmental delay, cognitive impairment, and epilepsy. There is also a high association with other CNS abnormalities such as sulcation abnormalities, Dandy-Walker malformation, Chiari II malformation, and grey matter heterotopia.3 6 9
 
On sonography, the corpus callosum is best visualised and evaluated on the mid-sagittal image, but obtaining an optimal mid-sagittal view can be challenging, especially at an advanced gestational age. We often rely on indirect signs including absence of cavum septum pellucidum, colpocephaly, high-riding third ventricle, and radiating gyri.3 6
 
Fetal MR imaging overcomes these challenges with its multiplanar capabilities and is able to demonstrate the corpus callosum in its entire length on the mid-sagittal image as a curvilinear C-shaped T2 hypointense structure at the superior margin of the cavum septum pellucidum and lateral ventricles.3 The indirect signs of callosal agenesis, similar to those on sonography, can also be depicted on the axial and coronal images3 6 (Fig 2). Studies have shown a higher sensitivity and specificity with fetal MR imaging compared with sonography.38 42
 

Figure 2. A fetus of 35 gestational weeks
(a) Midline sagittal T2, (b) coronal T2, and (c) axial T2 images demonstrating agenesis of corpus callosum, as evidenced by radiating gyri (arrow), absence of cavum septum pellucidum (asterisk), colpocephaly and high-riding third ventricle (arrowhead)
 
The prognosis of corpus callosum abnormalities is highly variable, depending not on the callosal abnormality itself, but largely on the associated abnormalities in the CNS and other systems, and have been found to be as common as 85% on autopsy.5 Fetal MR imaging has been shown to demonstrate additional but sonographically occult anomalies in up to 93% of cases of callosal abnormalities.5 9 Accurate detection of associated abnormalities has an important implication on the prognostication of the current pregnancy and the recurrence risk in future pregnancies.3 5
 
Complications of monochorionic twin pregnancies
While fetal MR imaging is commonly used for further evaluation of suspected sonographic abnormalities, there has been an increasing clinical use in the screening of high-risk cases.3 31 43 Fetal MR imaging is particularly useful in monochorionic twin pregnancies complicated by twin-twin transfusion syndrome or co-twin fetal demise where sonography of the brain is unrevealing.43 44
 
In twin-twin transfusion syndrome, there is imbalanced blood flow from the smaller donor twin to the larger recipient twin via abnormal intertwin vascular connections in the shared common monochorionic placenta. The donor twin develops oliguria and oligohydramnios from volume depletion, while the recipient twin develops polyuria and polyhydramnios from volume overload. High morbidity and mortality are observed, with both donor and recipient twins at a higher risk of cerebral ischaemia and haemorrhage, and neurodevelopmental and sonographic abnormalities.3 44 Although imaging the oligohydramniotic twin is usually straightforward, imaging the polyhydramniotic twin can be difficult owing to excessive fetal motion.
 
In co-twin fetal demise, an increased risk of neurological impairment is seen in the surviving co-twin (Fig 3). The likely mechanisms of cerebral injury are believed to involve an acute haemodynamic disturbance due to exsanguination of the surviving co-twin into the dead fetus just before or at the time of fetal demise, as well as thromboembolic events at the time of demise.3 43
 

Figure 3. A 23-week gestation fetus with co-twin demise
(a) Sagittal T2, (b) coronal T2, and (c) axial T2 images showing small demised twin (arrows) and surviving twin with normal intracranial appearance
 
Because of the high morbidity in these twin pregnancy complications, fetal MR imaging can be employed to look for cerebral injuries even when sonography appears normal, such as periventricular leukomalacia, encephalomalacia, germinal matrix haemorrhage, intra-ventricular haemorrhage, intraparenchymal haemorrhage, and cortical malformations. It has been found that one third of the surviving twins of co-twin fetal demise had abnormal cerebral findings on fetal MR imaging; most of which were occult sonographically.41 In addition, early manifestations of cerebral ischaemia were better diagnosed with MR imaging than sonography, especially DWI.3 43
 
Posterior cranial fossa abnormalities
Fetal MR imaging is useful in evaluating the posterior cranial fossa, utilising its ability to directly visualise the cerebellar hemisphere, vermis, and brainstem in three orthogonal planes, providing global assessment of the posterior fossa structures with morphologic and biometric analysis. It is also used to evaluate for supratentorial abnormalities that are commonly associated with various posterior fossa diseases, and can aid diagnosis and prognostication. Posterior fossa abnormalities that can be evaluated by fetal MR imaging include Dandy-Walker spectrum, cerebellar hypoplasia, cerebellar dysplasia, cerebellar haemorrhage, and Chiari malformation.5 6 9 45
 
Dandy-Walker malformation is characterised by agenesis or hypoplasia of the cerebellar vermis, in association with an enlarged posterior fossa, torcular-lambdoid inversion, and cystic dilatation of the fourth ventricle.5 6 9 While severe cases of Dandy-Walker malformation can be readily identified by sonography, distinguishing milder forms of vermian hypoplasia from a mega cisterna magna or an arachnoid cyst can be challenging (Figs 4 and 5). This is even more difficult in the third trimester where ossification of the skull can limit sonographic assessment of the posterior fossa structures. With its multiplanar capabilities, fetal MR imaging can better evaluate the morphology of the vermis, as well as the anatomical relationship between a retrocerebellar cyst and the fourth ventricle, which can help differentiate a Dandy-Walker variant from other entities such as a mega cisterna magna.5 25 In addition, fetal MR imaging is able to evaluate the supratentorial structures, because the Dandy-Walker spectrum is also associated with supratentorial abnormalities such as agenesis of corpus callosum, polymicrogyria, neuronal heterotopia, and occipital encephalocele,5 and is associated with a poorer clinical outcome. On the other hand, radiologists should also be aware of the limitations of fetal MR imaging. At younger gestational age (such as <20 weeks), fetal MR imaging may have a reduced specificity, particularly in the diagnosis of isolated inferior vermian hypoplasia.5 9 This may be related to small size, fetal motion, volume averaging, and difficulty in obtaining a true mid-sagittal image. Follow-up MR imaging, either at a later gestational age or postnatally, is recommended in such cases.46
 

Figure 4. A 23-week gestation fetus with a history of enlarged retrocerebellar space on ultrasound
(a) Sagittal midline T2, (b) coronal T2, and (c) axial T2 images confirm that although the transverse diameter of the cerebellum is marginally small for gestational age, the cerebellar vermis (asterisks) was intact
 

Figure 5. A 32-week gestation fetus: antenatal ultrasonography showing enlarged retrocerebellar space
(a) Sagittal T2 images at midline, (b) coronal T2 image, and (c) sagittal T2 image depicting an intact cerebellar vermis (asterisk) and a mega cisterna magna (arrow)
 
The cerebellar hemispheres can be evaluated on fetal MR imaging by assessing their size and morphology in multiple planes, in which normative data have been published for different gestational ages.3 Furthermore, DWI can provide quantitative information on the developing cerebellum that normally demonstrates a progressive decline in diffusivity and apparent diffusion coefficient values with increasing gestational age.
 
Fetal MR imaging is also helpful in evaluating echogenic posterior fossa masses. Haemorrhage is typically hyperintense on T1-weighted images, hypointense on T2-weighted images, with susceptibility artefact on gradient echo T2* images, although the signal intensity can vary depending on the age of the haemorrhage. In addition to confirming the diagnosis, fetal MR imaging can also better delineate the location of the haemorrhage, whether it is intra-axial or extra-axial which have different pathophysiology. The underlying causes of the cerebellar haemorrhage can be evaluated on MR imaging, such as germinal matrix haemorrhages, vascular malformations, and congenital infections.38
 
Conclusions
Magnetic resonance imaging is a safe and powerful adjunct to sonography in prenatal evaluation of the fetal brain. Facilitated by recent technological advancements, fetal MR imaging is being increasingly used in the clinical evaluation of cerebral abnormalities and screening of high-risk fetuses. It can provide additional useful information that can alter clinical management and aid in prognostication and counselling. Radiologists and clinicians involved in prenatal imaging and management should be aware of the application and limitations of the modalities available in fetal imaging, so as to optimise the multidisciplinary care for our patients.
 
Acknowledgement
The authors thank Professor Mary Rutherford, Centre for the Developing Brain, Perinatal Imaging & Health Imaging Sciences & Biomedical Engineering Division, King’s College London, St Thomas’ Hospital, London, United Kingdom.
 
References
1. Blondiaux E, Sileo C, Nahama-Allouche C, et al. Periventricular nodular heterotopia on prenatal ultrasound and magnetic resonance imaging. Ultrasound Obstet Gynecol 2013;42:149-55. Crossref
2. Blondiaux E, Garel C. Fetal cerebral imaging—ultrasound vs. MRI: an update. Acta Radiol 2013;54:1046-54. Crossref
3. Glenn OA. MR imaging of the fetal brain. Pediatr Radiol 2010;40:68-81. Crossref
4. Mirsky DM, Shekdar KV, Bilaniuk LT. Fetal MRI: head and neck. Magn Reson Imaging Clin N Am 2012;20:605-18. Crossref
5. Kline-Fath BM, Calvo-Garcia MA. Prenatal imaging of congenital malformations of the brain. Semin Ultrasound CT MR 2011;32:167-88. Crossref
6. Saleem SN. Fetal magnetic resonance imaging (MRI): a tool for a better understanding of normal and abnormal brain development. J Child Neurol 2013;28:890-908. Crossref
7. Bulas D, Egloff A. Benefits and risks of MRI in pregnancy. Semin Perinatol 2013;37:301-4. Crossref
8. Mailath-Pokorny M, Kasprian G, Mitter C, Schöpf V, Nemec U, Prayer D. Magnetic resonance methods in fetal neurology. Semin Fetal Neonatal Med 2012;17:278-84. Crossref
9. O’Connor SC, Rooks VJ, Smith AB. Magnetic resonance imaging of the fetal central nervous system, head, neck, and chest. Semin Ultrasound CT MR 2012;33:86-101. Crossref
10. International Commission on Non-Ionizing Radiation Protection. Medical magnetic resonance (MR) procedures: protection of patients. Health Phys 2004;87:197-216. Crossref
11. Health and Safety Executive. Non-auditory effects of noise at work: a critical review of the literature. Sudbury: HSE Books; 1999.
12. Noise: a hazard for the fetus and newborn. American Academy of Pediatrics. Committee on Environmental Health. Pediatrics 1997;100:724-7. Crossref
13. Glover P, Hykin J, Gowland P, Wright J, Johnson I, Mansfield P. An assessment of the intrauterine sound intensity level during obstetric echo-planar magnetic resonance imaging. Br J Radiol 1995;68:1090-4. Crossref
14. Expert Panel on MR Safety, Kanal E, Barkovich AJ, Bell C, et al. ACR guidance document on MR safe practices: 2013. J Magn Reson Imaging 2013;37:501-30. Crossref
15. Williams F, Griffiths PD. The diagnosis of hemimegalencephaly using in utero MRI. Clin Radiol 2014;69:e291-7. Crossref
16. Griffiths PD, Jarvis D, McQuillan H, Williams F, Paley M, Armitage P. MRI of the foetal brain using a rapid 3D steady-state sequence. Br J Radiol 2013;86:20130168. Crossref
17. Malamateniou C, Malik SJ, Counsell SJ, et al. Motion-compensation techniques in neonatal and fetal MR imaging. AJNR Am J Neuroradiol 2013;34:1124-36. Crossref
18. Glenn OA, Cuneo AA, Barkovich AJ, Hashemi Z, Bartha AI, Xu D. Malformations of cortical development: diagnostic accuracy of fetal MR imaging. Radiology 2012;263:843-55. Crossref
19. Shekdar K, Feygin T. Fetal neuroimaging. Neuroimaging Clin N Am 2011;21:677-703, ix. Crossref
20. Clouchoux C, Limperopoulos C. Novel applications of quantitative MRI for the fetal brain. Pediatr Radiol 2012;42 Suppl 1:S24-32. Crossref
21. Mignone Philpott C, Shannon P, Chitayat D, Ryan G, Raybaud CA, Blaser SI. Diffusion-weighted imaging of the cerebellum in the fetus with Chiari II malformation. AJNR Am J Neuroradiol 2013;34:1656-60. Crossref
22. Kasprian G, Del Río M, Prayer D. Fetal diffusion imaging: pearls and solutions. Top Magn Reson Imaging 2010;21:387-94. Crossref
23. Story L, Damodaram MS, Supramaniam V, et al. Myo-inositol metabolism in appropriately grown and growth-restricted fetuses: a proton magnetic resonance spectroscopy study. Eur J Obstet Gynecol Reprod Biol 2013;170:77-81. Crossref
24. Vasung L, Fischi-Gomez E, Huppi PS. Multimodality evaluation of the pediatric brain: DTI and its competitors. Pediatr Radiol 2013;43:60-8. Crossref
25. Girard NJ. Magnetic resonance imaging of fetal developmental anomalies. Top Magn Reson Imaging 2011;22:11-23. Crossref
26. Huisman TA. Fetal magnetic resonance imaging of the brain: is ventriculomegaly the tip of the syndromal iceberg? Semin Ultrasound CT MR 2011;32:491-509. Crossref
27. Story L, Damodaram MS, Allsop JM, et al. Brain metabolism in fetal intrauterine growth restriction: a proton magnetic resonance spectroscopy study. Am J Obstet Gynecol 2011;205:483.e1-8. Crossref
28. Meoded A, Poretti A, Tekes A, Flammang A, Pryde S, Huisman TA. Prenatal MR diffusion tractography in a fetus with complete corpus callosum agenesis. Neuropediatrics 2011;42:122-3. Crossref
29. Schöpf V, Kasprian G, Prayer D. Functional imaging in the fetus. Top Magn Reson Imaging 2011;22:113-8. Crossref
30. Story L, Damodaram MS, Allsop JM, et al. Proton magnetic resonance spectroscopy in the fetus. Eur J Obstet Gynecol Reprod Biol 2011;158:3-8. Crossref
31. Griffiths PD, Porteous M, Mason G, et al. The use of in utero MRI to supplement ultrasound in the foetus at high risk of developmental brain or spine abnormality. Br J Radiol 2012;85:e1038-45. Crossref
32. Doneda C, Parazzini C, Righini A, et al. Early cerebral lesions in cytomegalovirus infection: prenatal MR imaging. Radiology 2010;255:613-21. Crossref
33. Lipitz S, Hoffmann C, Feldman B, Tepperberg-Dikawa M, Schiff E, Weisz B. Value of prenatal ultrasound and magnetic resonance imaging in assessment of congenital primary cytomegalovirus infection. Ultrasound Obstet Gynecol 2010;36:709-17. Crossref
34. Griffiths PD, Reeves MJ, Morris JE, et al. A prospective study of fetuses with isolated ventriculomegaly investigated by antenatal sonography and in utero MR imaging. AJNR Am J Neuroradiol 2010;31:106-11. Crossref
35. Dhouib A, Blondiaux E, Moutard ML, et al. Correlation between pre- and postnatal cerebral magnetic resonance imaging. Ultrasound Obstet Gynecol 2011;38:170-8. Crossref
36. Griffiths PD, Morris JE, Mason G, et al. Fetuses with ventriculomegaly diagnosed in the second trimester of pregnancy by in utero MR imaging: what happens in the third trimester? AJNR Am J Neuroradiol 2011;32:474-80. Crossref
37. Mehrabi S, Adami A, Ventriglia A, Zantedeschi L, Franchi M, Manfredi R. Evolution of ventriculomegaly: comparison between foetal MR imaging and postnatal diagnostic imaging. Radiol Med 2013;118:1199-211. Crossref
38. Manganaro L, Bernardo S, La Barbera L, et al. Role of foetal MRI in the evaluation of ischaemic-haemorrhagic lesions of the foetal brain. J Perinat Med 2012;40:419-26. Crossref
39. Manfredi R, Tognolini A, Bruno C, Raffaelli R, Franchi M, Pozzi Mucelli R. Agenesis of the corpus callosum in fetuses with mild ventriculomegaly: role of MR imaging. Radiol Med 2010;115:301-12. Crossref
40. Yin S, Na Q, Chen J, Li-Ling J, Liu C. Contribution of MRI to detect further anomalies in fetal ventriculomegaly. Fetal Diagn Ther 2010;27:20-4. Crossref
41. Glass HC, Shaw GM, Ma C, Sherr EH. Agenesis of the corpus callosum in California 1983-2003: a population-based study. Am J Med Genet A 2008;146A:2495-500. Crossref
42. Griffiths PD, Russell SA, Mason G, Morris J, Fanou E, Reeves MJ. The use of in utero MR imaging to delineate developmental brain abnormalities in multifetal pregnancies. AJNR Am J Neuroradiol 2012;33:359-65. Crossref
43. Hoffmann C, Weisz B, Yinon Y, et al. Diffusion MRI findings in monochorionic twin pregnancies after intrauterine fetal death. AJNR Am J Neuroradiol 2013;34:212-6. Crossref
44. Tarui T, Khwaja OS, Estroff JA, Robinson JN, Gregas MC, Grant PE. Altered fetal cerebral and cerebellar development in twin-twin transfusion syndrome. AJNR Am J Neuroradiol 2012;33:1121-6. Crossref
45. Righini A, Parazzini C, Doneda C, et al. Fetal MRI features related to the Chiari malformations. Neurol Sci 2011;32 Suppl 3:S279-81. Crossref
46. Guibaud L, Larroque A, Ville D, et al. Prenatal diagnosis of ‘isolated’ Dandy-Walker malformation: imaging findings and prenatal counselling. Prenat Diagn 2012;32:185-93. Crossref

Common urological problems in children: prepuce, phimosis, and buried penis

Hong Kong Med J 2016 Jun;22(3):263–9 | Epub 6 May 2016
DOI: 10.12809/hkmj154645
© Hong Kong Academy of Medicine. CC BY-NC-ND 4.0
 
REVIEW ARTICLE    CME
Common urological problems in children: prepuce, phimosis, and buried penis
Ivy HY Chan, FRCSEd(Paed), FHKAM (Surgery); Kenneth KY Wong, PhD, FHKAM (Surgery)
Division of Paediatric Surgery, Department of Surgery, The University of Hong Kong, Queen Mary Hospital, Hong Kong
 
Corresponding author: Dr Kenneth KY Wong (kkywong@hku.hk)
 
 Full paper in PDF
Abstract
Parents often bring their children to the family doctor because of urological problems. Many general practitioners have received little training in this specialty. In this review, we aimed to provide a concise and informative review of common urological problems in children. This review will focus on the prepuce.
 
 
Introduction
Young boys are often brought by parents to see a medical practitioner for ‘phimosis’, and circumcision is one of the most commonly performed operations. Yet this topic is often not taught routinely in medical school. Buried penis is another less well-defined condition. In this review article, we will describe these conditions in a more systematic manner and present the current available knowledge about the conditions and management options.
 
Normal development of the prepuce and phimosis
Phimosis generally refers to a condition where the prepuce cannot be withdrawn to expose the glans. True phimosis, however, should be defined as a pathological condition in which the prepuce is scarred, non-retractile, and with a narrow preputial ring. This is secondary to balanitis xerotica obliterans (BXO). To avoid confusion of the terms, ‘physiological phimosis’ and ‘pathological phimosis’ should be used.
 
Physiological phimosis
Physiological phimosis is a natural condition in which the prepuce cannot be retracted and there is natural adhesion between the glans and the prepuce (Fig 1). Almost all normal male babies are born with a non-retractable foreskin. Indeed, Gairdner1 noticed only 4% of newborns in England and Wales had retractable foreskin. The foreskin becomes retractable as the child grows. The adhesion between the prepuce and glans will also separate gradually as a spontaneous biological process.2 3 4 By the age of 3 years, 90% of prepuces are retractable.1 Øster2 examined preputial development in 173 Danish boys aged 6 to 17 years annually for 7 years and determined that the foreskin was non-retractable in 8% of young boys but in only 1% at 17 years of age. Similar findings were noted in Chinese boys by Ko et al5 and Hsieh et al,6 who reported 84.1%5 and 58.1%6 of boys with a completely retractable prepuce by the age of 13 years. Both the retractability and the shape of the prepuce lie within a spectrum that can sometimes be difficult to describe and there is no agreed classification system. Different papers have used their own classifications for the purpose of study. One example was the study by Kayaba et al3 in which retractability was graded according to how much of the glans was visible after prepuce retraction.
 

Figure 1. Physiological phimosis
 
Pathological phimosis/balanitis xerotica obliterans
Balanitis xerotica obliterans is a chronic and progressive inflammatory condition that affects the prepuce, glans, and sometimes the urethra (Fig 2). It was first described in 1928 by Stühmer.7 There are three components of this condition: ‘balanitis’, meaning chronic inflammation of the glans penis; ‘xerotica’, an abnormally dry appearance of the lesion; and ‘obliterans’, for the association of occasional endarteritis.
 

Figure 2. Scarred preputial opening in a patient with balanitis xerotica obliterans
 
The aetiology and the true incidence is unknown. An incidence of 0.6% has been reported for boys affected by their 15th birthday.8 It is suspected clinically when there is a ring of hardened tissue with a whitish colour at the tip of the foreskin. There are also other clinical features such as white patches over the glans, perimeatal sclerotic changes, or meatal stenosis. It can cause urethral stricture and retention of urine.
 
Medical students are not taught about the condition and it is generally not diagnosed at the primary care level. Gargollo et al9 reviewed 41 patients with the pathologically confirmed diagnosis of BXO at their centre and confirmed that no patient had the diagnosis at referral. Pathology of the excised prepuce showed lymphocytic infiltration in the ripper dermis, hyalinosis and homogenisation of collagen, basal cell vacuolation, atrophy of the stratum malpighii, and hyperkeratosis.
 
Potential clinical problems
Parents often seek medical advice about their son’s ‘foreskin problems’. Pain, redness, itchiness, long prepuce, ballooning during urination, difficulty in retracting the prepuce, and penis being too short are the common complaints. Before answering all the questions, we should be able to differentiate the normal and abnormal.
 
Pain, pruritus, smegma
Most parents may think that the presence of pain or pruritus indicates infection of the prepuce, and yet poor prepuce hygiene is a more common problem. Smegma is another common complaint from parents, usually described as a ‘mass’, or ‘white pearl’. Smegma can be identified by gently retracting the prepuce (Fig 3). It is harmless and is a combination of secretions and desquamated skin.
 

Figure 3. Smegma seen after retracting the prepuce during circumcision
 
Difficulty in retracting the prepuce and long prepuce
Difficulty in retracting the prepuce and long prepuce is a feature of physiological phimosis. This is normal in most boys and requires no attention apart from daily routine prepuce hygiene. The role of the physician is to differentiate normal and abnormal prepuce, then guide proper management.
 
Ballooning
Ballooning is a feature of a tight prepuce. Because of the tight preputial opening, there is dilatation of the preputial sac during voiding. This causes a lot of parental anxiety about possible urinary outflow obstruction. Babu et al10 performed uroflow studies in boys with and without ballooning of the foreskin and determined that there was significant difference.
 
Balanoposthitis
This refers to inflammation of the glans (balanitis) and the foreskin (posthitis) [Fig 4]. Patients present with a swollen prepuce with or without discharge from the preputial opening. It is a relatively common condition, with a reported incidence of 6% in uncircumcised boys.11 In the absence of fever, underlying urinary tract infection (UTI) is unlikely. Simple bathing and rinsing with normal saline or chlorhexidine gluconate solution after urination is sufficient treatment for afebrile patients. Topical antibiotic cream is commonly prescribed for local infection. Serious conditions and presence of fever may warrant further investigations, oral antibiotics, or even hospital admission.
 

Figure 4. Balanoposthitis
 
Clinical management of phimosis
Prepuce hygiene and retraction
After diagnosing physiological phimosis, parents should be taught how to keep the prepuce clean. Only a small proportion of parents know what is required.12 Gentle daily retraction of the prepuce and rinsing of the prepuce with warm water can maintain good hygiene and prevent infection. Parents should also be taught to avoid forcible retraction of the prepuce.13 14 15 Simple stretching of the prepuce alone has been shown to be effective in achieving complete resolution of physiological phimosis.16 After 3 months of prepuce stretching, 76% of patients reported resolution of phimosis.16
 
Topical steroids
Topical steroids have been prescribed in the treatment of phimosis. Their anti-inflammatory, immunosuppressive, and skin-thinning properties are believed to be the mechanism for resolution of phimosis.17 Their use in physiological phimosis was first described by Kikiros et al.18 Subsequent studies showed the response rate for resolution of phimosis to be 68.2% to 95%.16 19 20 21 22 Moreno et al23 subsequently performed a meta-analysis and reviewed 12 randomised controlled trials on the use of different topical steroid formulations, and again confirmed the significant benefit of corticosteroids in the complete or partial clinical resolution of phimosis (risk ratio=2.45; 95% confidence interval, 1.84-3.26).
 
Parents often ask about the potential complications of topical steroid use. Golubovic et al24 and Pileggi et al25 addressed this issue by measuring serum cortisol levels and salivary cortisol levels, respectively. Neither could demonstrate a significant change in cortisol level after application of topical steroids. Topical steroid therapy is thus a safe and effective alternative to circumcision.
 
Circumcision
Circumcision is a procedure in which part of the foreskin is removed and results in a non-covered glans. It is a procedure that has been described for many years and is performed almost universally in Jewish and Muslim boys. The rate of newborn circumcision is high in the US (>50%),26 27 but routine circumcision is not a tradition in the Chinese population. Leung et al28 showed the circumcision rate in 6- to 12-year-old boys in Hong Kong to be 10.7%.
 
Benefits versus risks of circumcision
There is evidence that circumcision can reduce the risk of UTI, penile cancer, human immunodeficiency virus (HIV), and sexually transmitted disease (STD).
 
Urinary tract infection
Childhood UTI is associated with renal scarring. The symptoms and signs of UTI are often non-specific in young children who may present with fever alone. The overall prevalence of UTI in children with fever (<19 years old) was reported to be 7.8% in a meta-analysis published in 2008.29 The pooled prevalence of febrile UTI in male infants from 0 to 24 months of age was 8.0% (confidence interval, 5.5-10.4%). Circumcised boys had a lower risk of developing UTI—20.1% in uncircumcised versus 2.4% in circumcised infants of less than 3 months of age with fever.29
 
Another systematic review in 2005 showed a decreased risk of UTI in circumcised boys.30 The authors calculated the number-needed-to-treat was 111 in normal boys, but the number-needed-to-treat for recurrent UTI and high-grade vesicoureteric reflux was 11 and 4, respectively. It was evident that the benefits of circumcision were higher for boys at risk of UTI.
 
Sexually transmitted infection and human immunodeficiency virus
Three randomised controlled trials concluded that adult circumcision had a protective effect against acquisition of HIV.31 32 33 Although the full mechanism of protection was not fully understood, it was shown that the inner foreskin harbours epithelial CD4+ CCR5+ cells and has features of an inflamed epidermal barrier. These changes may support a subclinical inflammatory state in uncircumcised men, with availability of target cells for HIV infection, and potentially account for the benefits of circumcision in STD prevention.34 All the trials were performed in Africa, with a much higher prevalence of HIV. Education about use of condoms and safe sex practice was relatively primitive compared with Hong Kong. Readers should therefore interpret these results with caution when discussing the benefits of circumcision on HIV prevention with our patients.
 
A meta-analysis published in 2006 by Weiss et al35 showed that circumcised males were at a lower risk of syphilis, and there was a lower association with herpes simplex virus (HSV) type 2. Other cohorts also showed similar findings, with circumcised males having a decreased risk of syphilis, gonorrhoea, and human papillomavirus (HPV).36 37 38 39 On the contrary, another systematic review by Van Howe40 showed that most STDs are not impacted significantly by circumcision status. They included chlamydia, gonorrhoea, HSV, and HPV. Despite the positive findings in some studies, it should be remembered that the use of a condom and safe sex are the most important deterrents. The protective effect of circumcision might give a false sense of security and should not be advocated over other preventive measures.
 
Risks and complications of circumcision
Circumcision is one of the most commonly performed operations in the world and involves excision of a ring of preputial tissue. In general, the procedure may involve the use of a special device (eg Plastibell, Gomco clamp, Mogen clamp, Shang ring) or may apply the ‘free hand excision method’. Depending on the method, suturing may or may not be involved. Every procedure is associated with risks and complications. The rate is different depending on the operator (ritual circumciser or surgeon) and the setting (home, clinic, or hospital).
 
There has been inadequate comparison of the complication rates of ‘device method’ surgery and the ‘free hand excision method’ so it is difficult for the authors to recommend a single best method for surgical circumcision. The overall complication rate of circumcision varies from 0.5%41 to 8%.42 As the indication for circumcision in some patients is not medical (eg religious or ritual circumcision), the risks should be carefully explained to the patient before the procedure.
 
Early complications include bleeding, wound infection, and UTI. Bleeding is one of the most common postoperative complications that, in extreme cases, may lead to shock.43 Meticulous technique during the procedure is thus important. If bleeding is encountered postoperatively, it can usually be controlled by local compression or bedside plication.
 
In a UK study, the infection rate after circumcision has been reported to be around 0.3%.44 It is usually minor and can be treated by simple irrigation with antiseptic solution. Systemic antibiotics are rarely needed. A systematic review of the prevalence and complications of circumcision was performed in eastern and southern Africa.45 The infection rate was very high and two thirds of patients presented with systemic infection requiring antibiotics. The authors believe the quality of local wound care is very important in minimising the infection rate. Urinary retention is uncommon after circumcision but can occur in up to 3.6% of cases. It is likely to be pain-related or due to improper placement of a circumcision device, eg Plastibell.46
 
Wound dehiscence may occur and can be managed with wound care and dressing. Very rarely, excessive prepuce loss as a result of excessive skin excision may be seen. This potentially disastrous complication has been reported to be treated with a full-thickness skin graft.47
 
Late complications are not uncommon, reported by one study to be present in 4.7% of newborn circumcisions.48 Redundant residual skin and recurrent penile adhesion are the two most common late complications that may necessitate revision circumcision. Meatal stenosis is another late but uncommon complication after circumcision and requires surgery. The cause is not known but it is more common in patients with BXO.49 50
 
There are some other less-common but severe complications, including urethrocutaneous fistula, glans amputation, and iatrogenic buried penis.51 52 These have long-term physiological and psychological consequences for both the patient and family. Surgical technique and the surgeon’s awareness of limitations of each method of circumcision is important. Parents should be fully informed before they make a decision about circumcision, especially where the patient is physically weak or where there is no medical indication for the procedure.
 
Current guidelines on circumcision
Various international colleges have produced guidelines on circumcision. These include the British Association of Paediatric Surgeons,53 the Royal Australasian College of Physicians,54 and the American Academy of Pediatrics.55 56
 
Having taken all these into account, the overall view of our unit is as follows:
(1) Although there is some scientific evidence for the benefits of circumcision, the routine use on all males is not justified. Parents should be fully informed of all the potential benefits and risks of the procedure.
(2) Our current medical indications for circumcision are:
(a) penile malignancy (though this is extremely rare in children) or traumatic foreskin injury where it cannot be salvaged; and
(b) BXO, severe recurrent attacks of balanoposthitis, and/or recurrent febrile UTIs.
(3) Non-therapeutic ‘ritual’ circumcision may be offered.
 
Buried penis
Buried penis is a condition where the penis is ‘trapped’ or ‘concealed’ under the suprapubic area. There is an apparent absence or partial absence of the penis. Figure 5 shows partial buried penis in an 8-year-old boy. The condition was described as ‘complete’ or ‘partial’ by Crawford57 in 1977. In the partial type, the proximal half of the penile shaft is buried in the subcutaneous tissue. For the complete type, the phallus is completely invisible and the glans is covered only by prepuce. Maizels et al58 further elaborated in 1986, offering new classifications as ‘buried penis’ (patients with redundant suprapubic fat and/or lack of penile skin anchoring to deep fascia), ‘webbed penis’ (scrotal skin webs the penoscrotal angle to obscure the penis), ‘trapped penis’ (the shaft of the penis is entrapped in the scarred, prepubic skin following trauma/overzealous circumcision), ‘micro-penis’ (a normally formed penis that is less than two standard deviations below the mean size in the stretched length), and ‘diminutive penis’ (a penis that is small and/or malformed as a consequence of epispadias/exstrophy, severe hypospadias, disorder of sexual differentiation, or chromosomal anomalies). O’Brien et al59 described another condition called ‘congenital megaprepuce’ in 1994 that includes a phimotic ring and large preputial sac. Despite these studies, buried penis is still not a well-defined or well-classified entity. It can be congenital or iatrogenic after overzealous circumcision. Clinicians are reminded to examine the penis carefully and the exact penile length should be a properly performed ‘stretched penile length’. When there is uncertainty about the exact diagnosis, early specialist advice is advocated.
 

Figure 5. (a) A patient with buried penis and apparent short penis, and (b) the same patient after stretching the prepuce. The actual length of penis is concealed by the suprapubic fat in this patient
 
Clinical problems
For congenital problems, anxious parents usually seek medical advice because they feel that their child’s penis is too short. Other problems include local infection, urinary retention, inability to void standing, chronic urinary dripping, and undirected voiding. For older children, there may be pain during erection or disturbed vaginal penetration.60 61 62
 
Management
Anatomically, buried penis is usually due to insufficient outer prepuce and lack of attachment between the penile Buck’s fascia and the pubis.63 Numerous corrective surgical techniques have been described. The underlying principle is the degloving of the penis, anchoring of Buck’s fascia to the pubis, and preputioplasty (pedicled preputial flap, Z-plasty of the prepuce, lipectomy, and skin graft) [Fig 6].64 65
 

Figure 6. Appearance after preputioplasty for buried penis
 
A study on the comparison of quality of life before and after surgery showed significant improvement in sexual pleasure, urination difficulties, and genital hygiene.66 King et al61 also reported that all patients were happy with the aesthetic results.
 
Conclusions
It is essential to recognise the features of physiological versus pathological phimosis. Physiological phimosis (tightness of prepuce), preputial adhesion, and smegma are common and normal in young boys, and do not require surgical intervention. There are potential benefits and complications of circumcision that should be thoroughly appreciated by physicians before discussion with parents or patient. Medical indications for circumcision include penile malignancy, traumatic foreskin injury, recurrent attacks of severe balanoposthitis, and recurrent febrile UTIs with abnormal urinary tract. Very few international societies support routine circumcision despite the potential medical benefits incurred. Buried penis is a condition that may warrant surgery.
 
References
1. Gairdner D. The fate of the foreskin, a study of circumcision. Br Med J 1949;2:1433-7. Crossref
2. Øster J. Further fate of the foreskin. Incidence of preputial adhesions, phimosis, and smegma among Danish schoolboys. Arch Dis Child 1968;43:200-3. Crossref
3. Kayaba H, Tamura H, Kitajima S, Fujiwara Y, Kato T, Kato T. Analysis of shape and retractability of the prepuce in 603 Japanese boys. J Urol 1996;156:1813-5. Crossref
4. Rickwood AM. Medical indications for circumcision. BJU Int 1999;83 Suppl 1:45-51. Crossref
5. Ko MC, Liu CK, Lee WK, Jeng HS, Chiang HS, Li CY. Age-specific prevalence rates of phimosis and circumcision in Taiwanese boys. J Formos Med Assoc 2007;106:302-7. Crossref
6. Hsieh TF, Chang CH, Chang SS. Foreskin development before adolescence in 2149 schoolboys. Int J Urol 2006;13:968-70. Crossref
7. Stühmer A. Balanitis xerotica obliterans (post operationem) und ihre Beziehungenzur ‘Kraurosis glandi et praeputii penis’ [in German]. Arch Dermatol Syph (Berlin) 1928;156:613. Crossref
8. Shankar KR, Rickwood AM. The incidence of phimosis in boys. BJU Int 1999;84:101-2. Crossref
9. Gargollo PC, Kozakewich HP, Bauer SB, et al. Balanitis xerotica obliterans in boys. J Urol 2005;174:1409-12. Crossref
10. Babu R, Harrison SK, Hutton KA. Ballooning of the foreskin and physiological phimosis: is there any objective evidence of obstructed voiding? BJU Int 2004;94:384-7. Crossref
11. Herzog LW, Alvarez SR. The frequency of foreskin problems in uncircumcised children. Am J Dis Child 1986;140:254-6. Crossref
12. Osborn LM, Metcalf TJ, Mariani EM. Hygienic care in uncircumcised infants. Pediatrics 1981;67:365-7.
13. Camille CJ, Kuo RL, Wiener JS. Caring for the uncircumcised penis: what parents (and you) need to know. Contemp Pediatr 2002;11:61.
14. Simpson ET, Barraclough P. The management of the paediatric foreskin. Aust Fam Physician 1998;27:381-3.
15. Rickwood AM, Hemalatha V, Batcup G, Spitz L. Phimosis in boys. Br J Urol 1980;52:147-50. Crossref
16. Zampieri N, Corroppolo M, Camoglio FS, Giacomello L, Ottolenghi A. Phimosis: stretching methods with or without application of topical steroids? J Pediatr 2005;147:705-6. Crossref
17. Kragballe K. Topical corticosteroids: mechanisms of action. Acta Derm Venereol Suppl (Stockh) 1989;151:7-10; discussion 47-52.
18. Kikiros CS, Beasley SW, Woodward AA. The response of phimosis to local steroid application. Pediatr Surg Int 1993;8:329-32. Crossref
19. Lee CH, Lee SD. Effect of topical steroid (0.05% clobetasol propionate) treatment in children with severe phimosis. Korean J Urol 2013;54:624-30. Crossref
20. Chu CC, Chen KC, Diau GY. Topical steroid treatment of phimosis in boys. J Urol 1999;162:861-3. Crossref
21. Orsola A, Caffaratti J, Garat JM. Conservative treatment of phimosis in children using a topical steroid. Urology 2000;56:307-10. Crossref
22. Ghysel C, Vander Eeckt K, Bogaert GA. Long-term efficiency of skin stretching and a topical corticoid cream application for unretractable foreskin and phimosis in prepubertal boys. Urol Int 2009;82:81-8. Crossref
23. Moreno G, Corbalán J, Peñaloza B, Pantoja T. Topical corticosteroids for treating phimosis in boys. Cochrane Database Syst Rev 2014;(9):CD008973. Crossref
24. Golubovic Z, Milanovic D, Vukadinovic V, Rakic I, Perovic S. The conservative treatment of phimosis in boys. Br J Urol 1996;78:786-8. Crossref
25. Pileggi FO, Martinelli CE Jr, Tazima MF, Daneluzzi JC, Vicente YA. Is suppression of hypothalamic-pituitary-adrenal axis significant during clinical treatment of phimosis? J Urol 2010;183:2327-31. Crossref
26. Centers for Disease Control and Prevention (CDC). Trends in in-hospital newborn male circumcision—United States, 1999-2010. MMWR Morb Mortal Wkly Rep 2011;60:1167-8.
27. Warner L, Cox S, Kuklina E, et al. Updated trends in the incidence of circumcision among male newborn delivery hospitalizations in the United States, 2000-2008. Proceedings of the National HIV Prevention Conference; 2011 Aug 26; Atlanta, Georgia, US.
28. Leung MW, Tang PM, Chao NS, Liu KK. Hong Kong Chinese parents’ attitudes towards circumcision. Hong Kong Med J 2012;18:496-501.
29. Shaikh N, Morone NE, Bost JE, Farrell MH. Prevalence of urinary tract infection in childhood: a meta-analysis. Pediatr Infect Dis J 2008;27:302-8. Crossref
30. Singh-Grewal D, Macdessi J, Craig J. Circumcision for the prevention of urinary tract infection in boys: a systematic review of randomised trials and observational studies. Arch Dis Child 2005;90:853-8. Crossref
31. Gray RH, Kigozi G, Serwadda D, et al. Male circumcision for HIV prevention in men in Rakai, Uganda: a randomised trial. Lancet 2007;369:657-66. Crossref
32. Bailey RC, Moses S, Parker CB, et al. Male circumcision for HIV prevention in young men in Kisumu, Kenya: a randomised controlled trial. Lancet 2007;369:643-56. Crossref
33. Auvert B, Taljaard D, Lagarde E, Sobngwi-Tambekou J, Sitta R, Puren A. Randomized, controlled intervention trial of male circumcision for reduction of HIV infection risk: the ANRS 1265 Trial. PLoS Med 2005;2:e298. Crossref
34. Lemos MP, Lama JR, Karuna ST, et al. The inner foreskin of healthy males at risk of HIV infection harbors epithelial CD4+ CCR5+ cells and has features of an inflamed epidermal barrier. PLoS One 2014;9:e108954. Crossref
35. Weiss HA, Thomas SL, Munabi SK, Hayes RJ. Male circumcision and risk of syphilis, chancroid, and genital herpes: a systematic review and meta-analysis. Sex Transm Infect 2006;82:101-9; discussion 110. Crossref
36. Diseker RA 3rd, Peterman TA, Kamb ML, et al. Circumcision and STD in the United States: cross sectional and cohort analyses. Sex Transm Infect 2000;76:474-9. Crossref
37. Albero G, Castellsagué X, Giuliano AR, Bosch FX. Male circumcision and genital human papillomavirus: a systematic review and meta-analysis. Sex Transm Dis 2012;39:104-13. Crossref
38. Tobian AA, Serwadda D, Quinn TC, et al. Male circumcision for the prevention of HSV-2 and HPV infections and syphilis. N Engl J Med 2009;360:1298-309. Crossref
39. Turner AN, Morrison CS, Padian NS, et al. Male circumcision and women’s risk of incident chlamydial, gonococcal, and trichomonal infections. Sex Transm Dis 2008;35:689-95. Crossref
40. Van Howe RS. Sexually transmitted infections and male circumcision: a systematic review and meta-analysis. ISRN Urol 2013;2013:109846. Crossref
41. El Bcheraoui C, Zhang X, Cooper CS, Rose CE, Kilmarx PH, Chen RT. Rates of adverse events associated with male circumcision in U.S. medical settings, 2001 to 2010. JAMA Pediatr 2014;168:625-34. Crossref
42. Weiss HA, Larke N, Halperin D, Schenker I. Complications of circumcision in male neonates, infants and children: a systematic review. BMC Urol 2010;10:2. Crossref
43. Bocquet N, Chappuy H, Lortat-Jacob S, Chéron G. Bleeding complications after ritual circumcision: about six children. Eur J Pediatr 2010;169:359-62. Crossref
44. Cathcart P, Nuttall M, van der Meulen J, Emberton M, Kenny SE. Trends in paediatric circumcision and its complications in England between 1997 and 2003. Br J Surg 2006;93:885-90. Crossref
45. Wilcken A, Keil T, Dick B. Traditional male circumcision in eastern and southern Africa: a systematic review of prevalence and complications. Bull World Health Organ 2010;88:907-14. Crossref
46. Mihssin N, Moorthy K, Houghton PW. Retention of urine: an unusual complication of the Plastibell device. BJU Int 1999;84:745. Crossref
47. Özdemir E. Significantly increased complication risks with mass circumcisions. Br J Urol 1997;80:136-9. Crossref
48. Patel HI, Moriarty KP, Brisson PA, Feins NR. Genitourinary injuries in the newborn. J Pediatr Surg 2001;36:235-9. Crossref
49. Pieretti RV, Goldenstein AM, Pieretti-Vanmarcke R. Late complications of newborn circumcision: a common and avoidable problem. Pediatr Surg Int 2010;26:515-8. Crossref
50. Homer L, Buchanan KJ, Nasr B, Losty PD, Corbett HJ. Meatal stenosis in boys following circumcision for lichen sclerosus (balanitis xerotica obliterans). J Urol 2014;192:1784-8. Crossref
51. Ceylan K, Burhan K, Yilmaz Y, Can S, Kuş A, Mustafa G. Severe complications of circumcision: an analysis of 48 cases. J Pediatr Urol 2007;3:32-5. Crossref
52. Ince B, Gundeslioglu AO. A salvage operation for total penis amputation due to circumcision. Arch Plast Surg 2013;40:247-50. Crossref
53. Management of foreskin conditions. British Association of Paediatric Surgeons. Available from: http://www.baps.org.uk/resources/documents/management-foreskin-conditions/. Accessed Jun 2015.
54. The Royal Australasian College of Physicians. Circumcision of infant males. 2010. Available from: https://www.racp.edu.au/docs/default-source/advocacy-library/circumcision-of-infant-males.pdf. Accessed Jun 2015.
55. American Academy of Pediatrics Task Force on Circumcision. Circumcision policy statement. Pediatrics 2012;130:585-6. Crossref
56. American Academy of Pediatrics Task Force on Circumcision. Male circumcision. Pediatrics 2012;130:e756-85. Crossref
57. Crawford BS. Buried penis. Br J Plast Surg 1977;30:96-9. Crossref
58. Maizels M, Zaontz M, Donovan J, Bushnick PN, Firlit CF. Surgical correction of the buried penis: description of a classification system and a technique to correct the disorder. J Urol 1986;136:268-71.
59. O’Brien A, Shapiro AM, Frank JD. Phimosis or congenital megaprepuce? Br J Urol 1994;73:719-20. Crossref
60. Mattsson B, Vollmer C, Schwab C, et al. Complications of a buried penis in an extremely obese patient. Andrologia 2012;44 Suppl 1:826-8. Crossref
61. King IC, Tahir A, Ramanathan C, Siddiqui H. Buried penis: evaluation of outcomes in children and adults, modification of a unified treatment algorithm, and review of the literature. ISRN Urol 2013;2013:109349. Crossref
62. Donatucci CF, Ritter EF. Management of the buried penis in adults. J Urol 1998;159:420-4. Crossref
63. Chin TW, Tsai HL, Liu CS. Modified prepuce unfurling for buried penis: a report of 12 years of experience. Asian J Surg 2015;38:74-8. Crossref
64. Liu X, He DW, Hua Y, Zhang DY, Wei GH. Congenital completely buried penis in boys: anatomical basis and surgical technique. BJU Int 2013;112:271-5. Crossref
65. Chu CC, Chen YH, Diau GY, Loh IW, Chen KC. Preputial flaps to correct buried penis. Pediatr Surg Int 2007;23:1119-21. Crossref
66. Hughes DB, Perez E, Garcia RM, Aragón OR, Erdmann D. Sexual and overall quality of life improvements after surgical correction of “buried penis”. Ann Plast Surg 2016;76:532-5. Crossref

A new paradigm of genetic testing for hereditary breast/ovarian cancers

Hong Kong Med J 2016 Apr;22(2):171–7 | Epub 14 Mar 2016
DOI: 10.12809/hkmj154634
© Hong Kong Academy of Medicine. CC BY-NC-ND 4.0
 
REVIEW ARTICLE    CME
A new paradigm of genetic testing for hereditary breast/ovarian cancers
Ava Kwong, FRCS (Edin), PhD; JW Chen, PhD; Vivian Y Shin, PhD
Breast Surgery Division, The University of Hong Kong, Pokfulam, Hong Kong
 
Corresponding author: Dr Ava Kwong (akwong@asiabreastregistry.com)
 
 Full paper in PDF
Abstract
Introduction: Genetic risk factors and family history play an important role in breast cancer development. This review aimed to summarise the current genetic testing approach to hereditary breast/ovarian cancer.
 
Methods: A systematic literature review was performed by searching the PubMed database. Publications available online until January 2015 that addressed issues related to hereditary breast/ovarian cancer genetic counselling/testing were selected. The search terms used were “familial breast/ovarian cancer”, “susceptibility genes”, “genetic counselling”, and “genetic testing”. The data extracted for this review were analysed by the authors, with a focus on genetic testing for hereditary breast/ovarian cancer.
 
Results: Although a greater proportion of inherited breast/ovarian cancers are due to the BRCA1 and BRCA2 mutations, a number of new genes have emerged as susceptibility candidates, including rare germline mutations in high penetrance genes, such as TP53 and PTEN, and more frequent mutations in moderate/low penetrance genes, such as PALB2, CHEK2 and ATM. Multi-gene testing, if used appropriately, is generally a more cost- and time-effective method than single-gene testing, and may increase the number of patients who can be offered personal surveillance, risk-reduction options, and testing of high-risk family members.
 
Conclusions: Recent advances in molecular genetics testing have identified a number of susceptibility genes related to hereditary breast and/or ovarian cancers other than BRCA1 and BRCA2. The introduction of multi-gene testing for hereditary cancer has revolutionised the clinical management of high-risk patients and their families. Individuals with hereditary breast/ovarian cancer will benefit from genetic counselling/testing.
 
 
Introduction
Breast cancer is one of the most common cancers and the second most common leading cause of cancer-related death among women with 1.67 million new cases diagnosed in 2012 (25% of all cancers).1 About 39% of these new cases are found in Asia.1 In the US, women have a 12% lifetime risk of developing breast cancer including women of young age. In addition, approximately 1 in 250 women in their 30s will develop breast cancer in the next 10 years.2 Assessment of an individual’s risk for breast cancer is complex, and based on different aspects such as personal lifestyle, environmental exposure, reproductive influences, and drug use. Genetic risk factors and family history, however, also play important roles in breast cancer development. Only 5% to 10% of breast cancer cases are characterised as hereditary and follow the autosomal dominant pattern of transmission.3 On the other hand, 15% to 20% of breast cancer cases are familial, referring to women who have two or more first- or second-degree relatives with the disease.4 5 6 Hereditary cancers follow a Mendelian inheritance pattern and tend to have an earlier age of onset. Familial cancers do not follow a specific inheritance pattern. Defects in the BRCA1 and BRCA2 genes are the most well-known high-risk factors among inherited breast cancers. Results from genome-wide association studies have broadened our knowledge over the last few years about the specific genes that contribute to familial breast cancer. Other genes such as TP53 and PTEN have also been identified to be associated with an increased risk of breast cancer.7 High-risk women are likely to benefit from genetic testing as there are now emerging targeted therapies and interventions that have been shown to improve outcome in mutation carriers.
 
Methods
A search of the medical literature was performed to identify the relevant studies and reviews on genetic testing for hereditary breast/ovarian cancer. The PubMed database was searched for publications available online until January 2015 that address the related issues; “familial breast/ovarian cancer”, “susceptibility genes”, “genetic counselling”, and “genetic testing” were used as the search terms.
 
High-penetrance genes
BRCA1 and BRCA2
Hereditary breast and ovarian cancer syndrome (HBOC) refers to a germline mutation in either the BRCA1 or BRCA2 gene, and individuals who carry a mutation have an increased risk of developing cancers. BRCA1 and BRCA2 are tumour-suppressor genes that code for proteins that help repair damaged DNA and therefore play vital roles in securing the stability of the cell’s genetic material. Defects in these two genes may result in protein with malfunction, thus DNA damage may not be repaired properly. As a result, cells are prone to develop genetic mutations leading to cancer development. Scientists discovered in the 1990s that BRCA1 and BRCA2 are breast cancer susceptibility genes.8 9 Women have a 57% to 60% and 49% to 55% lifetime risk of developing breast cancer if they carry a BRCA1 or BRCA2 mutation, respectively.10 11 Women with mutations in the BRCA1 cancer susceptibility gene associated with HBOC have a 39% to 46% risk of developing ovarian cancer by the age of 70 years while approximately 10% to 27% BRCA2-positive women are at risk.12 13 14 The result of genetic testing for the BRCA mutation is important to decisions made about management of breast cancer. For example, a woman diagnosed with breast cancer and who harbours the BRCA1 or BRCA2 mutation has a greater risk of developing a second breast cancer in the contralateral breast, and this risk is age-related. Women diagnosed with breast cancer at a younger age have a higher risk of developing contralateral malignancy compared with those diagnosed at an older age.15 BRCA1 mutation carriers tend to have more triple-negative breast cancer (TNBC), medullary histopathology, somatic TP53 mutations, higher histological grade, and present at a younger age compared with women with sporadic breast cancers. Basal markers such as cytokeratin (CK14, CK5/6, CK17), osteonectin, and EGFR are more commonly expressed in BRCA1-positive tumours than in control tumours unselected for mutation status.16 17 18 The National Comprehensive Cancer Network (NCCN) annually updates guidelines with respect to genetic counselling and testing (www.nccn.org) and the most updated guidelines recommend it for individuals who meet the HBOC testing criteria. Guidelines are based on young age of onset, family history of breast cancer, specific histological types of breast cancer (TNBC), ovarian (epithelial and peritoneal), and prostate cancer (Gleason score ≥7). For details refer to NCCN guidelines (Genetic/Familial High-Risk Assessment: Breast and Ovarian), version 1.2016.19
 
Knowing the mutation status of germline BRCA1 and BRCA2, patients may be offered alternative screening and/or therapeutic interventions (Table 119), including intensive breast surveillance (magnetic resonance imaging [MRI] of the breasts in addition to standard breast imaging such as mammography and ultrasonography), mastectomy instead of breast conservation surgery, prophylactic mastectomy and salpingo-opherectomy, or the prescription of chemopreventive drugs and more recently the choice of chemotherapy as primary treatment, for example, carboplatin. A recent study has shown that treatment with carboplatin produces no advantage over docetaxel in patients with TNBC, although those with BRCA1 or BRCA2 mutation benefited from either drug.20 A number of targeted therapies, such as poly(ADP-ribose) polymerase inhibitors, have been shown to be effective in BRCA mutation carriers.21 22 The evolution of sequencing technologies enables parallel testing of multiple genes, leading to simultaneous analysis of breast cancer predisposition genes with either high or intermediate penetration. Multi-gene panel testing, however, has raised new issues regarding patient eligibility for gene testing other than BRCA1 and BRCA2, and more importantly, interpretation of genetic results.
 

Table 1. NCCN management of the hereditary breast and/or ovarian cancer syndrome19
(Adapted from the NCCN guidelines, version 1.2016)
 
TP53
One of the high penetrance genes is TP53, which is a tumour-suppressor gene that encodes the transcription factor protein p53. It is a ubiquitous protein implicated in preservation of an intact genome. It regulates cell cycle, DNA repair, apoptosis, cellular senescence, and metabolism. It has been shown to be involved in various kinds of cancer progression such as osteosarcomas, colon cancer, and lung cancer.23 24 25 26 27 28 Li-Fraumeni syndrome (LFS) is a rare but highly penetrance familial cancer syndrome that is characterised by germline TP53 mutations inherited in an autosomal dominant manner, in which 60% to 80% of LFS families carry a mutant TP53.29 In addition to soft-tissue sarcomas and osteosarcomas, LFS families are likely to exhibit a pattern of early-onset and multiple primary cancers including breast, brain, and adrenocortical tumours29 30; LFS is thought to account for approximately 1% of all breast cancers.31 32 Approximately 1% of women diagnosed with breast cancer before the age of 40 years carry a TP53 mutation.32 Breast cancer is the most frequent malignancy among female TP53 mutation carriers and accounts for up to one third of all cancers in LFS families.33 Although LFS is only responsible for a tiny fraction of breast cancers, women with LFS have a breast cancer risk of 56% by the age of 45 years and greater than 90% by the age of 60 years, and LFS accounts for a 60-fold increased risk for early-onset breast cancer compared with the general population.34 35 Women with LFS-related breast cancer are reported to have very early disease onset (20s or 30s) and a relatively advanced disease staging.36 37 38 Studies have shown that 3% to 8% of women who are diagnosed with breast cancer younger than 30 years without a significant family history of cancer have TP53 mutation.31 39 40 The NCCN has included early-onset breast cancer as one of the criteria for offering TP53 genetic testing, regardless of the family history of cancer. TP53 mutations can be tested either through sequencing the entire encoding region that identifies approximately 95% of TP53 mutations or just selected regions. Analysis of hot-spot regions located in exons 4-9 can detect approximately 90% of all TP53 mutations.19 41 42 When the TP53 mutation is present in an individual, breast screening and preventive guidelines are similar to those for BRCA mutation carriers. In addition, a full-body MRI scan is an option as a screening tool. Individuals with the following should be included for genetic testing of TP5319: early-onset breast cancer (≤35 years), a combination of diagnosis of a sarcoma at the age of <45 years, AND a first-degree relative diagnosed at the age of <45 years with cancer, multiple cancers (brain tumours, sarcomas, and leukaemia).
 
PTEN
PTEN is a phosphatase tensin homologue located on chromosome 10q23.3 that plays a tumour-suppressive role due to its PI3K (phosphatidylinositol-3-kinase) phosphatase activity. Abnormal PTEN cannot activate cell cycle arrest and apoptosis and leads to uncontrolled cell survival.43 Germline PTEN mutations have been identified in a variety of disorders such as Cowden syndrome (CS) or PTEN hamartoma tumour syndrome. Affected individuals have multiple hamartomas in a variety of tissues with an increased risk of malignant transformation.44 Breast cancer is the most common tumour associated with CS. Although CS is responsible for <1% of all breast cancers, women with this syndrome have a 25% to 50% risk of developing breast cancer in a lifetime and are prone to early onset.45 46 The frequency of multifocal and bilateral disease is increased in CS-associated breast cancers compared with sporadic cases.47 48 Women with CS also have an increased risk (67%) of benign breast disease characterised by mammary hamartomas that can be multiple and bilateral.49 Similar to TP53 mutation carriers, PTEN mutation carriers are advised to have breast surveillance and interventions as recommended for BRCA mutation carriers. The testing criteria for CS are those who present with breast cancer, endometrial cancer, follicular thyroid cancer, multiple gastrointestinal hamartomas, ganglioneuromas, or other diseases including macrocephaly, macular pigmentation of glans penis, and mucocutaneous lesions.19
 
Moderate- and low-penetrance genes
PALB2
PALB2 (partner and localiser of BRCA2) is involved in homologous recombination and double-strand break repair along with BRCA2.50 51 Loss-of-function mutations are associated with a 2 to 4 times higher risk than non-mutation carriers for familial breast cancer.52 53 54 A study analysed the risk of breast cancer among 362 members of 154 families who had deleterious PALB2 mutations.55 The results revealed that the risk of having breast cancer for female PALB2 mutation carriers was 8 to 9 times higher among those younger than 40 years, 6 to 8 times higher among those 40 to 60 years, and 5 times higher among those >60 years when compared with the general population. The estimated cumulative risk of breast cancer among female mutation carriers increased from 14% to 35% from the age of 50 to 70 years. In addition, the risk of breast cancer for PALB2 mutation carriers was significantly increased by familial factor.56 Thus, it has been advised that PALB2 mutation testing should be performed routinely to identify mutations in HBOC families since it may be of clinical relevance. This is increasingly being tested.
 
Other hereditary breast cancer susceptibility genes
There are other low-penetrance genes that are associated with hereditary breast cancer such as STK11, CDH1, and MMR genes, and that are responsible for Peutz-Jeghers syndrome, hereditary diffuse gastric cancer syndrome, and Lynch syndrome, respectively.57 58 59 Some moderate-penetrance genes such as CHEK2, ATM, BRIP1, RAD51C, RAD51D, BARD1, MRE11, RAD50, NBS1, and FANCM have been recognised as breast cancer susceptibility genes.60
 
The recent development of multi-gene testing for hereditary cancer has had a great impact on the clinical management and genetic counselling of high-risk patients and their families. The decision to use multi-gene testing should be no different than the rationale for testing a single gene. Multi-gene testing is more cost-effective than sequentially testing multiple genes associated with a phenotype. For example, young women diagnosed with breast cancer can be tested for mutations in BRCA1, BRCA2, and TP53. Detailed testing criteria for genes can be found in NCCN guidelines version 1.2016.19 Next-generation sequencing enables simultaneous analysis of a specific panel of genes, but there are limited outcome data on clinical interventions, particularly in lower-penetrance-gene-mutation–related breast cancers. Results of a multi-gene panel may pose difficulty in interpretation and clinical decisions. At present, multi-gene testing is largely performed for research purposes. There are limited data regarding the degree of cancer risk associated with some of the genes on the recurrent multi-gene test. There is a lack of well-established guidelines for risk management for carriers of mutations in some of the genes, which may lead to extra surveillance and surgeries.
 
Nonetheless multi-gene testing is more cost-effective and time-effective than single-gene testing, and provides a higher mutation detection rate. It may reduce the number of high-risk families with negative results of finding a gene mutation due to the increased coverage. The lifetime breast cancer risk estimates associated with gene mutations are listed in Table 2.10 13 36 56 58 61 62 63 64 65 66 67 68 69 70 71 72 73 74
 

Table 2. Estimated lifetime risk of breast cancer associated with selected susceptibility genes10 13 36 56 58 61 62 63 64 65 66 67 68 69 70 71 72 73 74
 
In Hong Kong, breast cancer is the most common cancer in the female population. The Hong Kong Hereditary Breast Cancer Family Registry was established in 2007. It functions as a data registry of hereditary breast, ovarian and prostate cancer families and is also an established charitable organisation that subsidises the cost of genetic testing for underprivileged individuals. More than 1900 patients with breast and/or ovarian cancer who satisfied the selection criteria have received genetic testing in Hong Kong. Each individual underwent thorough genetic counselling to ensure the implications of genetic testing were understood. Around 600 probands were screened for BRCA1 and BRCA2 mutations by bi-directional Sanger sequencing of all coding exons and multiplex ligation-dependent probe amplification.75 The sensitivity of identifying mutations is comparable with the gold-standard method with good bioinformatics support. Next-generation sequencing meets rigorous quality standards and can provide clinical sequencing results that are equivalent to those obtained from Sanger DNA sequencing analysis.76 We started employing next-generation DNA sequencing to expedite analysis workflow and expand the gene panel in 2011 to include TP53 and PTEN for sequencing. Cases with a negative result after screening with our in-house developed gene panel are further sequenced using 454 GS Junior System (Roche Life Sciences) or MiSeq (Illumina). Sequencing data are analysed by an in-house fully developed automatic bioinformatics pipeline. The mutation screening result of a 4-gene panel BRCA1, BRCA2, TP53, and PTEN in our recruited patients revealed that 9% carried such mutations. Nonetheless a number of clinically high-risk patients have tested negative for the above genes. This indicates that there is further potential in expanding the coverage to different lower-penetrance genes such as PALB2, which has recently been reported to be important to cause hereditary breast cancer in our testing strategy.56
 
Conclusions
Clinical assessment of an individual’s risk of hereditary cancer is based on the evaluation of family history, age of onset, and type of cancer. Advances in molecular genetics testing have identified a number of genes associated with inherited susceptibility to breast and/or ovarian cancers such as BRCA1, BRCA2, PTEN, and TP53. The recent introduction of next-generation sequencing technology and multi-gene panel testing for hereditary cancer has rapidly altered the clinical approach to high-risk patients and their families. Although there are still limitations, individuals with hereditary or familial breast/ovarian cancer are likely to benefit from strategies including prevention, screening, and targeted treatment. Suitable patients and families should be offered genetic counselling and testing.
 
Acknowledgements
This study was supported by The Hong Kong Hereditary Breast Cancer Family Registry, Hong Kong Sanatorium and Hospital, Dr. Ellen Li Charitable Foundation, the Kerry Group Kuok Foundation Limited and Health and Medical Research Fund (1123176).
 
References
1. GLOBOCAN 2012: Estimated cancer incidence, mortality and prevalence worldwide in 2012. Available from: http://globocan.iarc.fr/Pages/fact_sheets_cancer.aspx. Accessed Jan 2016.
2. Carroll JC, Cremin C, Allanson J, et al. Hereditary breast and ovarian cancers. Cab Fam Physician 2008;54:1691-2.
3. Daly MB, Axilbund JE, Buys S, et al. Genetic/familial high-risk assessment: breast and ovarian. J Natl Compr Canc Netw 2010;8:562-94.
4. Claus EB, Schildkraut JM, Thompson WD, Risch NJ. The genetic attributable risk of breast and ovarian cancer. Cancer 1996;77:2318-24. Crossref
5. Pharoah PD, Antoniou A, Bobrow M, Zimmern RL, Easton DF, Ponder BA. Polygenic susceptibility to breast cancer and implications for prevention. Nat Genet 2002;31:33-6. Crossref
6. Whittemore AS, Gong G, Itnyre J. Prevalence and contribution of BRCA1 mutations in breast cancer and ovarian cancer: results from three U.S. population-based case-control studies of ovarian cancer. Am J Hum Genet 1997;60:496-504.
7. Peng S, Lü B, Ruan W, Zhu Y, Sheng H, Lai M. Genetic polymorphisms and breast cancer risk: evidence from meta-analyses, pooled analyses, and genome-wide association studies. Breast Cancer Res Treat 2011;127:309-24. Crossref
8. Hall JM, Lee MK, Newman B, et al. Linkage of early-onset familial breast cancer to chromosome 17q21. Science 1990;250:1684-9. Crossref
9. Wooster R, Neuhausen SL, Mangion J, et al. Localization of a breast cancer susceptibility gene, BRCA2, to chromosome 13q12-13. Science 1994;265:2088-90. Crossref
10. Chen S, Parmigiani G. Meta-analysis of BRCA1 and BRCA2 penetrance. J Clin Oncol 2007;25:1329-33. Crossref
11. Mavaddat N, Peock S, Frost D, et al. Cancer risks for BRCA1 and BRCA2 mutation carriers: results from prospective analysis of EMBRACE. J Natl Cancer Inst 2013;105:812-22. Crossref
12. Ford D, Easton DF, Stratton M, et al. Genetic heterogeneity and penetrance analysis of the BRCA1 and BRCA2 genes in breast cancer families. The Breast Cancer Linkage Consortium. Am J Human Genet 1998;62:676-89. Crossref
13. Antoniou A, Pharoah PD, Narod S, et al. Average risks of breast and ovarian cancer associated with BRCA1 or BRCA2 mutations detected in case series unselected for family history: a combined analysis of 22 studies. Am J Hum Genet 2003;72:1117-30. Crossref
14. King MC, Marks JH, Mandell JB; New York Breast Cancer Study Group. Breast and ovarian cancer risks due to inherited mutations in BRCA1 and BRCA2. Science 2003;302:643-6. Crossref
15. Graeser MK, Engel C, Rhiem K, et al. Contralateral breast cancer risk in BRCA1 and BRCA2 mutation carriers. J Clin Oncol 2009;27:5887-92. Crossref
16. Atchley DP, Albarracin CT, Lopez A, et al. Clinical and pathologic characteristics of patients with BRCA-positive and BRCA-negative breast cancer. J Clin Oncol 2008;26:4282-8. Crossref
17. Lakhani SR, Reis-Filho JS, Fulford L, et al. Prediction of BRCA1 status in patients with breast cancer using estrogen receptor and basal phenotype. Clin Cancer Res 2005;11:5175-80. Crossref
18. Eerola H, Heikkilä P, Tamminen A, Aittomäki K, Blomqvist C, Nevanlinna H. Histopathological features of breast tumours in BRCA1, BRCA2 and mutation-negative breast cancer families. Breast Cancer Res 2005;7:R93-100. Crossref
19. Genetic/Familial High-Risk Assessment: Breast and Ovarian 2016. Available from: http://www.nccn.org/professionals/physician_gls/pdf/genetics_screening.pdf. Accessed Mar 2016.
20. Susman E. Metastatic TNBC: No improvement with carboplatin compared with docetaxel—study did, however, show importance of molecular testing to identify responsive subsets. Oncology Times 2015;37:42-3. Crossref
21. Tutt A, Robson M, Garber JE, et al. Oral poly(ADP-ribose) polymerase inhibitor olaparib in patients with BRCA1 or BRCA2 mutations and advanced breast cancer: a proof-of-concept trial. Lancet 2010;376:235-44. Crossref
22. Audeh MW, Carmichael J, Penson RT, et al. Oral poly(ADP-ribose) polymerase inhibitor olaparib in patients with BRCA1 or BRCA2 mutations and recurrent ovarian cancer: a proof-of-concept trial. Lancet 2010;376:245-51. Crossref
23. Diller L, Kassel J, Nelson CE, et al. p53 functions as a cell cycle control protein in osteosarcomas. Mol Cell Biol 1990;10:5772-81. Crossref
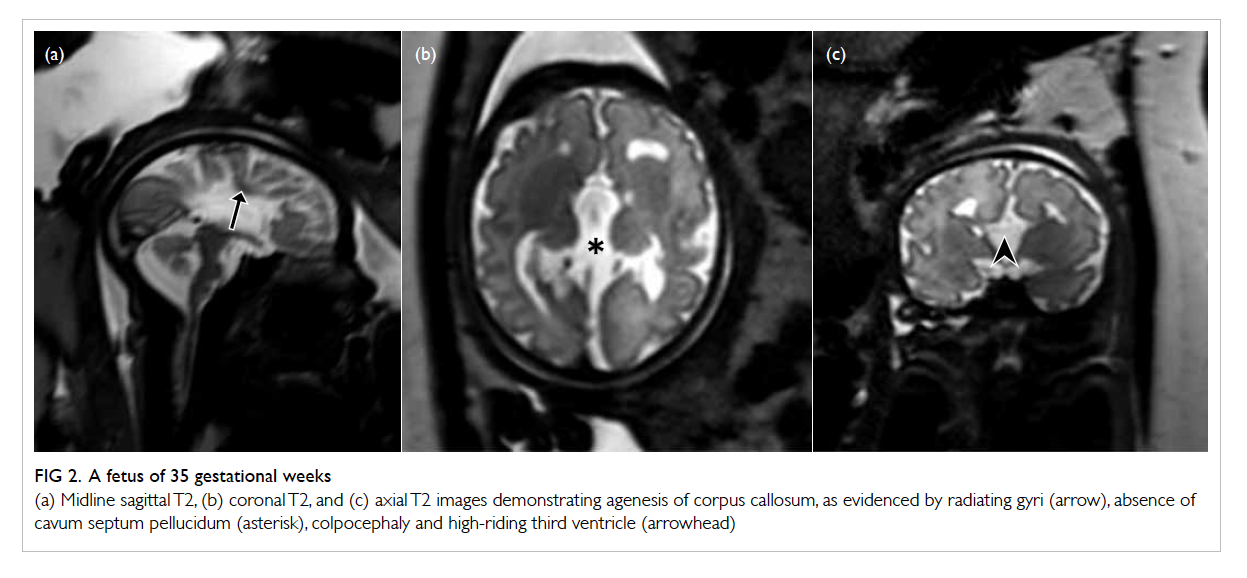
24. Serrano M, Lin AW, McCurrach ME, Beach D, Lowe SW. Oncogenic ras provokes premature cell senescence associated with accumulation of p53 and p16INK4a. Cell 1997;88:593-602. Crossref
25. Shaw P, Bovey R, Tardy S, Sahli R, Sordat B, Costa J. Induction of apoptosis by wild-type p53 in a human colon tumor-derived cell line. Proc Natl Acad Sci U S A 1992;89:4495-9. Crossref
26. Vousden KH, Ryan KM. p53 and metabolism. Nat Rev Cancer 2009;9:691-700. Crossref
27. Wang PY, Ma W, Park JY, et al. Increased oxidative metabolism in the Li-Fraumeni syndrome. N Engl J Med 2013;368:1027-32. Crossref
28. Wang Y, Blandino G, Oren M, Givol D. Induced p53 expression in lung cancer cell line promotes cell senescence and differentially modifies the cytotoxicity of anti-cancer drugs. Oncogene 1998;17:1923-30. Crossref
29. Li FP, Fraumeni JF Jr. Soft-tissue sarcomas, breast cancer, and other neoplasms. A familial syndrome? Ann Intern Med 1969;71:747-52. Crossref
30. Li FP, Fraumeni JF Jr, Mulvihill JJ, et al. A cancer family syndrome in twenty-four kindreds. Cancer Res 1988;48:5358-62.
31. McCuaig JM, Armel SR, Novokmet A, et al. Routine TP53 testing for breast cancer under age 30: ready for prime time? Fam Cancer 2012;11:607-13. Crossref
32. Sidransky D, Tokino T, Helzlsouer K, et al. Inherited p53 gene mutations in breast cancer. Cancer Res 1992;52:2984-6.
33. Birch JM, Blair V, Kelsey AM, et al. Cancer phenotype correlates with constitutional TP53 genotype in families with the Li-Fraumeni syndrome. Oncogene 1998;17:1061-8. Crossref
34. Olivier M, Goldgar DE, Sodha N, et al. Li-Fraumeni and related syndromes: correlation between tumor type, family structure, and TP53 genotype. Cancer Res 2003;63:6643-50.
35. Walsh T, Casadei S, Coats KH, et al. Spectrum of mutations in BRCA1, BRCA2, CHEK2, and TP53 in families at high risk of breast cancer. JAMA 2006;295:1379-88. Crossref
36. Masciari S, Dillon DA, Rath M, et al. Breast cancer phenotype in women with TP53 germline mutations: a Li-Fraumeni syndrome consortium effort. Breast Cancer Res Treat 2012;133:1125-30. Crossref
37. Melhem-Bertrandt A, Bojadzieva J, Ready KJ, et al. Early onset HER2-positive breast cancer is associated with germline TP53 mutations. Cancer 2012;118:908-13. Crossref
38. Wilson JR, Bateman AC, Hanson H, et al. A novel HER2-positive breast cancer phenotype arising from germline TP53 mutations. J Med Genet 2010;47:771-4. Crossref
39. Lalloo F, Varley J, Moran A, et al. BRCA1, BRCA2 and TP53 mutations in very early-onset breast cancer with associated risks to relatives. Eur J Cancer 2006;42:1143-50. Crossref
40. Mouchawar J, Korch C, Byers T, et al. Population-based estimate of the contribution of TP53 mutations to subgroups of early-onset breast cancer: Australian Breast Cancer Family Study. Cancer Res 2010;70:4795-800. Crossref
41. Varley JM. Germline TP53 mutations and Li-Fraumeni syndrome. Hum Mutat 2003;21:313-20. Crossref
42. Birch JM, Hartley AL, Tricker KJ, et al. Prevalence and diversity of constitutional mutations in the p53 gene among 21 Li-Fraumeni families. Cancer Res 1994;54:1298-304.
43. Shen WH, Balajee AS, Wang J, et al. Essential role for nuclear PTEN in maintaining chromosomal integrity. Cell 2007;128:157-70. Crossref
44. Hanssen AM, Fryns JP. Cowden syndrome. J Med Genet 1995;32:117-9. Crossref
45. Tan MH, Mester JL, Ngeow J, Rybicki LA, Orloff MS, Eng C. Lifetime cancer risks in individuals with germline PTEN mutations. Clin Cancer Res 2012;18:400-7. Crossref
46. Pilarski R. Cowden syndrome: a critical review of the clinical literature. J Genet Couns 2009;18:13-27. Crossref
47. Schrager CA, Schneider D, Gruener AC, Tsou HC, Peacocke M. Similarities of cutaneous and breast pathology in Cowden’s Syndrome. Exp Dermatol 1998;7:380-90. Crossref
48. Schrager CA, Schneider D, Gruener AC, Tsou HC, Peacocke M. Clinical and pathological features of breast disease in Cowden’s syndrome: an underrecognized syndrome with an increased risk of breast cancer. Hum Pathol 1998;29:47-53. Crossref
49. Starink TM, van der Veen JP, Arwert F, et al. The Cowden syndrome: a clinical and genetic study in 21 patients. Clin Genet 1986;29:222-33. Crossref
50. Xia B, Sheng Q, Nakanishi K, et al. Control of BRCA2 cellular and clinical functions by a nuclear partner, PALB2. Mol Cell 2006;22:719-29. Crossref
51. Sy SM, Huen MS, Zhu Y, Chen J. PALB2 regulates recombinational repair through chromatin association and oligomerization. J Biol Chem 2009;284:18302-10. Crossref
52. Tischkowitz M, Xia B. PALB2/FANCN: recombining cancer and Fanconi anemia. Cancer Res 2010;70:7353-9. Crossref
53. Casadei S, Norquist BM, Walsh T, et al. Contribution of inherited mutations in the BRCA2-interacting protein PALB2 to familial breast cancer. Cancer Res 2011;71:2222-9. Crossref
54. Erkko H, Xia B, Nikkilä J, et al. A recurrent mutation in PALB2 in Finnish cancer families. Nature 2007;446:316-9. Crossref
55. Lee AS, Ang P. Breast-cancer risk in families with mutations in PALB2. N Engl J Med 2014;371:1650-1. Crossref
56. Antoniou AC, Casadei S, Heikkinen T, et al. Breast-cancer risk in families with mutations in PALB2. N Engl J Med 2014;371:497-506. Crossref
57. Fitzgerald RC, Hardwick R, Huntsman D, et al. Hereditary diffuse gastric cancer: updated consensus guidelines for clinical management and directions for future research. J Med Genet 2010;47:436-44. Crossref
58. Hearle N, Schumacher V, Menko FH, et al. Frequency and spectrum of cancers in the Peutz-Jeghers syndrome. Clin Cancer Res 2006;12:3209-15. Crossref
59. Win AK, Young JP, Lindor NM, et al. Colorectal and other cancer risks for carriers and noncarriers from families with a DNA mismatch repair gene mutation: a prospective cohort study. J Clin Oncol 2012;30:958-64. Crossref
60. Economopoulou P, Dimitriadis G, Psyrri A. Beyond BRCA: new hereditary breast cancer susceptibility genes. Cancer Treat Rev 2015;41:1-8. Crossref
61. Bennett KL, Mester J, Eng C. Germline epigenetic regulation of KILLIN in Cowden and Cowden-like syndrome. JAMA 2010;304:2724-31. Crossref
62. Hobert JA, Eng C. PTEN hamartoma tumor syndrome: an overview. Genet Med 2009;11:687-94. Crossref
63. Lim W, Hearle N, Shah B, et al. Further observations on LKB1/STK11 status and cancer risk in Peutz-Jeghers syndrome. Br J Cancer 2003;89:308-13. Crossref
64. McGarrity TJ, Amos CI, Frazier ML, Wei C. Peutz-Jeghers syndrome. In: Pagon RA, Adam MP, Ardinger HH, et al, editors. GeneReviews [internet]. Seattle (WA): GeneReviews(R); 1993.
65. Pharoah PD, Guilford P, Caldas C; International Gastric Cancer Linkage Consortium. Incidence of gastric cancer and breast cancer in CDH1 (E-cadherin) mutation carriers from hereditary diffuse gastric cancer families. Gastroenterology 2001;121:1348-53. Crossref
66. Kaurah P, MacMillan A, Boyd N, et al. Founder and recurrent CDH1 mutations in families with hereditary diffuse gastric cancer. JAMA 2007;297:2360-72. Crossref
67. Renwick A, Thompson D, Seal S, et al. ATM mutations that cause ataxia-telangiectasia are breast cancer susceptibility alleles. Nat Genet 2006;38:873-5. Crossref
68. Thompson D, Duedal S, Kirner J, et al. Cancer risks and mortality in heterozygous ATM mutation carriers. J Natl Cancer Inst 2005;97:813-22. Crossref
69. Ahmed M, Rahman N. ATM and breast cancer susceptibility. Oncogene 2006;25:5906-11. Crossref
70. Roberts NJ, Jiao Y, Yu J, et al. ATM mutations in patients with hereditary pancreatic cancer. Cancer Discov 2012;2:41-6. Crossref
71. Meijers-Heijboer H, van den Ouweland A, Klijn J, et al. Low-penetrance susceptibility to breast cancer due to CHEK2(*)1100delC in noncarriers of BRCA1 or BRCA2 mutations. Nat Genet 2002;31:55-9. Crossref
72. Narod SA. Testing for CHEK2 in the cancer genetics clinic: ready for prime time? Clin Genet 2010;78:1-7. Crossref
73. Weischer M, Bojesen SE, Ellervik C, Tybjaerg-Hansen A, Nordestgaard BG. CHEK2*1100delC genotyping for clinical assessment of breast cancer risk: meta-analyses of 26,000 patient cases and 27,000 controls. J Clin Oncol 2008;26:542-8. Crossref
74. Cybulski C, Wokołorczyk D, Jakubowska A, et al. Risk of breast cancer in women with a CHEK2 mutation with and without a family history of breast cancer. J Clin Oncol 2011;29:3747-52. Crossref
75. Kwong A, Chen J, Shin VY, et al. The importance of analysis of long-range rearrangement of BRCA1 and BRCA2 in genetic diagnosis of familial breast cancer. Cancer Genet 2015;208:448-54. Crossref
76. McCourt CM, McArt DG, Mills K, et al. Validation of next generation sequencing technologies in comparison to current diagnostic gold standards for BRAF, EGFR and KRAS mutational analysis. PloS One 2013;8:e69604. Crossref

A review of selective laser trabeculoplasty in the Hong Kong Chinese population

Hong Kong Med J 2016 Apr;22(2):165–70 | Epub 11 Mar 2016
DOI: 10.12809/hkmj154641
© Hong Kong Academy of Medicine. CC BY-NC-ND 4.0
 
REVIEW ARTICLE
A review of selective laser trabeculoplasty in the Hong Kong Chinese population
Jacky WY Lee, FRCSEd1,2; Jimmy SM Lai, FRCSEd2
1 Dennis Lam and Partners Eye Center, Central, Hong Kong
2 Department of Ophthalmology, The University of Hong Kong, Pokfulam, Hong Kong
 
Corresponding author: Dr Jacky WY Lee (jackywylee@gmail.com)
 
 Full paper in PDF
Abstract
Introduction: Selective laser trabeculoplasty was first introduced to Hong Kong in 2004 for intra-ocular pressure lowering in the treatment of primary glaucoma. Since then, it has gained popularity as an alternative to anti-glaucoma medications and as a bridging therapy prior to more invasive glaucoma surgeries because of the high safety profile of the laser.
 
Methods: An Ovid search was performed using “selective laser trabeculoplasty” as the key word, which identified 190 unique articles; 24 reviews and/or meta-analyses were excluded. All remaining abstracts of original articles were in English. This review particularly focuses on the local population by summarising the findings from peer-reviewed publications that involved a Hong Kong Chinese population.
 
Results and Conclusion: This review addresses some of the clinically relevant questions relating to selective laser trabeculoplasty including laser application, optimal energy, efficacies and success rates among different glaucoma subtypes, predictors of success, adverse effects, and intra-ocular pressure fluctuation after selective laser trabeculoplasty.


Introduction
Glaucoma is a disease characterised by progressive optic nerve thinning. Intra-ocular pressure (IOP) remains an important modifiable risk factor even in normal- or low-tension glaucomas. Anti-glaucoma eye drops remain the mainstay of IOP-lowering therapy but their side-effects include conjunctival injection, allergy, hypertrichiasis, iris pigmentation, cystoid macular oedema, bradycardia, and bronchospasm. Laser trabeculoplasty describes the use of laser on the trabecular meshwork to promote aqueous output that in turn lowers the IOP. Laser trabeculoplasty is often performed when medications alone are inadequate for disease control, to avoid the side-effects of medication, or as a bridging therapy prior to more invasive glaucoma filtration surgery. Selective laser trabeculoplasty (SLT) was approved by the US Food and Drug Administration in 2001 for the treatment of open-angle glaucoma (OAG). Following the first clinical trial for the Hong Kong population in 2004 by Lai et al,1 the procedure has since gained popularity in our locality. Based on our understanding of the former argon laser trabeculoplasty technology, we are aware that variations in race and trabecular meshwork pigmentation can potentially influence laser success.2 3 4 This review aimed to summarise the published data on use of SLT in the Hong Kong Chinese population.
 
Methods
An Ovid search was made on 4 June 2015 using “selective laser trabeculoplasty” as the key word, which identified 190 unique articles; 24 reviews and/or meta-analyses were excluded. All remaining abstracts of original articles were in English. There were 15 abstracts in which an ophthalmology institution from Hong Kong Special Administrative Region (HKSAR) was identified as an affiliated institution. These 15 articles were reviewed to ensure that the study population contained participants from HKSAR prior to their inclusion in this review.
 
Selective laser trabeculoplasty
Laser application
Selective laser trabeculoplasty is a low-energy, Q-switched, frequency-doubled Nd:YAG laser with a wavelength of 532 nm. Lasers are delivered at a fixed duration of 3 nanoseconds and spot size of 400 µm. The initial energy is 0.8 mJ, titrated up until bubble formation is just visible and titrated down if pain is experienced. The pigmented area is usually treated with confluent, non-overlapping laser spots in a 360° fashion in a single session.1 5 6 In cases of angle closure, SLT is applied to at least 90° to 180° of the visible trabecular meshwork, avoiding areas of peripheral anterior synechiae.7 8
 
An alpha-adrenergic agonist may be applied prior to or immediately after the procedure to prevent IOP spikes that can occur in up to 10% of subjects within the first 1 to 2 hours of treatment.1 Post-laser eye drops may vary from no eye drops, topical non-steroidal eye drops, or a weak topical steroid for a short duration. Excess inflammatory suppression should be avoided as SLT works via an inflammatory cascade of cytokine up-regulation, phagocytic activity, and trabecular matrix metalloproteinase expression that reduce outflow resistance at the trabecular meshwork.9 10 11 The majority of anterior chamber reactions following SLT are mild and spontaneous, and resolve within the first week of laser.12
 
Optimal energy
Conventionally, 80 to 100 laser spots are delivered. Lee et al13 postulated that it is the total energy density (number of spots multiplied by the mean energy) delivered that is important, rather than just the number of laser spots. In a group of 49 Chinese OAG subjects who received 360° SLT treatment, bandwidth selection by generalised cross-validation methods was used to determine the optimal interval and point of total SLT energy that provided the greatest IOP reduction. The 95% confidence band by bootstrap analysis revealed that at energy intervals between 214.6 and 234.9 mJ, the IOP was most likely to decrease by 25%, with the optimal total energy at 226.1 mJ.
 
Efficacy in different glaucoma subtypes
Primary open-angle glaucoma and ocular hypertension
Lai et al1 conducted the first randomised controlled trial of SLT in a Hong Kong Chinese population with primary open-angle glaucoma (POAG) and ocular hypertension (OHT), comparing the effect of the laser versus topical anti-glaucoma medications alone over 5 years using the untreated eye as a control. Additional medical therapy was permitted for eyes that had inadequate IOP control despite SLT. In the study, 29 patients (17 POAG and 12 OHT) completed follow-up for 5 years and all were of Chinese ethnicity with a dark brown iris. The SLT eye had a mean IOP reduction of 32% (26.8 mm Hg to 18.3 mm Hg) at 5 years although this level of IOP reduction was statistically similar to the control eye. The SLT-treated eye, however, required fewer medications to maintain an IOP of ≤21 mm Hg (P<0.001); only 27.6% of eyes that received SLT required medications at 5 years. The failure rate, which was defined as an IOP of >21 mm Hg with maximal topical medications, was similar in both treatment arms (17.2% in the SLT-treated eye vs 27.6% in the eye that received medication alone; P=0.53).1
 
Similarly, in a randomised controlled trial studying the change in quality of life between subjects prescribed adjuvant SLT versus medication for the treatment of POAG, Lee et al5 reported that at 6 months, the SLT group (n=22) had a 7.6% lower IOP (P=0.03) and required 40.0% less medication (P=0.02) compared with the medical group (n=19). When compared with its own baseline at 6 months, the SLT group had a 15.1% lower IOP (P<0.0001) on top of a 34.8% reduction in medication requirement (P<0.0001) while the medical therapy group demonstrated no change in IOP or medication requirement (P>0.8). Despite these significant reductions in IOP and medications in the SLT group, however, there was no statistical difference between the translated Chinese version of the Glaucoma Quality of Life–15 score or the simplified Comparison of Ophthalmic Medications for Tolerability survey score between both treatment arms (P>0.2). The absence of a detectable change in the short-term quality of life could be related to the design of the existing glaucoma-specific quality-of-life surveys that mainly focus on detecting changes in vision, dark adaptation, and outdoor mobility, and may be suboptimal in assessing the side-effects and inconvenience of medication use.
 
Selective laser trabeculoplasty seems to be an effective alternative to medication with sustainable IOP reductions for up to 5 years together with a lower medication requirement.
 
Primary angle-closure glaucoma
Primary angle-closure glaucoma (PACG) is characterised by ≥270° of angle closure where the trabecular meshwork is on Shaffer grades 0 to 1. Ho et al7 reported the SLT outcome in 60 PACG patients with an IOP of >21 mm Hg in the presence of a patent laser iridotomy with >90° of visible pigmented trabecular meshwork. In the study, SLT was delivered to 90° of open angle and at 6 months, 82% of subjects had >3 mm Hg reduction, 72% had >4 mm Hg reduction, 54% had ≥20% IOP reduction, and 24% had ≥30% IOP reduction. The mean IOP decreased from 24.6 mm Hg to 18.7 mm Hg after SLT, signifying a 24% IOP reduction at 6 months.7 8
 
In a recent three-centre randomised clinical trial involving Singapore, Jakarta, and Hong Kong,8 100 subjects with PACG or primary angle closure (angle closure without glaucomatous optic neuropathy) with 180° of visible trabecular meshwork were randomised to receive SLT versus travoprost 0.004% for IOP control. At 6 months, both treatment arms had a similar degree of IOP reduction (16.9% in the SLT group vs 18.5% in the medical therapy group; P=0.52). The absolute success (IOP ≤21 mm Hg without medications) was 60.0% in the SLT group and 84.0% in the medical therapy group (P=0.008). Selective laser trabeculoplasty is effective in primary angle closure or PACG where at least 90° of the pigmented trabecular meshwork is accessible.
 
Normal-tension glaucoma
Normal-tension glaucoma (NTG) is a subtype of POAG with the presence of glaucomatous optic neuropathy but IOP never exceeds 21 mm Hg. There is a high prevalence in Korea and Japan, accounting for 77% and 92% of their POAG cases respectively, although there is no published prevalence for Hong Kong.14 15 The Collaborative Normal-Tension Glaucoma Study Group has demonstrated that a 30% IOP reduction may slow disease progression of NTG despite a non–pressure dependent, hypoperfusion element in the disease pathophysiology.16
 
Lee et al6 17 prospectively treated 46 patients with NTG who were currently prescribed topical anti-glaucoma medications. They received a 1-month washout of medication and a single session of SLT before medications were gradually resumed in a step-wise manner. Selective laser trabeculoplasty reduced IOP by 20% and 15% at 6 months and 1 year, respectively. Medications were also reduced by 27% at both 6 months and 1 year after laser.6 17 At 2 years, 34 subjects completed follow-up. The mean (± standard deviation) age was 65.1 ± 12.1 years with a post-washout IOP of 16.2 ± 2.3 mm Hg. The mean SLT shots delivered was 191.0 ± 27.3 with a mean energy of 1.0 ± 0.08 mJ. The mean IOP reduction at 24 months was 22% (P<0.0001) from the post-washout (without medication) level and 11.5% from the pre-study (with medication) level (P<0.0001), in addition to a medication reduction of 40% (P<0.0001).
 
There was a gradual decline in the absolute success rate (IOP reduction >20% without medication) following SLT, from 61% at 6 months, to 22% at 12 months, and to 11% at 24 months. It is well known that the effect of SLT decreases with time but the process may be repeated as needed.6 Although the effect of SLT on NTG is not as prominent as in those with POAG or PACG, it remains a worthwhile procedure in NTG where drug compliance may be an issue. Patients are often asymptomatic in the early stages and are told they have ‘normal’ pressures during follow-up, compromising their understanding of the disease. Nonetheless, it must be noted that SLT only addresses the pressure-dependent component of the disease and not the hypoperfusion element of NTG that can be equally important in disease progression.
 
Success rates
The response or success rate to SLT is most commonly defined in the literature as an IOP reduction of ≥20%.18 19 This success rate varied among the different glaucoma subgroups in our local population however—47% in POAG,5 54% to 60% in PACG,7 8 and 60% in NTG.6 Likewise, the mean IOP reduction also varies among different glaucoma subgroups—32% reduction at 60 months in POAG,1 24% reduction at 6 months in PACG,7 and 22% reduction at 24 months for NTG.20
 
Predictors of success
Not all treated eyes respond to SLT, thus understanding the factors that may influence a successful outcome is useful for both the clinician and patient. Lee et al21 22 23 analysed 25 potential covariates as detailed below, using univariate and multiple logistic regression analyses in Chinese subjects with OAG, NTG, and POAG independently. Success was defined as an IOP reduction of ≥20% while anti-glaucoma medications remained unchanged. The category of covariates included: type of glaucoma, age, gender, phakic status, presenting and pre-SLT IOP, IOP at various time intervals after SLT, number and type of anti-glaucoma medications, number of SLT spots, SLT energy, glaucoma severity via retinal nerve fibre layer thickness on optical coherence tomography and visual field index on Humphrey Visual Field, visual acuity, and pre-SLT corneal parameters.21 22 23
 
Among the 111 OAG eyes (60 NTG and 51 POAG) that were analysed, having a higher pre-laser IOP was a significant predictor of success on both univariate / multivariate analyses (coefficient=0.20 / 0.46, odds ratio [OR]=1.23 / 1.58, P=0.0017 / 0.0011). Use of three anti-glaucoma medications was more likely to result in a non-successful procedure on univariate / multivariate analyses (coefficient = –1.08 / –3.74, OR=0.3 / 0.024, P=0.037 / 0.0081).22
 
For the POAG subgroup, success was more likely in those with: an older age (coefficient=0.1, OR=1.1, P=0.0003), a higher pre-laser IOP (coefficient=0.3, OR=1.3, P=0.0005), four types of anti-glaucoma medications (coefficient=2.1, OR=8.4, P=0.005), a larger dioptre of spherical equivalent (coefficient=2.1, OR=8.4, P=0.005), and the use of a carbonic anhydrase inhibitor eye drop (coefficient=1.7, OR=6.0, P=0.003).21
 
In those with NTG, success was most commonly seen in those with a higher pre-laser IOP (coefficient=1.1, OR=3.1, P=0.05) and in those who achieved a lower IOP at 1 week after SLT (coefficient= –0.8, OR=0.5, P=0.04).23
 
Thus, it seems that regardless of the type of glaucoma, having a higher pre-laser IOP is one of the more consistent predictors of success. Nevertheless, it is important to keep in mind that the mean IOP reduction from SLT is around 22% to 32% as detailed in the earlier sections, and SLT alone may not adequately manage those with extremely high pressures.
 
Adverse effects
Intra-ocular spikes and uveitis
Lai et al1 have reported that in our population, the incidence of IOP spikes of >5 mm Hg after SLT can occur in up to 10.3% of patients within the first 1 to 2 hours of SLT. Ho et al7 reported that 2.0% of their PACG population had IOP spikes of >5 mm Hg after SLT. The majority of anterior uveitis settle within 3 to 5 days of treatment.12
 
Corneal changes
Lee et al12 investigated 111 eyes with OAG that had SLT treatment. The endothelial cell count (specular microscopy), central corneal thickness (CCT; videokeratography), and spherical equivalent (kerato-refractometer) were measured before and at 1 month after SLT. The mean endothelial cell count apparently decreased by 4.5% (from 2465.0 ± 334.0 cells/mm2 to 2355.0 ± 387.0 cells/mm2; P=0.0004) during the first week but increased back to baseline level by 1 month. This was due to the attachment of inflammatory cells on the endothelium or a microscopic cellular oedema separating the endothelial cells from the Descemet’s, impairing the accurate counting of endothelial cells.12 In PACG that received SLT to at least 180° of visible trabecular meshwork, it was reported that at 6 months, the endothelial cell count loss was 4.8% (P=0.001).8 The differences between the permanence of endothelial cell damage between the two studies may be related to the closer proximity of the cornea to the trabecular meshwork in PACG subjects. Patients with PACG should be made aware of this potential damage to the endothelium from laser heat dissipation.
 
There was a transient 1.1% decrease in CCT at 1 week after SLT (from 549.4 ± 37.6 to 543.9 ± 40.2 µm; P=0.02) likely from temporary thermal contractions of the stromal collagen fibres. There was no change in the spherical equivalent but the mean vision after SLT was interestingly reported to improve from 0.3 logMAR to 0.2 logMAR (P<0.0003), possibly related to subjective variation in visual testing and not directly related to the laser itself.12
 
Intra-ocular spikes, uveitis, and corneal changes are only some of the potential side-effects of SLT that have been reported in studies involving the Hong Kong Chinese population. Although a full review of the side-effects of SLT is beyond the scope and focus of this review, a comprehensive summary of side-effects with incidences can be found in a recent meta-analysis by Wong et al.24
 
Influence of selective laser trabeculoplasty on fluctuation of intra-ocular pressure
At present, there is no effective means to measure the continuous 24-hour IOP profile in the gold-standard measurement of mm Hg but IOP fluctuation has been demonstrated as a potential risk factor in glaucoma progression.25 26 The SENSIMED Triggerfish (Sensimed AG, Lausanne, Switzerland) is a wireless silicon contact lens sensor (CLS) that can measure the biodimensional changes at the corneoscleral junction, collecting more than 300 data points every 5 minutes. The IOP is measured in output units of millivolts equivalent, thus, the plotted data can only represent the degree of fluctuation from the individual’s baseline pressure.27
 
Lee et al27 utilised the CLS to measure IOP-related pattern changes in a group of Chinese NTG subjects treated with SLT. The CLS was worn for 24 hours before and for 1 month after the laser procedure while keeping the same number of antiglaucoma medications. A cosine function was fitted to the mean CLS pattern and global variability was analysed in subjects that had success and non-successful to laser, where success was defined as IOP reduction of ≥20%. Local variability from the mean curve was also measured at the diurnal, nocturnal, and 24-hour periods.27 In 44% of subjects who had successful SLT, the global amplitude was reduced by 24.6% but in the non-successful group, subjects experienced a 19.2% increase in their global amplitude, which was primarily driven by a 34.1% greater diurnal local variability.27
 
Whether or not SLT affects IOP fluctuation remains controversial in the literature for other populations with different authors reporting differences in IOP fluctuation and at different periods of the day.28 29 The majority of subjects in Lee et al’s study29 were prescribed an evening dose of prostaglandin analogues and it has been previously reported that the peak effect of the drug occurs between 8 and 12 hours.30 It seems that in our population, patients who respond to SLT may also benefit from a dampening of their 24-hour IOP-related pattern amplitude although larger-scale studies with 24-hour IOP monitoring in mm Hg would be required to draw more solid conclusions about SLT and IOP fluctuation.
 
Conclusion
Based on literature related to the Hong Kong Chinese population, SLT is an effective modality for lowering IOP in patients with POAG, OHT, PACG, and NTG. The response or success rate to laser and the amount of IOP reduction varies depending on the type of glaucoma. A higher pre-laser IOP was associated with greater success and delivering a greater total energy seemed to improve the level of IOP reduction. Adverse effects including IOP spikes and uveitis were usually transient although permanent endothelial cell loss may be seen after SLT in patients with anatomically narrow angles. Further research is warranted to assess the repeatability of SLT, long-term sustainability, influence on IOP fluctuation, and role as primary treatment for glaucoma.
 
References
1. Lai JS, Chua JK, Tham CC, Lam DS. Five-year follow up of selective laser trabeculoplasty in Chinese eyes. Clin Experiment Ophthalmol 2004;32:368-72. Crossref
2. Traverso CE, Spaeth GL, Starita RJ, Fellman RL, Greenidge KC, Poryzees E. Factors affecting the results of argon laser trabeculoplasty in open-angle glaucoma. Ophthalmic Surg 1986;17:554-9.
3. Schwartz AL, Love DC, Schwartz MA. Long-term follow-up of argon laser trabeculoplasty for uncontrolled open-angle glaucoma. Arch Ophthalmol 1985;103:1482-4. Crossref
4. Wise JB. Ten year results of laser trabeculoplasty. Does the laser avoid glaucoma surgery or merely defer it? Eye (Lond) 1987;1:45-50. Crossref
5. Lee JW, Chan CW, Wong MO, Chan J, Li Q, Lai JS. A randomized control trial to evaluate the effect of adjuvant selective laser trabeculoplasty versus medication alone in primary open-angle glaucoma: preliminary results. Clin Ophthalmol 2014;8:1987-92. Crossref
6. Lee JW, Gangwani RA, Chan JC, Lai JS. Prospective study on the efficacy of treating normal tension glaucoma with a single session of selective laser trabeculoplasty. J Glaucoma 2015;24:77-80. Crossref
7. Ho CL, Lai JS, Aquino MV, et al. Selective laser trabeculoplasty for primary angle closure with persistently elevated intraocular pressure after iridotomy. J Glaucoma 2009;18:563-6. Crossref
8. Narayanaswamy A, Leung CK, Istiantoro DV, et al. Efficacy of selective laser trabeculoplasty in primary angle-closure glaucoma: a randomized clinical trial. JAMA Ophthalmol 2015;133:206-12. Crossref
9. Stein JD, Challa P. Mechanisms of action and efficacy of argon laser trabeculoplasty and selective laser trabeculoplasty. Curr Opin Ophthalmol 2007;18:140-5. Crossref
10. Samples JR, Alexander JP, Acott TS. Regulation of the levels of human trabecular matrix metalloproteinases and inhibitor by interleukin-1 and dexamethasone. Invest Ophthalmol Vis Sci 1993;34:3386-95.
11. Bradley JM, Anderssohn AM, Colvis CM, et al. Mediation of laser trabeculoplasty-induced matrix metalloproteinase expression by IL-1beta and TNFalpha. Invest Ophthalmol Vis Sci 2000;41:422-30.
12. Lee JW, Chan JC, Chang RT, et al. Corneal changes after a single session of selective laser trabeculoplasty for open-angle glaucoma. Eye (Lond) 2014;28:47-52. Crossref
13. Lee JW, Wong MO, Liu CC, Lai JS. Optimal selective laser trabeculoplasty energy for maximal intraocular pressure reduction in open-angle glaucoma. J Glaucoma 2015;24:e128-31. Crossref
14. Iwase A, Suzuki Y, Araie M, et al. The prevalence of primary open-angle glaucoma in Japanese: the Tajimi Study. Ophthalmology 2004;111:1641-8. Crossref
15. Kim CS, Seong GJ, Lee NH, Song KC; Namil Study Group, Korean Glaucoma Society. Prevalence of primary open-angle glaucoma in central South Korea the Namil study. Ophthalmology 2011;118:1024-30. Crossref
16. Comparison of glaucomatous progression between untreated patients with normal-tension glaucoma and patients with therapeutically reduced intraocular pressures. Collaborative Normal-Tension Glaucoma Study Group. Am J Ophthalmol 1998;126:487-97. Crossref
17. Lee JW, Ho WL, Chan JC, Lai JS. Efficacy of selective laser trabeculoplasty for normal tension glaucoma: 1 year results. BMC Ophthalmol 2015;15:1. Crossref
18. Schwartz AL, Whitten ME, Bleiman B, Martin D. Argon laser trabecular surgery in uncontrolled phakic open angle glaucoma. Ophthalmology 1981;88:203-12. Crossref
19. Song J, Lee PP, Epstein DL, et al. High failure rate associated with 180 degrees selective laser trabeculoplasty. J Glaucoma 2005;14:400-8. Crossref
20. Lee JW, Shum JJ, Chan JC, Lai JS. Two-year clinical results after selective laser trabeculoplasty for normal tension glaucoma. Medicine (Baltimore) 2015;94:e984. Crossref
21. Lee JW, Liu CC, Chan J, Wong RL, Wong IY, Lai JS. Predictors of success in selective laser trabeculoplasty for primary open angle glaucoma in Chinese. Clin Ophthalmol 2014;8:1787-91. Crossref
22. Lee JW, Liu CC, Chan JC, Lai JS. Predictors of success in selective laser trabeculoplasty for Chinese open-angle glaucoma. J Glaucoma 2014;23:321-5. Crossref
23. Lee JW, Liu CC, Chan JC, Lai JS. Predictors of success in selective laser trabeculoplasty for normal tension glaucoma. Medicine (Baltimore) 2014;93:e236. Crossref
24. Wong MO, Lee JW, Choy BN, Chan JC, Lai JS. Systematic review and meta-analysis on the efficacy of selective laser trabeculoplasty in open-angle glaucoma. Surv Ophthalmol 2015;60:36-50. Crossref
25. Asrani S, Zeimer R, Wilensky J, Gieser D, Vitale S, Lindenmuth K. Large diurnal fluctuations in intraocular pressure are an independent risk factor in patients with glaucoma. J Glaucoma 2000;9:134-42. Crossref
26. Collaer N, Zeyen T, Caprioli J. Sequential office pressure measurements in the management of glaucoma. J Glaucoma 2005;14:196-200. Crossref
27. Lee JW, Fu L, Chan JC, Lai JS. Twenty-four-hour intraocular pressure related changes following adjuvant selective laser trabeculoplasty for normal tension glaucoma. Medicine (Baltimore) 2014;93:e238. Crossref
28. Kóthy P, Tóth M, Holló G. Influence of selective laser trabeculoplasty on 24-hour diurnal intraocular pressure fluctuation in primary open-angle glaucoma: a pilot study. Ophthalmic Surg Lasers Imaging 2010;41:342-7. Crossref
29. Lee AC, Mosaed S, Weinreb RN, Kripke DF, Liu JH. Effect of laser trabeculoplasty on nocturnal intraocular pressure in medically treated glaucoma patients. Ophthalmology 2007;114:666-70. Crossref
30. Russo A, Riva I, Pizzolante T, Noto F, Quaranta L. Latanoprost ophthalmic solution in the treatment of open angle glaucoma or raised intraocular pressure: a review. Clin Ophthalmol 2008;2:897-905.

Alternatives to colonoscopy for population-wide colorectal cancer screening

Hong Kong Med J 2016 Feb;22(1):70–7 | Epub 8 Jan 2016
DOI: 10.12809/hkmj154685
© Hong Kong Academy of Medicine. CC BY-NC-ND 4.0
 
REVIEW ARTICLE    CME
Alternatives to colonoscopy for population-wide colorectal cancer screening
William CY Leung1; Dominic CC Foo, MRCSEd, FHKAM (Surgery)2; TT Chan1; MF Chiang1; Allan HK Lam1; Heywood HW Chan1; Chris CL Cheung1
1 Li Ka Shing Faculty of Medicine, The University of Hong Kong, Pokfulam, Hong Kong
2 Department of Surgery, Li Ka Shing Faculty of Medicine, The University of Hong Kong, Pokfulam, Hong Kong
 
Corresponding author: Dr William CY Leung (cywleung.hku@gmail.com)
 
 Full paper in PDF
Abstract
Colorectal cancer is one of the top three cancers in the world in terms of incidence. Colonoscopy, which many regard as the gold standard in diagnosis of colonic polyps and neoplasm, is costly, invasive and labour-intensive, and deemed an unsuitable population-wide index screening tool. Alternative modalities, including guaiac and immunohistochemical faecal occult blood tests, computed tomographic colonography, colon capsule endoscopy, flexible sigmoidoscopy, and double-contrast barium enema are available. The procedures, test characteristics, and their implications are reviewed. Immunohistochemical faecal occult blood testing appears to be the most suitable population-wide screening test for an average-risk population, with flexible sigmoidoscopy as an alternative. More evidence is needed to determine the role of computed tomographic colonography and colon capsule endoscopy in colorectal cancer screening.
 
 
Introduction
Colorectal cancer (CRC) became the second and third most common cancer in women and men in 2012.1 Most cases of CRC arise from adenoma, the process known as the adenoma-carcinoma sequence, and are therefore amenable to screening and early treatment.2 3 4 Ecological studies have shown that 2.6% to 5.6% of advanced adenoma progress to CRC annually.5
 
Colonoscopy remains the gold standard for diagnosis,6 and has even been used as a primary screening method in some countries (eg the US). Nonetheless its use in most countries as an index tool for mass screening of an average-risk population is impractical due to its cost, invasiveness, and need for expertise (ie endoscopists).
 
In this study, we reviewed the literature about the procedures, test characteristics, and implications of the following alternative screening modalities: guaiac faecal occult blood testing (gFOBT), immunohistochemical faecal occult blood testing (iFOBT), computed tomographic colonoscopy (CTC), colon capsule endoscopy (CCE), flexible sigmoidoscopy (FS), and double-contrast barium enema (DCBE).
 
Guaiac faecal occult blood testing
The gFOBT offers the strongest evidence as a suitable screening tool for CRC. Its mechanism involves detection of haemoglobin in the stool. The test is not specific for human haemoglobin however, and false-positive results can arise due to plant peroxidases and heme in red meat. False negatives can occur when stool contains certain chemicals, eg vitamin C. It also detects bleeding from the gastro-intestinal (GI) tract other than the colon and rectum. Two or more samples are usually required.
 
Four large-scale randomised controlled trials (RCTs) of gFOBT with long-term follow-up have been conducted; they include Minnesota study in the US,7 Nottingham trial in the UK,8 Göteborg study in Sweden,9 and Funen study in Denmark.10 A total of 328 767 individuals, aged 45 to 80 years, were involved. The results consistently showed reduction in CRC mortality by 12% to 33%, after up to 30 years of follow-up.7 8 9 10 The results are summarised in Table 1.
 

Table 1. Summary of four randomised controlled trials comparing screening with guaiac faecal occult blood testing with no screening7 8 9 10
 
In screening for significant or advanced adenoma, test sensitivity was 23.8%,11 and specificity was 97.7% to 99.0% with positive predictive values (PPVs) of 39.0% to 55.3%. The detection rate in intention-to-screen (ITS) analysis was 0.6% and that in per protocol (PP) analysis was 1.2%. The NNScreen, or the number of average-risk individuals needed to recruit in a screening programme to detect one advanced adenoma, was 84 to 181.12 13 The NNScope, or the number of colonoscopies needed to diagnose an advanced adenoma after screening revealed a likely significant lesion, was 2.2.12 Although NNScreen is useful in assessing each modality individually, NNScope of a test provides additional information about the role of gFOBT in a screening programme to select patients for further diagnostic colonoscopy. For CRC, the sensitivity was 54.2%, and specificity ranged from 96.9% to 98.1% with a PPV of 5.2% to 13.6%. Detection rate in ITS analysis was 0.1%, while that in PP analysis was 0.2%. The NNScreen was 392 to 936 and the NNScope was 10.3.11 12 13 14
 
The Funen study10 showed the CRC mortality dropped from 18% to 11% after five screening rounds, as a result of decreased compliance. Similar findings were echoed in the Tenerife study in Spain.11
 
Immunochemical faecal occult blood testing
The iFOBT employs an antibody-based assay, detecting globin or early degradation products of human haemoglobin.15 The antibodies used are human-specific, thus the number of false positives due to non-human blood is minimised. As globin is more rapidly degraded than heme throughout the GI tract, less upper GI tract bleeding is detected. It requires no dietary restrictions16 and has a participation rate of 38.9% to 71.9%.17 18 19 The results can be qualitative or quantitative.20 Sampling technique, distribution of blood in faeces, and sample instability make true quantification difficult, however.15 Adjustment of performance parameters is possible by altering the cut-off values. It is generally agreed that a cut-off of 75 ng/mL provides a balance between higher detection rate and lower NNScope.12 15 18 21 22 It should also be noted though that different brands of iFOBT kits may yield different results even when the same cut-off is used.
 
The iFOBT on one or two consecutive faecal samples is recommended. A study showed that 1-day sampling had a higher miss rate for CRC compared with 2-day sampling.23 Another study showed that performing iFOBT at 1-, 2-, or 3-year intervals did not yield significantly different results in terms of advanced adenoma detection, but compliance decreased with frequent screening.24
 
The stability of the iFOBT kit is temperature-dependent, making results vulnerable to changes in environmental temperature and the sample return time.20 In moderate climates, the sample return time should not exceed 7 days.25 Manufacturers are developing buffer solutions to overcome this problem.15
 
A potential disadvantage of iFOBT is its decreased sensitivity to proximal colonic lesions. A German study showed a sensitivity of 33% and 20% for left- and right-sided lesions, respectively. Nonetheless the results were statistically insignificant,26 and were contradictory to another Dutch trial.27
 
The positivity rate of iFOBT ranges from 5.5% to 11.0%.12 13 17 19 28 29 The sensitivity and specificity for CRC ranges from 53.3% to 94.1% and 87.5% to 96.9%, respectively.18 28 30 31 The PPV ranges from 5.2% to 12.8% at a cut-off value of 75 ng/mL.12 13 17 18 19 28 29 30 31 32 The NNScreen and NNScope ranges from 213 to 936 and 9.8 to 17.3, respectively.12 13 17 19 28 29 30 32 These results are summarised in Table 2. For advanced adenoma, the sensitivity and specificity ranges from 33.9% to 41.3% and 91.4% to 97.3%, respectively.18 28 31 The PPV ranges from 49.0% to 51.8%.12 13 The NNScope and NNScreen ranges from 2.2 to 2.4 and 88.0 to 135.6, respectively (single sample).29
 

Table 2. Studies showing performance of iFOBT, with or without comparison with gFOBT12 13 17 18 19 28 29 30 31 32
 
Compared with gFOBT, studies in the literature showed superior results for iFOBT that generally had a higher positivity rate, often 2 times higher than that of gFOBT.13 28 The detection rate for CRC in a study by Faivre et al32 was 1.6 to 2.1 times higher than in gFOBT. This was echoed by another large-scale RCT which showed a significantly higher detection rate using iFOBT.13 Studies showed the detection rate for advanced adenoma using iFOBT to be at least double that of gFOBT.12 29 In the study by Faivre et al,32 iFOBT was 1.7 to 2.1 times more sensitive than gFOBT for CRC.32 A study by Brenner and Tao30 showed significantly higher PPV for iFOBTs than gFOBTs (7.3%-10.0% vs 4.5%). In two comparative studies, the NNScreen of iFOBT was about half that of gFOBT29 32; iFOBT also had a 13.0% to 15.0% higher participation rate than gFOBT.13 15 16 20 33
 
The iFOBT is more costly than its guaiac-based counterpart,20 but modelling studies showed that it is more cost-effective.34 35 36 37 This is largely explained by the higher participation rate, detection rate, sensitivity and PPV, and with lower NNScope and NNScreen. There is a general consensus that it should replace gFOBT.16 20 38
 
Computed tomographic colonography
The CTC was first described in 1994.39 It provides a non-invasive structural assessment of the colon. Compared with conventional colonoscopy, CTC is sedation-free and has an extremely low risk of bowel perforation (0.005%-0.059%).40 41 Furthermore, assessment of the extra-colonic organs can be performed at the same time.42 A lower volume bowel preparation may be used43 and the radiation risk is negligible.41 Its main disadvantage is that biopsy is not possible, and the patient may require a second procedure with another bowel preparation, thus imposing additional costs and discomfort to the patient. Its role in CRC screening remains debatable. The American Cancer Society supports screening with CTC every 5 years.44 Other guidelines including the National Institutes of Health Asia Pacific Consensus Recommendations do not support its use, however, stating its lack of evidence as a screening technique in an average-risk population.45 46
 
Studies of CTC in the literature use detection of polyps in general as the end-point. Data for detection of invasive carcinoma as well as reduction in CRC mortality were not available. Different studies use either ‘per patient’ or ‘per polyp’ for analysis. Two large US trials supported CTC as a screening tool in asymptomatic average-risk populations. Per-patient analyses demonstrated a sensitivity of 78.0% to 93.8%, and specificity of 79.6% to 96.0%, respectively.47 48 Meta-analyses in 2011 and 2014 reviewed 15 trials,49 50 including the two aforementioned studies. All trials focused on a population aged over 50 years with average risk. Martín-López et al49 showed an overall per-patient sensitivity and specificity for CTC of 66.8% and 80.3%, which was lower than that of colonoscopy of 92.5% and 73.2%, respectively. The sensitivity and specificity were higher for larger polyps. For polyps larger than 1 cm, the sensitivity was 91.2% and specificity 87.3%. Another meta-analysis reported sensitivities for ≥6-mm and ≥10-mm polyps as 75.9% and 83.3% and specificities as 94.6% and 98.7%, respectively.50
 
Estimation of the cost-effectiveness remains complicated. Based on a systematic review of 16 studies,51 the cost-effectiveness of CTC remains controversial. There is generally a stronger preference for CTC over colonoscopy in asymptomatic individuals,52 although some may hold an opposite opinion due to more pain and discomfort in CTC.53 The use of ‘low-prep’ or laxative-free CTC is being further investigated.43
 
The CTC can detect asymptomatic polyps and has the potential to prevent them from progressing to advanced adenoma and CRC. These polyps may not be detected by gFOBT or iFOBT until they result in microscopic haemorrhage in the lower GI tract. This is an advantage of CTC compared with gFOBT and iFOBT. The role of CTC in reducing CRC mortality remains uncertain, however.
 
Colon capsule endoscopy
The CCE makes use of a double-headed capsule with a wide viewing angle, visualising the colon beyond the haustral folds.54 Its sensitivity and specificity for significant polyps has been reported to be 83% and 89%, respectively.55 56 57 The European Society of Gastrointestinal Endoscopy recommends CCE as an alternative screening method for average-risk individuals.58 In February 2014, it also received the US Food and Drug Administration clearance for use in patients following incomplete colonoscopy. It is also proven to be beneficial when the patient is unwilling or is unable to undergo colonoscopy.59 60 With its presumed increased uptake, it is a promising new CRC screening modality.61 The newest generation of CCE has improved resolution by adapting its frame rate to the speed of capsule movement. Some newer capsules also have four cameras to provide a 360-degree view.62
 
Despite its promising role in screening, some disadvantages of CCE have limited its use thus far. Strict bowel preparation, diet restrictions, and use of suppositories and prokinetics may be needed to ensure a smooth and quick journey of the capsule through the bowel, while minimising the interference of debris when identifying lesions.63 Potential complications include capsule impaction and retention (1.4%64) that may require endoscopic or surgical removal. It is also not recommended in pregnancy or with implanted electromedical devices such as pacemakers.62 The cost of CCE is much higher than that of colonoscopy,65 and includes the reading of the captured video footage. There is also no current evidence to prove the mortality benefit of CCE use in CRC.
 
Flexible sigmoidoscopy
The FS examines the distal 40 to 60 cm of the lower GI tract. Full colonoscopy can be performed when there are positive findings. Compared with colonoscopy, it requires a simpler bowel preparation and dietary restriction is not necessary.66
 
In two large-scale RCTs that involved 170 432 and 55 736 individuals, in PP analysis, there was a 43.0% reduction in CRC mortality and improved hazard ratio of 0.41.67 68 This was echoed by another RCT that involved 77 445 patients and showed a 21% reduction in the incidence of both proximal and distal cancer and a 50% reduction in mortality from distal cancer.69 The PPV was 91.9% for any adenoma.70 The positivity rate for adenoma was 17.3%.71 Most studies were in individuals aged ≥5070 71 72 or ≥55 years.68 69 73
 
The sensitivity of FS depends on the adequacy of mucosal inspection and is operator-dependent.73 Studies have shown inadequate screening in up to 91.7% of cases, ie <50 cm depth of insertion.73 The technique had relatively low and fluctuating participation rates (20.9%-63.0%).70 71 A 35.3% decrease in adherence from baseline to subsequent study was observed.69
 
The impact of FS as a screening tool is well established in the literature and accepted in various screening protocols.44 46 This technique should be included as an alternative choice for a population-wide screening programme, and the shortage of endoscopists could be partially addressed by training specialised nurses in the procedure.74
 
Combining flexible sigmoidoscopy with guaiac and immunohistochemical faecal occult blood testing
Flexible sigmoidoscopy cannot replace the role of colonoscopy in individuals with a positive faecal occult blood test.72 In a non-randomised trial, the detection rate of combined gFOBT and FS for cancer was higher than that of gFOBT alone (1.5 vs 0.7 per 1000), but was not superior to FS alone (1.5 vs 5.2 per 1000).70 Results were similar for advanced neoplasia.
 
Double-contrast barium enema
The DCBE involves an X-ray study of the colon and rectum following injection of air and barium transrectally. Once regarded as a routine screening tool, its role has diminished since the introduction of other screening modalities. While it was the safest screening method next to FOBT with a perforation rate of 1 in 25 000,75 the sensitivity for polyps of ≥10 mm was only 48%, rendering it suboptimal for screening.76 77
 
Combining double-contrast barium enema with flexible sigmoidoscopy
When DCBE was combined with FS, they had the same sensitivity for cancer as colonoscopy (96.7%).78 Two RCTs in the 1990s reported a lower detection rate for small polyps for FS plus DCBE when compared with colonoscopy.79 80 Nonetheless the detection rate for cancers and large polyps was comparable.79 Sensitivity analyses in both studies revealed that in screening, FS plus DCBE was less cost-effective than colonoscopy.
 
Current guidelines
The Asia Pacific Consensus Recommendations in 2015 suggested the use of iFOBT over gFOBT, and FS and colonoscopy were deemed effective.46 On the contrary, CTC and CCE were not recommended for screening. In the US, surveillance programme guidelines from the American Cancer Society provided two sets of test options for asymptomatic adults aged ≥50 years.44 For adenomatous polyps and cancer, FS, DCBE, or CTC every 5 years, or colonoscopy every 10 years was recommended. For cancer alone, annual gFOBT or iFOBT testing was recommended. The American College of Gastroenterology supported replacement of gFOBT by iFOBT as a first-line screening test.81 The National Health Service in the UK recommends screening for average-risk men and women aged 60 to 74 years with FOBT every 2 years.82 The European Union did not offer a comprehensive system, with a recommendation of FOBT for men and women aged 50 to 74 years.83 The Australian government encouraged biennial iFOBT for an asymptomatic population aged >50 years.84
 
There is no formal consensus on a CRC screening programme in Hong Kong. The Hong Kong Cancer Fund, a cancer support organisation, recommends screening of the average-risk population aged ≥50 years, with either FOBT every year, FS or DCBE every 5 years, or colonoscopy every 10 years.85
 
Discussion
Colonoscopy remains the gold standard diagnostic tool for CRC, but its costs, discomfort, inconvenience, and potential complications render it impractical as the first-line investigation in a population-wide CRC screening programme for average-risk individuals. Multiple alternative tools have since been developed, aimed at minimising discomfort and inconvenience and thus achieving better compliance, while at the same time not jeopardising the screening effectiveness. While it is not possible for these tools to replace colonoscopy for diagnosis, they may assume an essential role in a screening programme as an index investigation for risk stratification, thus selecting patients to undergo further diagnostic colonoscopy.
 
These screening modalities differ in their development. Both gFOBT and FS are time-honoured, heavily researched, and proven to reduce CRC mortality. Large amounts of research data are emerging in support of newer options such as iFOBT and CTC. While comparison of gFOBT and iFOBT is easily achievable, direct comparison of CTC and iFOBT is more difficult as there are different ‘performance’ parameters.
 
The technique iFOBT is evolved from gFOBT and shares a similar mechanism. While gFOBT has been well proven by long-duration RCTs to reduce CRC mortality, it has been postulated that iFOBT may achieve the same effect. For a population-wide screening programme to be successful, the test has to be acceptable to asymptomatic individuals. This eventually determines the penetration and compliance with the programme. Compared with gFOBT, iFOBT undeniably has a higher participation rate,13 20 33 and even more so compared with FS.70 71 In a population-wide screening programme with iFOBT, implementation could be achieved in a relatively short period of time as it could be performed by primary care physicians and nurses. Installation of sophisticated hardware is not required. Given a positivity rate of 5.5% to 11.0%,12 13 17 19 28 29 however, it would have a significant impact on health care services. A major increase in the number of referrals for colonoscopy would be anticipated and thus require a corresponding increase in the availability of endoscopy centres and endoscopists.
 
Test characteristics are not the only factor that dictates the success of a screening programme; compliance plays a crucial role. Studies have shown that those who communicate well with their health care providers are more likely to adhere to a screening programme.86 When implementing a population-wide programme, recruiting primary care physicians to promote CRC screening and perform office-based iFOBT would be logical and is feasible.
 
Conclusion
Each CRC screening modality has its own niche, providing unique prognostic benefits but with their own shortcomings. Based on the available evidence to date, feasibility, and participant acceptance, iFOBT appears to be the most suitable CRC index screening tool for the average-risk population, with FS as an alternative.
 
References
1. Bernard WS, Christopher PW. World Cancer Report 2014: Colorectal cancer. Lyon, France: International Agency for Research on Cancer, WHO; 2014: 392-402.
2. Jass JR. Classification of colorectal cancer based on correlation of clinical, morphological and molecular features. Histopathology 2007;50:113-30. Crossref
3. Vogelstein B, Fearon ER, Hamilton SR, et al. Genetic alterations during colorectal-tumor development. N Engl J Med 1988;319:525-32. Crossref
4. Snover DC. Update on the serrated pathway to colorectal carcinoma. Hum Pathol 2011;42:1-10. Crossref
5. Brenner H, Hoffmeister M, Stegmaier C, Brenner G, Altenhofen L, Haug U. Risk of progression of advanced adenomas to colorectal cancer by age and sex: estimates based on 840,149 screening colonoscopies. Gut 2007;56:1585-9. Crossref
6. Waldmann E, Regula J, Ferlitsch M. How can screening colonoscopy be optimized? Dig Dis 2015;33:19-27. Crossref
7. Shaukat A, Mongin SJ, Geisser MS, et al. Long-term mortality after screening for colorectal cancer. N Engl J Med 2013;369:1106-14. Crossref
8. Scholefield JH, Moss SM, Mangham CM, Whynes DK, Hardcastle JD. Nottingham trial of faecal occult blood testing for colorectal cancer: a 20-year follow-up. Gut 2012;61:1036-40. Crossref
9. Lindholm E, Brevinge H, Haglind E. Survival benefit in a randomized clinical trial of faecal occult blood screening for colorectal cancer. Br J Surg 2008;95:1029-36. Crossref
10. Kronborg O, Jørgensen OD, Fenger C, Rasmussen M. Randomized study of biennial screening with a faecal occult blood test: results after nine screening rounds. Scand J Gastroenterol 2004;39:846-51. Crossref
11. Parra-Blanco A, Gimeno-García AZ, Quintero E, et al. Diagnostic accuracy of immunochemical versus guaiac faecal occult blood tests for colorectal cancer screening. J Gastroenterol 2010;45:703-12. Crossref
12. Hol L, Wilschut JA, van Ballegooijen M, et al. Screening for colorectal cancer: random comparison of guaiac and immunochemical faecal occult blood testing at different cut-off levels. Br J Cancer 2009;100:1103-10. Crossref
13. van Rossum LG, van Rijn AF, Laheij RJ, et al. Random comparison of guaiac and immunochemical fecal occult blood tests for colorectal cancer in a screening population. Gastroenterology 2008;135:82-90. Crossref
14. Dancourt V, Lejeune C, Lepage C, Gailliard MC, Meny B, Faivre J. Immunochemical faecal occult blood tests are superior to guaiac-based tests for the detection of colorectal neoplasms. Eur J Cancer 2008;44:2254-8. Crossref
15. Duffy MJ, van Rossum LG, van Turenhout ST, et al. Use of faecal markers in screening for colorectal neoplasia: a European group on tumor markers position paper. Int J Cancer 2011;128:3-11. Crossref
16. Leggett BA, Hewett DG. Colorectal cancer screening. Intern Med J 2015;45:6-15. Crossref
17. Tan WS, Tang CL, Koo WH. Opportunistic screening for colorectal neoplasia in Singapore using faecal immunochemical occult blood test. Singapore Med J 2013;54:220-3. Crossref
18. Levi Z, Rozen P, Hazazi R, et al. A quantitative immunochemical fecal occult blood test for colorectal neoplasia. Ann Intern Med 2007;146:244-55. Crossref
19. Fu WP, Kam MH, Ling WM, Ong SF, Suzannah N, Eu KW. Screening for colorectal cancer using a quantitative immunochemical faecal occult blood test: a feasibility study in an Asian population. Tech Coloproctol 2009;13:225-30. Crossref
20. Kuipers EJ, Rösch T, Bretthauer M. Colorectal cancer screening—optimizing current strategies and new directions. Nat Rev Clin Oncol 2013;10:130-42. Crossref
21. Guittet L, Bouvier V, Mariotte N, et al. Performance of immunochemical faecal occult blood test in colorectal cancer screening in average-risk population according to positivity threshold and number of samples. Int J Cancer 2009;125:1127-33. Crossref
22. Grazzini G, Visioli CB, Zorzi M, et al. Immunochemical faecal occult blood test: number of samples and positivity cutoff. What is the best strategy for colorectal cancer screening? Br J Cancer 2009;100:259-65. Crossref
23. Faivre J, Dancourt V, Manfredi S, et al. Positivity rates and performances of immunochemical faecal occult blood tests at different cut-off levels within a colorectal cancer screening programme. Dig Liver Dis 2012;44:700-4. Crossref
24. van Roon AH, Goede SL, van Ballegooijen M, et al. Random comparison of repeated faecal immunochemical testing at different intervals for population-based colorectal cancer screening. Gut 2013;62:409-15. Crossref
25. van Roon AH, Hol L, van Vuuren AJ, et al. Are fecal immunochemical test characteristics influenced by sample return time? A population-based colorectal cancer screening trial. Am J Gastroenterol 2012;107:99-107. Crossref
26. Haug U, Kuntz KM, Knudsen AB, Hundt S, Brenner H. Sensitivity of immunochemical faecal occult blood testing for detecting left- vs right-sided colorectal neoplasia. Br J Cancer 2011;104:1779-85. Crossref
27. de Wijkerslooth TR, Stoop EM, Bossuyt PM, et al. Immunochemical fecal occult blood testing is equally sensitive for proximal and distal advanced neoplasia. Am J Gastroenterol 2012;107:1570-8. Crossref
28. Allison JE, Sakoda LC, Levin TR, et al. Screening for colorectal neoplasms with new fecal occult blood tests: Update on performance characteristics. J Natl Cancer Inst 2007;99:1462-70. Crossref
29. Raginel T, Puvinel J, Ferrand O, et al. A population-based comparison of immunochemical fecal occult blood tests for colorectal cancer screening. Gastroenterology 2013;144:918-25. Crossref
30. Brenner H, Tao S. Superior diagnostic performance of faecal immunochemical tests for haemoglobin in a head-to-head comparison with guaiac based faecal occult blood test among 2235 participants of screening colonoscopy. Eur J Cancer 2013;49:3049-54. Crossref
31. Park DI, Ryu S, Kim YH, et al. Comparison of guaiac-based and quantitative immunochemical fecal occult blood testing in a population at average risk undergoing colorectal cancer screening. Am J Gastroenterol 2010;105:2017-25. Crossref
32. Faivre J, Dancourt V, Denis B, et al. Comparison between a guaiac and three immunochemical faecal occult blood tests in screening for colorectal cancer. Eur J Cancer 2012;48:2969-76. Crossref
33. Hol L, van Leerdam ME, van Ballegooijen M, et al. Screening for colorectal cancer: randomised trial comparing guaiac-based and immunochemical faecal occult blood testing and flexible sigmoidoscopy. Gut 2010;59:62-8. Crossref
34. Berchi C, Bouvier V, Réaud JM, Launoy G. Cost-effectiveness analysis of two strategies for mass screening for colorectal cancer in France. Health Econ 2004;13:227-38. Crossref
35. Berchi C, Guittet L, Bouvier V, Launoy G. Cost-effectiveness analysis of the optimal threshold of an automated immunochemical test for colorectal cancer screening: performances of immunochemical colorectal cancer screening. Int J Technol Assess Health Care 2010;26:48-53. Crossref
36. Grazzini G, Ciatto S, Cislaghi C, et al. Cost evaluation in a colorectal cancer screening programme by faecal occult blood test in the District of Florence. J Med Screen 2008;15:175-81. Crossref
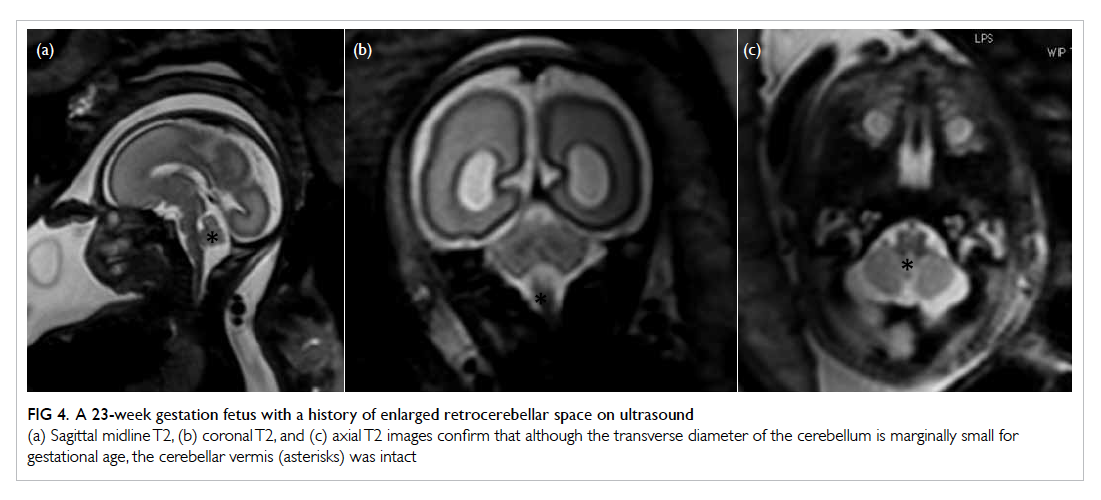
37. van Rossum LG, van Rijn AF, Verbeek AL, et al. Colorectal cancer screening comparing no screening, immunochemical and guaiac fecal occult blood tests: a cost-effectiveness analysis. Int J Cancer 2011;128:1908-17. Crossref
38. Lieberman D. Colorectal cancer screening: practice guidelines. Dig Dis 2012;30 Suppl 2:34-8. Crossref
39. Vining DJ, Shifrin RY, Grishaw EK, Liu K, Gelfand DW. Virtual colonoscopy. Radiology 1994;193(P):446.
40. Sosna J, Blachar A, Amitai M, et al. Colonic perforation at CT colonography: assessment of risk in a multicenter large cohort. Radiology 2006;239:457-63. Crossref
41. Berrington de Gonzalez A, Kim KP, Yee J. CT colonography: perforation rates and potential radiation risks. Gastrointest Endosc Clin N Am 2010;20:279-91. Crossref
42. Pickhardt PJ, Hanson ME, Vanness DJ, et al. Unsuspected extracolonic findings at screening CT colonography: clinical and economic impact. Radiology 2008;249:151-9. Crossref
43. Zalis ME, Blake MA, Cai W, et al. Diagnostic accuracy of laxative-free computed tomographic colonography for detection of adenomatous polyps in asymptomatic adults, a prospective evaluation. Ann Intern Med 2012;156:692-702. Crossref
44. Levin B, Lieberman DA, McFarland B, et al. Screening and surveillance for the early detection of colorectal cancer and adenomatous polyps, 2008: a joint guideline from the American Cancer Society, the US Multi-Society Task Force on Colorectal Cancer, and the American College of Radiology. Gastroenterology 2008;134:1570-95. Crossref
45. Steinwachs D, Allen JD, Barlow WE, et al. NIH state-of-the-science conference statement: Enhancing use and quality of colorectal cancer screening. NIH Consens State Sci Statements 2010;27:1-31.
46. Sung JJ, Ng SC, Chan FK, et al. An updated Asia Pacific Consensus Recommendations on colorectal cancer screening. Gut 2015;64:121-32. Crossref
47. Pickhardt PJ, Choi JR, Hwang I, et al. Computed tomographic virtual colonoscopy to screen for colorectal neoplasia in asymptomatic adults. N Engl J Med 2003;349:2191-200. Crossref
48. Johnson CD, Chen MH, Toledano AY, et al. Accuracy of CT colonography for detection of large adenomas and cancers. N Engl J Med 2008;359:1207-17. Crossref
49. Martín-López JE, Beltrán-Calvo C, Rodríguez-López R, Molina-López T. Comparison of the accuracy of CT colonography and colonoscopy in the diagnosis of colorectal cancer. Colorectal Dis 2014;16:O82-9. Crossref
50. de Haan MC, van Gelder RE, Graser A, Bipat S, Stoker J. Diagnostic value of CT-colonography as compared to colonoscopy in an asymptomatic screening population: a meta-analysis. Eur Radiol 2011;21:1747-63. Crossref
51. Hanly P, Skally M, Fenlon H, Sharp L. Cost-effectiveness of computed tomography colonography in colorectal cancer screening: a systematic review. Int J Technol Assess Health Care 2012;28:415-23. Crossref
52. Lin OS, Kozarek RA, Gluck M, et al. Preference for colonoscopy versus computerized tomographic colonography: a systematic review and meta-analysis of observational studies. J Gen Intern Med 2012;27:1349-60. Crossref
53. Ou G, Rosenfeld G, Fu YT, et al. Patient satisfaction and preferences: colonoscopy or computed tomography colonography for colorectal cancer screening. Gastrointest Endosc 2012;75 Suppl:AB140. Crossref
54. Hale MF, Sidhu R, McAlindon ME. Capsule endoscopy: current practice and future directions. World J Gastroenterol 2014;20:7752-9. Crossref
55. Eliakim R, Yassin K, Niv Y, et al. Prospective multicenter performance evaluation of the second-generation colon capsule compared with colonoscopy. Endoscopy 2009;41:1026-31. Crossref
56. Spada C, Hassan C, Munoz-Navas M, et al. Second-generation colon capsule endoscopy compared with colonoscopy. Gastrointest Endosc 2011;74:581-9.e1. Crossref
57. Rex DK, Adler SN, Aisenberg J, et al. Accuracy of PillCam COLON 2 for detecting subjects with adenomas ≥6 mm. Gastrointest Endosc 2013;77 Suppl 1:AB29.
58. Spada C, Hassan C, Galmiche JP, et al. Colon capsule endoscopy: European Society of Gastrointestinal Endoscopy (ESGE) Guideline. Endoscopy 2012;44:527-36. Crossref
59. Pioche M, de Leusse A, Filoche B, et al. Prospective multicenter evaluation of colon capsule examination indicated by colonoscopy failure or anesthesia contraindication. Endoscopy 2012;44:911-6. Crossref
60. Negreanu L, Babiuc R, Bengus A, Sadagurschi R. PillCam Colon 2 capsule in patients unable or unwilling to undergo colonoscopy. World J Gastrointest Endosc 2013;5:559-67. Crossref
61. Sieg A, Friedrich K, Sieg U. Is PillCam COLON capsule endoscopy ready for colorectal cancer screening? A prospective feasibility study in a community gastroenterology practice. Am J Gastroenterol 2009;104:848-54. Crossref
62. Bouchard S, Ibrahim M, van Gossum A. Video capsule endoscopy: perspectives of a revolutionary technique. World J Gastroenterol 2014;20:17330-44. Crossref
63. Spada C, Barbaro F, Andrisani G, et al. Colon capsule endoscopy: What we know and what we would like to know. World J Gastroenterol 2014;20:16948-55. Crossref
64. Liao Z, Gao R, Xu C, Li ZS. Indications and detection, completion, and retention rates of small-bowel capsule endoscopy: a systematic review. Gastrointest Endosc 2010;71:280-6. Crossref
65. Triantafyllou K, Beintaris I, Dimitriadis GD. Is there a role for colon capsule endoscopy beyond colorectal cancer screening? A literature review. World J Gastroenterol 2014;20:13006-14. Crossref
66. Regge D, Iussich G, Senore C, et al. Population screening for colorectal cancer by flexible sigmoidoscopy or CT colonography: study protocol for a multicenter randomized trial. Trials 2014;15:97. Crossref
67. Atkin WS, Edwards R, Kralj-Hans I, et al. Once-only flexible sigmoidoscopy screening in prevention of colorectal cancer: a multicentre randomised controlled trial. Lancet 2010;375:1624-33. Crossref
68. Hoff G, Grotmol T, Skovlund E, Bretthauer M; Norwegian Colorectal Cancer Prevention Study Group. Risk of colorectal cancer seven years after flexible sigmoidoscopy screening: randomised controlled trial. BMJ 2009;338:b1846.
69. Schoen RE, Pinsky PF, Weissfeld JL, et al. Colorectal-cancer incidence and mortality with screening flexible sigmoidoscopy. N Engl J Med 2012;366:2345-57. Crossref
70. Denis B, Gendre I, Aman F, Ribstein F, Maurin P, Perrin P. Colorectal cancer screening with the addition of flexible sigmoidoscopy to guaiac-based faecal occult blood testing: A French population-based controlled study (Wintzenheim trial). Eur J Cancer 2009;45:3282-90. Crossref
71. Holme Ø, Løberg M, Kalager M, et al. Effect of flexible sigmoidoscopy screening on colorectal cancer incidence and mortality: a randomized clinical trial. JAMA 2014;312:606-15. Crossref
72. Mansouri D, McMillan DC, Roxburgh CS, Moug SJ, Crighton EM, Horgan PG. Flexible sigmoidoscopy following a positive faecal occult blood test within a bowel screening programme may reduce the detection of neoplasia. Colorectal Dis 2013;15:1375-81. Crossref
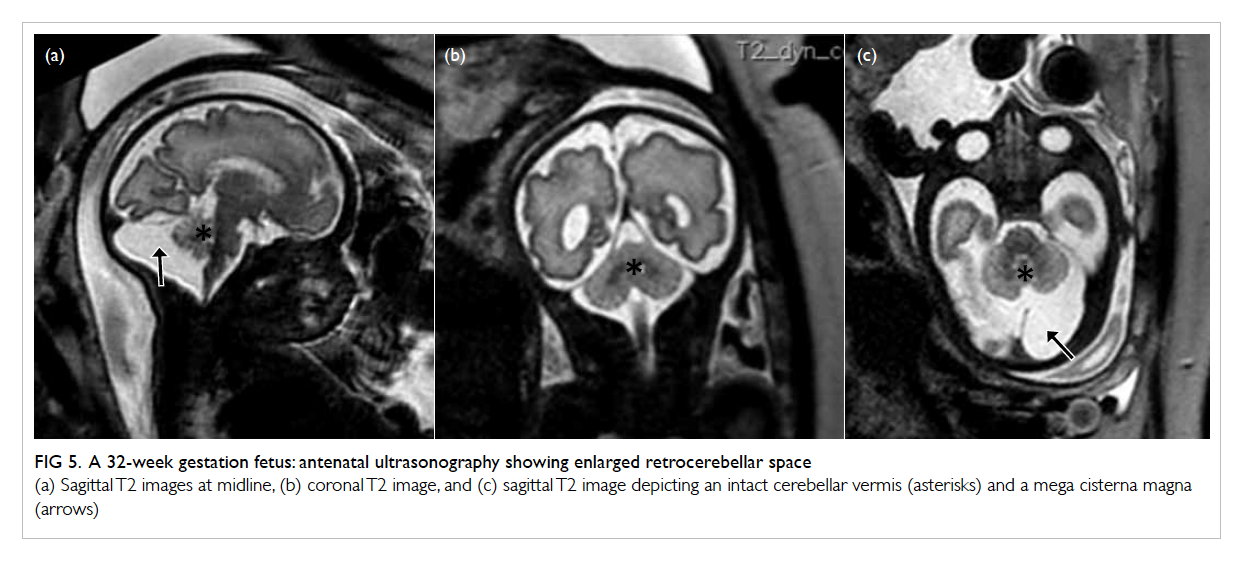
73. Laiyemo AO, Doubeni C, Pinsky PF, et al. Factors associated with inadequate colorectal cancer screening with flexible sigmoidoscopy. Cancer Epidemiol 2012;36:395-9. Crossref
74. Shum NF, Lui YL, Choi HK, Lau SC, Ho JW. A comprehensive training programme for nurse endoscopist performing flexible sigmoidoscopy in Hong Kong. J Clin Nurs 2010;19:1891-6. Crossref
75. Blakeborough A, Sheridan MB, Chapman AH. Complications of barium enema examinations: A survey of UK consultant radiologists 1992 to 1994. Clin Radiol 1997;52:142-8. Crossref
76. Winawer SJ, Stewart ET, Zauber AG, et al. A comparison of colonoscopy and double-contrast barium enema for surveillance after polypectomy. National Polyp Study Work Group. N Engl J Med 2000;342:1766-72. Crossref
77. Canon CL. Is there still a role for double-contrast barium enema examination? Clin Gastroenterol Hepatol 2008;6:389-92. Crossref
78. Robinson MH, Hardcastle JD, Moss SM, et al. The risks of screening: data from the Nottingham randomised controlled trial of faecal occult blood screening for colorectal cancer. Gut 1999;45:588-92. Crossref
79. Rex DK, Weddle RA, Lehman GA, et al. Flexible sigmoidoscopy plus air contrast barium enema versus colonoscopy for suspected lower gastrointestinal bleeding. Gastroenterology 1990;98:855-61. Crossref
80. Rex DK, Mark D, Clarke B, Lappas JC, Lehman GA. Flexible sigmoidoscopy plus air-contrast barium enema versus colonoscopy for evaluation of symptomatic patients without evidence of bleeding. Gastrointest Endosc 1995;42:132-8. Crossref
81. Rex DK, Johnson DA, Anderson JC, Schoenfeld PS, Burke CA, Inadomi JM; American College of Gastroenterology. American College of Gastroenterology guidelines for colorectal cancer screening 2009 [corrected]. Am J Gastroenterol 2009;104:739-50. Crossref
82. Bowel cancer—screening. Available from: http://www.nhs.uk/Conditions/Cancer-of-the-colon-rectum-or-bowel/Pages/Screeningforbowelcancer.aspx. Accessed Dec 2015.
83. von Karsa L, Patnick J, Segnan N. European guidelines for quality assurance in colorectal cancer screening and diagnosis. First Edition—Executive summary. Endoscopy 2012;44 Suppl 3:SE1-8.
84. Thomas R, Michael S, Finlay M, et al. Australian Clinical Practice Guidelines for the Prevention, Early Detection and Management of Colorectal Cancer. Natl Heal Med Res Counc Aust Gov; 2005.
85. Early detection and prevention. Available from: http://www.cancer-fund.org/colorectal/html/eng/detection.html. Accessed Dec 2015.
86. Francisco D, Rankin L, Kim SC. Adherence to colorectal cancer and polyps screening recommendations among filipino-americans. Gastroenterol Nurs 2014;37:384-90. Crossref
Pages