Medical manslaughter in Hong Kong—how, why, and why not

Hong Kong Med J 2018 Aug;24(4):384–90  |  Epub 27 Jul 2018
DOI: 10.12809/hkmj187346
© Hong Kong Academy of Medicine. CC BY-NC-ND 4.0
 
REVIEW ARTICLE
Medical manslaughter in Hong Kong—how, why, and why not
Gilberto KK Leung, LLM, FHKAM (Surgery)
Department of Surgery, The University of Hong Kong, Pokfulam, Hong Kong
 
Corresponding author: Prof Gilberto KK Leung (gilberto@hku.hk)
 
 Full paper in PDF
 
Abstract
The increasing number of medical manslaughter cases in recent years raises concerns about the concept of criminal liability in medical negligence. Contemporary cases in Hong Kong have also generated debate on whether criminal law intervention is justified and effective at dealing with substandard medical practices. This paper examines the legal principles underlying the applicable legal offence of gross negligence manslaughter and the implications that recent events may have on patient care and the medical profession. The author argues that the criminalisation of medical mistakes can have a detrimental effect on clinical practice and patient welfare. At stake is the potential for a loss of mutual trust between the medical profession and the rest of society. Gross negligence manslaughter is an unstable legal concept, and criminal sanctions should at most be applied to conscious violations of established rules and standards but not unintentional errors. As we await the outcomes of ongoing cases in Hong Kong, there is an urgent need to uphold standards of practice and to nurture a robust culture of ethical awareness, compassionate care, and professionalism.


Introduction
Medical manslaughter is involuntary manslaughter by gross negligence where patient death has resulted from a grossly negligent (but otherwise lawful) act or omission.1 Although related prosecutions remain uncommon, the emergence of recent cases in Hong Kong presents an opportunity to reflect upon whether criminal sanctions are justifiable and effective at dealing with substandard medical practices. This paper begins with an examination of the underlying legal principles, followed by a discussion on how the current direction of travel might impact patient care and the medical profession.
 
Gross negligence manslaughter
The applicable legal offence in medical manslaughter is that of gross negligence manslaughter (GNM).1 As for civil claims in medical negligence, the legal test to satisfy is that the affected party is owed a duty of care and that a breach of that duty has occurred and caused the injury at issue.2 In addition, it must be further established in GNM that the degree of negligence has gone:
 
“…beyond a mere matter of compensation between subjects and has showed such disregard for the life and safety of others as to amount to a crime against the state and conduct deserving punishment”.3
 
The legal test was affirmed in the landmark case of Adomako, in which an anaesthesiologist failed to respond to a disconnection of the oxygen supply during general anaesthesia, whereby the jury had to decide whether “the degree of negligence is so great that a criminal penalty is warranted”.4 It is ultimately about the transformation of a private wrong into a public one.
 
Contemporary cases
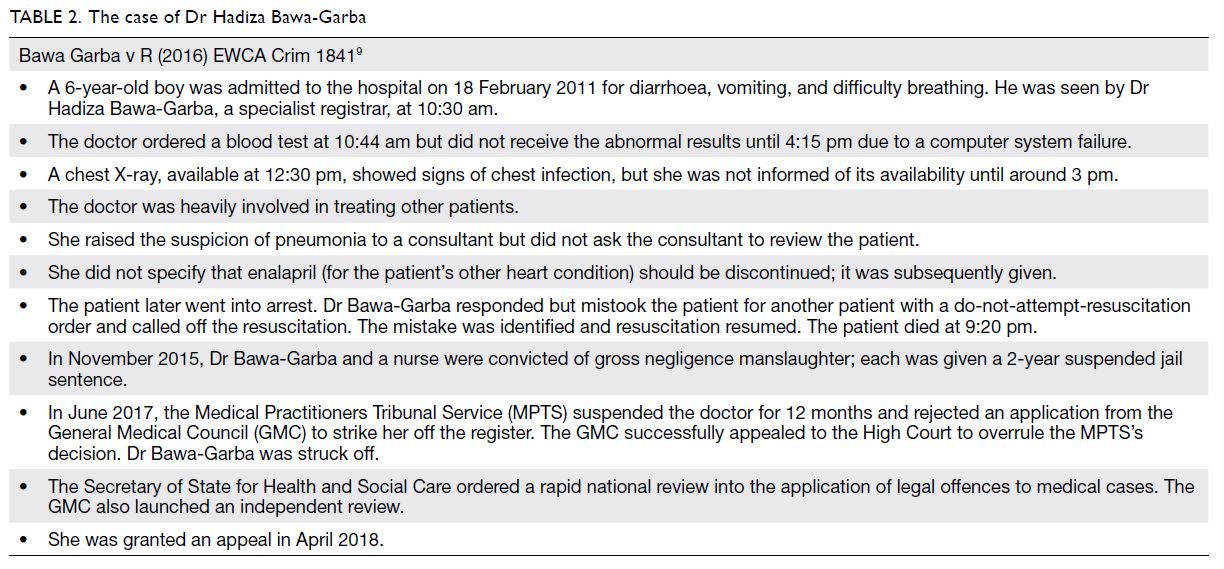
Medical manslaughter cases have historically been rare, but a rising trend has been observed in recent years. In the UK, 85 doctors were charged between 1795 and 2005,5 while 11 cases have already materialised between 2006 and 2013.6 A similar situation has occurred in the United States, where over 50 prosecutions have been brought since 1990.7 The majority of UK cases involved obstetrics and errors in the prescription or administration of drugs.5 Tables 1 and 2 outline the two recent and controversial cases of Mr David Sellu8 and Dr Hadiza Bawa-Garba,9 respectively.
 

Table 1. The case of Mr David Sellu
 

Table 2. The case of Dr Hadiza Bawa-Garba
 
The first case in Hong Kong involved the misuse of sedative drugs during an illegal abortion for which the doctor was jailed for 2 years in 2003 (Table 3).10 A hiatus followed. The highly publicised “DR Group” case saw the conviction of a beauty clinic’s owner and technician in 2017; the third defendant, a doctor who gave the treatment, is awaiting a re-trial (Table 4).11 In March 2018, a general practitioner was charged after her patient died following a liposuction 4 years prior.12 Presently, the family of a 73-year-old man is alleging criminal responsibility on the part of a group of nurses13 and a doctor14 who were already found guilty of professional misconduct in connection with his death.
 

Table 3. The case of Dr Harry Sudirman
 

Table 4. The “DR Group” case
 
Could this be the beginning of a trend in Hong Kong? If so, what could we be wrestling with here?
 
Medical negligence as crime
The central and hotly debated question is whether criminal law intervention is justified in cases of fatal medical incidents.15 On the one hand, a doctor’s license to practice has a legal foundation. Criminal sanctions serve an important punitive function and a symbolic role in restoring public trust when that foundation is not being respected. By holding individuals publicly accountable, criminal sanctions may ensure compliance with professional standards and deter poor and dangerous practices.16 In France, for example, a range of criminal offences is available to punish medical mistakes, even when they are non-fatal. Jail terms are uncommon; the ultimate force of deterrence lies in the stigma of the charge or conviction itself.17
 
On the other hand, it can be argued that the criminal law is supposed to punish those who cause damages with a morally blameworthy state of mind, whereas misjudgement, inadvertence, or sheer incompetence may be the reasons for a doctor failing to meet standards of care.18 Criminal sanctions presume, if not forcibly embed, the role of choice in situations where no choice or decision has been consciously made. This overlooks the notion of blameworthiness as the foundation of the criminal law, and prosecutions were arguably unjustified in at least some cases.19 At issue is the appropriateness of the legal test and the threshold for prosecution.
 
The legal test
The term “gross negligence” has not been defined, and the legal test established in Adomako has been criticised for its circularity, in that an act or omission constitutes a crime if the jury finds it a crime.7 The determination of “grossness” is one for the jury, as directed by the judge; it is a question of law and not for medical experts to address. However, medical experts have occasionally employed their varied understanding of the legal term and provided opinions that could potentially usurp the jury’s role.20 In the UK, the conviction of Mr David Sellu was reversed because the trial judge had failed to direct the jury properly with regard to the determination of “grossness” and the weight given to the expert opinions on that issue (Table 1).8 Clearer guidance has since become available; how this will affect judicial practice and outcomes within the UK and other common law jurisdictions, such as Hong Kong, remains to be discovered.
 
Another contentious aspect of the existing law concerns the mens rea (or “guilty mind”) requirement for GNM. A detailed discussion on this highly complex topic is beyond the scope of this paper, and readers are referred to previous works by legal scholars.18 21 22 23 It suffices to say that the culpable mental state in GNM is one of indifference. This can be understood as a state of “wilful blindness” or a high degree of negligence in considering and avoiding obvious risks.18 It is (arguably) distinguishable from recklessness, which is acting in the face of subjectively known risks, but less readily so from what is commonly regarded as “inadvertence” or “absent-mindedness” by lay people.23
 
Take for example a hypothetical scenario in which a patient died from septicaemia following a transfusion procedure. While those who consciously disregarded standard safety procedures in preparing the blood product should probably be held criminally liable, it is debatable whether the doctor who gave the transfusion should be so treated. Did the doctor know or suspect the risk of contamination? If not, should he or she have been aware of or considered the possibility of that risk? Was he or she “indifferent”? What is the level of due diligence reasonably expected from a doctor administering a treatment passed to him or her by someone else? How much checking is needed, and how should “grossness” be determined in a situation like this? And from an ethical point of view, should the severity of the consequence alone (ie, patient death) transform a common human failing such as “inattention” into a crime? If so, what could this mean in daily clinical practice?
 
There is no ready answer, and the concept of liability in criminal negligence remains controversial, especially in the medical context.23 In the UK, charges against two pharmacists, whose dispensing of a defective medicine caused a child’s death, were dropped because of the absence of malicious intent to cause harm,24 whereas two junior doctors who inadvertently injected vincristine into a patient’s spine were convicted on the grounds that criminal liability may be found not at the time of the injection but when they had “chosen” not to be more careful before acting.25 The distinction between these individuals’ corresponding mental states is not overly clear, and the legal bar for gross negligence remains disputable.14
 
The situation is further complicated by the fact that a defendant’s mental state may be judged either objectively (ie, what a reasonably competent doctor should have been thinking at the time) or subjectively (ie, what the doctor in question was actually thinking at the time).18 In the sensationalised case of Dr Conrad Murray, convicted for causing the death of the singer Michael Jackson, it was sufficient for the prosecution to prove that the doctor “should have been aware” of the risks associated with using Propofol outside of a hospital setting, not whether he had actual knowledge of those risks (ie, an objective test).26 In contrast, the High Court of Hong Kong had consciously departed from the established English authorities and applied the subjective test in a recent non-medical case.27 The debate continues.28
 
Threshold for prosecution
A charge of GNM even without conviction can be devastating for the doctor involved. In principle, prosecution is brought when it is in the public interest to do so and when there is a realistic prospect of success, but the loosely defined concept of gross negligence affords prosecutors considerable discretion.29 Importantly, the criteria for distinguishing between honest mistakes and conscious violations of professional standards are “tests unknown to the criminal law”.30 As a result, doctors (or even lawyers) can have little confidence in knowing what kinds of behaviour will attract the attention of the criminal law.
 
Indeed, prosecutors in the UK have been criticised for prosecuting many doctors who should not have been charged in the first place.19 Such prosecutions have caused significant disruptions to the personal and professional lives of innocent individuals and negative feelings within the medical community.31 The small number of cases in Hong Kong does not permit a valid assessment, but a reasonable, consistent, and transparent threshold for prosecution would certainly be welcomed. The principle reaffirmed in Mr David Sellu’s successful appeal is that a prosecution should not be brought unless the conduct of the doctor involved was “truly exceptionally bad”. The mere commission of an error, even if fatal, does not begin to satisfy that test.
 
Criminal sanctions as a quality assurance measure
From the public’s point of view, an important question is whether criminalisation improves patient safety. There is no empirical evidence to show that it does, and the current understanding of the nature of human error challenges the premise that punishment can prevent mistakes.32 Again, a distinction can be made between errors and violations.
 
Human errors are by nature unintentional. Even the most able and conscientious clinician can commit errors in a complex hospital environment; inexperience, exhaustion, lack of supervision, or systemic failures may be responsible.33 Because errors are committed without awareness of the associated risks, they are unlikely to respond positively to the threat of criminal prosecution.34 This is particularly the case where health care delivery involves multiple disciplines and professionals whose roles and responsibilities, and hence their duties of care and liabilities, cannot be easily delineated. Moreover, human error is often the last part of a chain of events leading up to an adverse outcome; the proper response should be the adoption of a culture of open disclosure, learning, risk management, and system improvement measures.32 A case in point is that of Dr Bawa-Garba, in which system factors such as understaffing, lack of supervision, and hardware malfunction are thought to be at least partially responsible for a tragic patient outcome (Table 2).
 
In contrast, violations are associated with deliberate disregard for patient safety and unjustified risk taking. Adverse outcomes occur primarily because of individual doctors’ autonomous decisions rather than the cumulative effects of system and latent factors. The predominance of human agency renders system improvement measures ineffective if not irrelevant; deterrence targeting individuals’ attitudes and mental states is needed.22 Criminal sanctions in these situations can potentially discourage some doctors’ “couldn’t care less” attitude and promote a greater sense of responsibility and carefulness. The conduct of Dr Sudirman and the two convicted individuals in the “DR Group” case in Hong Kong fall squarely into this category (Table 3 and 4).
 
Admittedly, the distinction between error and violation is not always straightforward, especially when there are questions about clinical competency. Clinical competency involves a range of human qualities, from skills and knowledge to conscientiousness and ethical standards, only some of which are influenced by threat of criminal penalties. It is notable that criminal sanctions in the early vincristine-related cases did not prevent a recurrence: numerous cases have occurred since.33
 
Diligence or vengeance?
It has been suggested that the wider use of the criminal law in the present context represents an attempt by the public to exact retribution rather than a desire to improve patient safety.35 In the UK, findings from several public inquiries, such as the Bristol Royal Infirmary Report36 and the Francis Report,37 revealed widespread unethical and substandard practices within the National Health Service. Public dissatisfaction and a deepening blame culture have allegedly created a greater tendency to hold individuals criminally responsible, turning what was once a private matter of civil litigation into a public act of criminal prosecution by the state.38
 
There has at the same time been a gradual but fundamental shift in the way that the medical profession is perceived by society.39 Better access to medical information and a stronger emphasis on patients’ rights means that doctors are no longer held as high priests of the mysterious art and science of healing but partners in patient journey or providers of services to which taxpayers are entitled. Mistakes are not deemed acceptable simply because medical peers say so; society expects to have the final word. When society thinks that certain behaviours are unacceptable, criminal sanctions can be seen as a ready and legitimate solution.40
 
The medical profession has not taken this well. In the UK, the initial conviction of Mr David Sellu was met with fervent protests.31 This surgeon had an otherwise unblemished track record, was held in high regard by his peers and patients, and the penalty imposed on him was seen by some as unjustifiable and disproportionate (Table 1). Similarly, as mentioned previously, the court in Dr Bawa-Garba’s case has been strongly criticised for its failure to give due consideration to system factors.41 The insistence of the General Medical Council on removing Dr Bawa-Garba from its register caused such an outcry that the UK government decided to launch a national review into the application of the existing law to medical cases (Table 2).42 The loss of mutual trust between the medical profession, its regulatory body and the criminal justice system encapsulated in these cases is probably the most damaging effect of the prevailing climate of blame and fear. Patient care may also suffer as doctors become reluctant to disclose their mistakes. Instead of promoting high-quality care, criminalisation could in fact encourage the practice of defensive medicine, stifle compassionate care, alienate the medical profession, and hamper the promotion of a safety culture.43
 
The road ahead
Reactions from medical peers in Hong Kong towards the two convictions in the “DR Group” case have been restrained. Few appear to condone the negligent practices in that case or disapprove of the penalties imposed (Table 4). There is arguably a sense of detachment, as the circumstances in this case (ie, the preparation of an experimental blood product) are far removed from those commonly experienced by most doctors. As such, we have not seen the kind of emotional responses from within our medical sector that have been found in the UK, where doctors perform routine duties with the knowledge that jail sentences could arise from a single missed diagnosis or a few hours’ delay in performing life-saving surgery.
 
The outcome of the re-trial of the third defendant in the “DR Group” case could generate more lively discussions for several reasons. First, general opinions vary more widely regarding the wrongfulness of the doctor’s conduct. Second, practising clinicians can relate more readily to the circumstances in this part of the case and see the relevance and implications of the re-trial. Third, the legal arguments involved are more complex and subject to debate with respect to the culpability of the doctor’s mental state.28 Irrespective of the outcome, the ruling will send a strong message on how similar cases will be handled in the future and raise concerns within different sectors of society one way or the other. Ahead of us could be a challenging time.
 
In the greater scheme of things, there are perhaps good reasons to believe that the general attitude towards the medical profession in Hong Kong has not (yet) become hostile, and that the catalogue of recent cases here is a rare exception. A previous survey showed that the majority of our patients were very satisfied with the quality of care received.44 The number of complaints submitted to the Medical Council of Hong Kong has remained steady.45 We have not had any public scandal at a comparable scale to those in the UK, and our health care professionals still enjoy a reasonable level of respect.44 There is also a handsome degree of transparency and accountability within our system, while institutional measures are in place to ensure that our medical students are properly trained, foreign graduates suitably qualified, and requirements for continuous education diligently followed.46 47 All of these factors must be acknowledged, treasured, and enhanced.
 
But society’s trust in us is not a given; it has to be earned and maintained. Our doctors and nurses work under challenging conditions and need to be supported.48 The recent controversy about the suspension of a doctor by the Medical Council mentioned above represents a serious trust crisis that must be addressed urgently.14 Meanwhile, we need to train our medical students and trainees well and impart a strong sense of ethical awareness and responsibility so that our patients will remain safe, and know that they are safe, in our hands.49 Public education should culture a better understanding of the nature of human error and the acknowledgment of the fact that Medicine is not a perfect science. Lastly, underpinning our right to practice and power to self-regulate is a social contract with society that is built on trust.50 The expert opinions we give, how we discuss and handle medical incidents, and the ways in which we respond to legislative efforts to improve patient safety will eventually affect how society perceives and reacts to our mistakes and failings.
 
Conclusion
The rising number of medical manslaughter charges and convictions in Hong Kong and overseas poses a concern. Criminal liability for medical negligence is an arguably unstable legal concept, and the prosecutorial threshold and legal test for GNM are imbued with uncertainty. The criminalisation of medical mistakes can potentially create a climate of blame and fear that is damaging to the medical profession and detrimental to patient welfare. From the perspectives of providing deterrence and punishment in the medical context, criminal sanctions should probably be limited to conscious violations of established standards; unintentional errors are better dealt with through professional disciplinary actions or litigation based on the ordinary civil test of negligence. However, this necessitates a fundamental jurisprudential shift that is unlikely to materialise in the near future. As we await the outcomes of ongoing cases in Hong Kong, there is much that we can do to maintain society’s trust in the medical profession by upholding standards of care and nurturing a robust culture of professionalism.
 
Author contributions
The author has made substantial contributions to the concept or design; acquisition of data; analysis or interpretation of data; drafting of the article; and critical revision for important intellectual content.
 
Funding/support
This article received no specific grant from any funding agency in the public, commercial, or not-for-profit sectors.
 
Declaration
The author has disclosed no conflicts of interest. The author had full access to the data, contributed to the paper, approved the final version for publication, and takes responsibility for its accuracy and integrity.
 
References
1. Crown Prosecution Service, UK Government. Homicide: murder and manslaughter. Available from: http://www.cps.gov.uk/legal/h_to_k/homicide_murder_and_manslaughter/#gross. Accessed 16 Mar 2018.
2. Mason JK, Laurie GT. Mason & McCall Smith’s Law and Medical Ethics. 9th ed. Oxford: Oxford University Press; 2013.
3. R v Bateman [1925] 19 Cr App R 8.
4. R v Adomako [1995] 1 AC 171.
5. Ferner RE, McDowell SE. Doctors charged with manslaughter in the course of medical practice, 1795-2005: a literature review. J R Soc Med 2006;99:309-14. Crossref
6. White P. More doctors charged with manslaughter are being convicted, shows analysis. BMJ 2015;351:h4402. Crossref
7. Quick Q. Medicine, mistakes and manslaughter: a criminal combination? Cam Law J 2010;69:186-203. Crossref
8. David Sellu v R [2016] EWCA Crim 1716.
9. Bawa Garba v R [2016] EWCA Crim 1841.
10. HKSAR v Harry Sudirman CACC 486/2003.
11. HKSAR v Chow Heung-Wing, Stephen and 2 others HCCC 437/2015.
12. Mok D. Hong Kong doctor arrested on manslaughter charge over death of dancer after beauty treatment. South China Morning Post. 2018 Mar 13. Available from: http://www.scmp.com/news/hong-kong/law-crime/article/2137050/hong-kong-doctor-arrested-manslaughter-charge-over-death. Accessed 19 Mar 2018.
13. Tsang E. Hong Kong nurses found guilty of misconduct in fatal blunder or one month. South China Morning Post. 2016 June 13. Available from: http://www.scmp.com/news/hong-kong/health-environment/article/1974286/hong-kong-nurses-found-guilty-misconduct-fatal. Accessed 16 Mar 2018.
14. Cheung E. Hong Kong doctor Wong Cheuk-yi banned for six months over death of elderly cancer patient Wang Keng-kao at Kowloon Hospital. South China Morning Post. 2018 May 9. Available from: http://www.scmp.com/news/hong-kong/health-environment/article/2145352/hong-kong-doctor-wong-cheuk-yi-found-guilty. Accessed 10 Mar 2018.
15. Edwards S. Medical manslaughter: a recent history. Ann R Coll Surg Engl 2014;96:118-9. Crossref
16. Dekker SA. Criminalization of medical error: who draws the line? ANZ J Surg 2007;77:831-7. Crossref
17. Spencer JR, Brajeux MA. Criminal liability for negligence—a lesson from across the Channel? Int Comp Law Quart 2010;59:1-24. Crossref
18. McCall Smith A. Criminal negligence and the incompetent doctor. Med Law Rev 1993;1:336-49. Crossref
19. Hubbeling D. Criminal prosecution for medical manslaughter. J R Soc Med 2010;103:216-8. Crossref
20. Quick O. Expert evidence and medical manslaughter: vagueness in action. J Law Soc 2011;38:496-518. Crossref
21. Virgo G. Reconstructing manslaughter on defective foundations. Cam Law J 1995;54:14-6. Crossref
22. Horder J. Gross negligence and criminal culpability. U Toronto Law J 1997;47:495-521. Crossref
23. Smith AM. Criminal or merely human?: the prosecution of negligent doctors. J Cont Health Law Policy 1996;12:131-46.
24. March PJ. Boots pharmacist and trainee cleared of baby’s manslaughter, but fined for dispensing a defective medicine. Pharmaceutical J 2000;264:390-2.
25. R v Prentice, R v Adomako [1995] 1 AC 171.
26. Kim CJ. The trial of Conrad Murray: prosecuting physicians for criminally negligent over-prescription. Am Crim Law Rev 2014;51:517-40.
27. HKSAR v Lai Shui Yin HCCC 29/2011.
28. Leung JA, Liu HT. Gross negligence manslaughter after Lai Shui Yin. Hong Kong Law J 2014;44:709-17.
29. Quick O. Prosecuting ‘gross’ medical negligence: manslaughter, discretion, and the crown prosecution service. J Law Soc 2006;33:421-50. Crossref
30. O’Doherty S. Doctors and manslaughter—response from the Crown Prosecution Service. J R Soc Med 2006;99:544. Crossref
31. McDonald P. Doctors and manslaughter. Bull R Coll Surgeons 2014;96:112-3. Crossref
32. Reason J. Human error: models and management. BMJ 2000;320:768-70. Crossref
33. Leape LL. Error in medicine. JAMA 1994;272:1851-7. Crossref
34. Merry AF. How does the law recognize and deal with medical errors? J R Soc Med 2009;102:265-71. Crossref
35. Holbrook J. The criminalisation of fatal medical mistakes. BMJ 2003;327:1118-9. Crossref
36. Department of Health, UK Government. Learning from Bristol: The Department of Health’s response to the report of the Public Inquiry into Children’s Heart Surgery at the Bristol Royal Infirmary 1984-1995. 2002. Available from: https://www.gov.uk/government/uploads/system/uploads/attachment_data/file/273320/5363.pdf. Accessed 18 Feb 2018.
37. UK Government Report of the Mid Staffordshire NHS foundation trust public inquiry. London: The Stationery Office; 2013.
38. Radhakrishna S. Culture of blame in the National Health Service; consequences and solutions. Br J Anaesth 2015;115:653-5. Crossref
39. Edwards N, Komacki MJ, Silversin J. Unhappy doctors: what are the causes and what can be done? BMJ 2002;324:835-8. Crossref
40. Leung GK. If we do not take charge of ourselves, some else would (have to). Surg Pract 2016;20:141. CrossRef
41. Cohen D. Back to blame: the Bawa-Garba case and the patient safety agenda. BMJ 2017;359:j5534. Crossref
42. Donnelly L. Hunt orders review of medical malpractice amid doctors’ outcry over manslaughter case. The Telegraph. 6 Feb 2018. Available from: https://www.telegraph.co.uk/news/2018/02/06/hunt-orders-review-medical-malpractice-amid-doctors-outcry-manslaughter/. Accessed 26 Mar 2018.
43. Kessler D, McClellan M. Do doctors practice defensive medicine? Q J Econ 1996;111:353-90. Crossref
44. Wong EL, Coulter A, Cheung AW, Yam CH, Yeoh EK, Griffiths SM. Patient experiences with public hospital care: first benchmark survey in Hong Kong. Hong Kong Med J 2012;18:371-80.
45. The Medical Council of Hong Kong. Annual reports 2016. Available from: https://www.mchk.org.hk/files/annual/files/2016/MCAR_2016_e.pdf. Accessed 26 Mar 2018.
46. The Medical Council of Hong Kong. Hong Kong doctors. October 2017. Available from: https://www.mchk.org.hk/english/publications/files/HKDoctors.pdf. Accessed 29 Mar 2018.
47. The Hong Kong Academy of Medicine. Positional paper on postgraduate medical education. 2010. Available from: https://www.hkam.org.hk/publications/HKAM_position_paper.pdf. Accessed 27 Mar 2018.
48. Chow CB. Satisfied patients, burnout doctors! Hong Kong Med J 2012;18:360-1.
49. Wong DS, Lai PB. Malpractice claims: prevention is often a better strategy. Hong Kong Med J 2011;17:425-6.
50. Cruess SR, Cruess RL. Professionalism: a contract between medicine and society. CMAJ 2000;162:668-9.

The effects of global warming on allergic diseases

Hong Kong Med J 2018 Jun;24(3):277–84 | Epub 29 May 2018
DOI: 10.12809/hkmj177046
© Hong Kong Academy of Medicine. CC BY-NC-ND 4.0
REVIEW ARTICLE  CME
The effects of global warming on allergic diseases
Alson WM Chan, FHKCPaed, FHKAM (Paediatrics)1; KL Hon, MD, FHKAM (Paediatrics)2; TF Leung, MD, FHKAM (Paediatrics)2; Marco HK Ho, MD, FHKAM (Paediatrics)3; Jaime S Rosa Duque, MD, PhD3,4; TH Lee, ScD(Cantab), FRCP(UK)1
1 Allergy Centre, Hong Kong Sanatorium & Hospital, Happy Valley, Hong Kong
2 Department of Paediatrics, The Chinese University of Hong Kong, Shatin, Hong Kong
3 Department of Paediatrics and Adolescent Medicine, The University of Hong Kong, Pokfulam, Hong Kong
4 Division of Rheumatology and Clinical Immunology, Department of Medicine, Queen Mary Hospital, The University of Hong Kong, Pokfulam, Hong Kong
 
Corresponding author: Dr Alson WM Chan (awmc@hku.hk)
 
 Full paper in PDF
 
Abstract
Global warming is a public health emergency. Substantial scientific evidence indicates an unequivocal rising trend in global surface temperature that has caused higher atmospheric levels of moisture retention leading to more frequent extreme weather conditions, shrinking ice volume, and gradually rising sea levels. The concomitant rise in the prevalence of allergic diseases is closely related to these environmental changes because warm and moist environments favour the proliferation of common allergens such as pollens, dust mites, molds, and fungi. Global warming also stresses ecosystems, further accelerating critical biodiversity loss. Excessive carbon dioxide, together with the warming of seawater, promotes ocean acidification and oxygen depletion. This results in a progressive decline of phytoplankton and fish growth that in turn promotes the formation of larger oceanic dead zones, disrupting the food chain and biodiversity. Poor environmental biodiversity and a reduction in the microbiome spectrum are risk factors for allergic diseases in human populations. While climate change and the existence of an allergy epidemic are closely linked according to robust international research, efforts to mitigate these have encountered strong resistance because of vested economic and political concerns in different countries. International collaboration to establish legally binding regulations should be mandatory for forest protection and energy saving. Lifestyle and behavioural changes should also be advocated at the individual level by focusing on low carbon living; avoiding food wastage; and implementing the 4Rs: reduce, reuse, recycle, and replace principles. These lifestyle measures are entirely consistent with the current recommendations for allergy prevention. Efforts to mitigate climate change, preserve biodiversity, and prevent chronic diseases are interdependent disciplines.


Introduction
Health hazards that are caused by climate changes are a major public health emergency of the 21st century. The World Health Organization estimates that these will lead to 250 000 additional deaths per year by 2030 to 2050.1
 
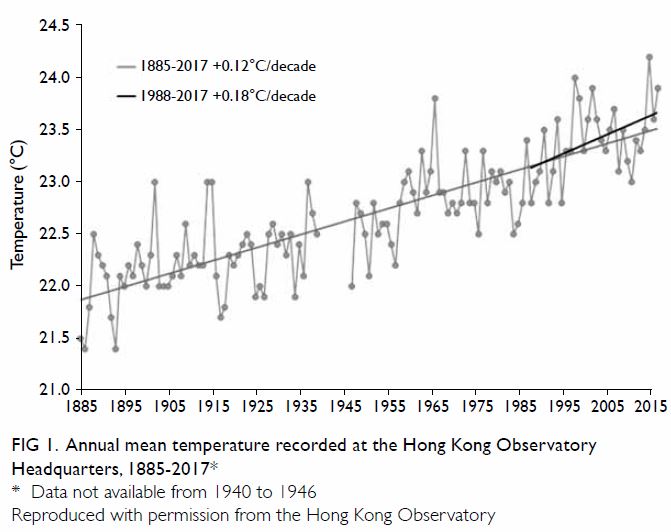
There is substantial evidence for a rising trend of global surface temperature2 3 4 5 6 7 as demonstrated by the progressive elevation in ocean temperature and sea level,8 9 the continuous shrinking of polar ice caps,10 11 the rapid breakup of the Antarctic ice shelves, the melting glaciers at an increasing rate,12 13 14 15 16 and the diminishing snow cover in the Northern Hemisphere at an accelerating pace.17 18 19 The subsequent higher atmospheric levels of moisture retention contribute to more frequent extreme weather conditions including floods, droughts, thunderstorms, typhoons, and heat waves.20 21 22 23 24 25 26 27 28 29 30 The rise in the sea level has been considered to be the greatest threat to the world in the near future.31 32 33 If global temperatures continue to increase unabated, sea levels around the world could rise by up to 5 metres in the next century, and may lead to submersion of low-lying lands and even countries, such as the Solomon’s Islands, Maldives, Fiji, and Micronesia. Urban metropolises including Hong Kong are even more vulnerable to global warming due to the high population density and essential infrastructures. It has been estimated, for example, that an increase by 1°C in the mean daily temperature above 28.2°C in Hong Kong has been associated with a 1.8% higher mortality.25 The annual mean temperature has progressively trended upwards by 0.12°C per decade from 1885 to 2017, with a more rapid increase of 0.18°C per decade since the 1980s (Fig 1). The record-breaking highest temperature was documented on 8 August 2015 with a maximum of 37.9°C measured in Happy Valley.26 More frequent extreme precipitation events have also occurred since 2000 and the highest hourly rainfall of 145.5 mm was observed just recently in 2008. In contrast, in the last century, the highest recorded hourly rainfall was 110 mm only in 1992. A clear rise in the sea level in Victoria Harbour by an additional 30 mm per decade has been documented since the 1950s.25
 

Figure 1. Annual mean temperature recorded at the Hong Kong Observatory Headquarters, 1885-2017
 
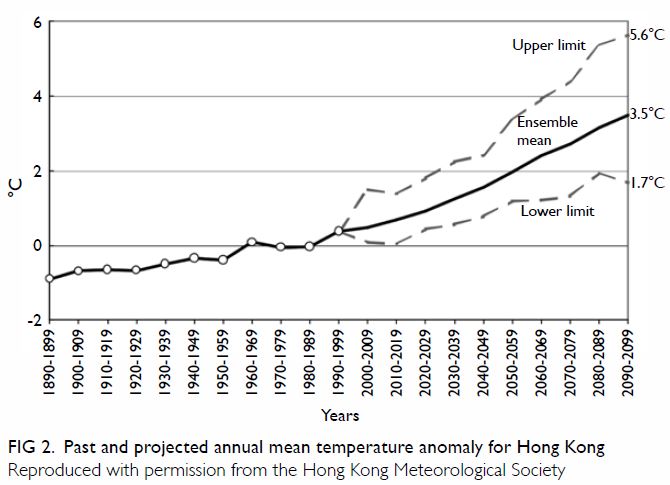
Climate change will continue to accelerate for the next few decades unless substantial intervening efforts are enforced. It is projected that by the year 2100, there will be an increase in annual mean temperature by 3°C to 6°C and there will be significantly greater annual numbers of very hot days (ie, heat waves, defined as daily maximum temperature ≥33.0°C) [Fig 2]. Additionally, it is estimated to have a marked increase from 3 to 12 extremely wet years (ie, annual rainfall >3168 mm) during the 21st century. The annual mean sea level is predicted to rise by 0.63 to 1.07 metres, and severe storm surges may become an annual event whilst these have only occurred once every 50 years in the past century.27 Nonetheless these projections are likely to underestimate the actual consequences. For example, according to the World Meteorological Organization (WMO), anthropogenic greenhouse gas emissions for 2016 were even higher than those in 2015, increasing from 400.0 ppm to 403.3 ppm in 12 months. Although the rate of this increase appears to have slowed, the warming trend in the climate system will ensure the continued temperature rise long into the future, leading to progressive temperature rises of up to 5°C to 6°C and with large parts of the Earth potentially uninhabitable in a foreseeable future.
 

Figure 2. Past and projected annual mean temperature anomaly for Hong Kong
 
Global warming is a result of human activities. Fossil fuel consumption and industrial processes account for a majority of greenhouse gas production. Moreover, in the past 50 years, urbanisation and intensive agricultural practices have destroyed 50% of global rainforests. Deforestation, together with excessive fossil fuel combustion during the process of energy production, result in the imbalance and progressive accumulation of anthropogenic greenhouse gases. In addition, carbon dioxide is extremely long-lasting in the atmosphere, with an average half-life of 30 years. Increased methane emissions, many from natural gas production and ruminants raised for food, together with other greenhouse gases such as chlorofluorocarbons used in cooling systems and nitrous oxide compounds emitted from vehicular transport are even more powerful but less long-lasting greenhouse gases. These factors contribute to progressive global warming and extreme weather conditions such as heatwaves, hurricane storms, floods, forest fires, damage to food crops, and growing vector-borne diseases, all of which threaten our living environments and the ecosystem.28 29 30 31
 
As the global warming situation has continued to worsen over the past few decades, there has been a concurrent increase in the prevalence of allergic diseases by up to 300% to 500% in urban areas. The rate of this increase appears too rapid to be explained entirely by genetics alone, thereby highlighting the important role of environmental changes.32
 
Air pollution and allergic diseases
Epidemiological studies have pointed to a close correlation between global warming, air pollution, and allergic diseases.33 The process of industrialisation, increasing vehicle emissions, and a westernised lifestyle are the major contributors to air pollution. Global warming contributes to air pollution by increasing the demands for space cooling, more natural formation of air pollutants (eg, wildfires, soil erosion, decomposition of organic substances such as plants and animals), and enhancing the urban heat island effect that causes the formation of secondary pollutants (such as ozone). Atmospheric pollutants such as nitric dioxide, ozone, and particulate matter are known to be strongly associated with allergic respiratory diseases.
 
Extreme climatic conditions encourage greater energy utilisation, such as use of heating or air conditioning. This leads to secondary increases in fossil fuel combustion, worsening of air pollutants, and accumulation of tropospheric ozone and particulate matter. Global warming also increases water evaporation and the natural production of pollutants such as desert sand, sea salt, wildfires, and wood heating, promoting the growth of pollens, mould spores and the spread of volcanic ash before they cool down, all of which contribute to the level of particulates in the air. Indoor air pollution consists mainly of a mixture of chemical pollutants and allergens, for example, tobacco smoke, combustion products from heaters and cooking, asbestos, animal allergens, mycotoxins, fungal allergens, cleaning products, painting, adhesive solvents, and furniture chemicals. In particular, tobacco smoke contains at least 3000 compounds, and has five billion particles per cigarette that significantly adds to air pollution especially within indoor environments. Diesel particles adhering to pollens have been shown to be more potent in triggering allergic responses in the airways. Air pollutants affect the lungs and airways directly by attenuating ciliary activity of epithelial cells and increasing permeability of the respiratory epithelium. These effects promote an inflammatory response in the respiratory epithelium and lung parenchyma.34
 
Effect of global warming on common allergens
Global warming leads to longer pollination seasons and more frequent thunderstorms, sandstorms, and other extreme weather conditions.35 Rising temperatures, a higher concentration of carbon dioxide in the atmosphere, heavier rainfalls, and higher humidity induce faster proliferation of pollens, molds, and fungi. This generates atmospheric biological aerosols that carry allergens and has caused epidemics of allergic diseases in many countries.36
 
Sandstorms or dust storms are meteorological phenomena that occur more frequently during global warming, at which time small particles of less than 100 μm can remain airborne for days floating across hundreds of miles, triggering asthma, pneumonia, allergic rhinoconjunctivitis, cardiovascular and cerebrovascular diseases.37
 
Rising temperatures trigger more heavy rainfalls, frequent storms and the progressive rise in sea levels, causing increased frequency and duration of floods, subsequently exacerbating the surface wearing on buildings. These may induce more rapid growth of molds in our indoor environment. There is a strong and consistent dose-response relationship between home dampness and respiratory symptoms including asthma, suggestive of a causal relationship.38 House dust mites and cockroaches prefer warm and humid environments. Sensitisation to house dust mite is more prevalent in temperate and tropical regions of the world, and is associated with allergic rhinitis, allergic conjunctivitis, asthma, and eczema. Nonetheless there are significant differences in specific house dust mite components that trigger allergic diseases between different tropical and temperate areas.39 Cockroach allergy is also an important cofactor for both allergic rhinitis, asthma and eczema, with a variable pattern of sensitisation within the same climatic zones.40
 
Effect of global warming on the prevalence of allergic diseases
Warmer mean temperatures have been shown to be associated with a higher prevalence of asthma. In a New Zealand study, a rise in mean temperature of 1°C was associated with an increase in asthma prevalence by about 1%.41 In an Italian study that compared two regions with a Mediterranean climate and a subcontinental climate respectively, a higher mean temperature was also associated with an increased prevalence of asthmatic attacks.42 In contrast, the International Study of Asthma and Allergies in Childhood (ISAAC) did not find this same correlation between mean outdoor temperatures and the prevalence of asthma.43 Nonetheless the ISAAC study was not designed to specifically investigate the effect of temperature change in different subregions.
 
The more frequent thunderstorm and extreme weather conditions caused by global warming has led to the increased recognition of thunderstorm asthma. Thunderstorm asthma is a separate entity that affects many patients without any history of asthma. It usually occurs during pollen seasons. Epidemics of thunderstorm asthma have been reported in many countries around the world including the US, United Kingdom, Australia, and European countries.44 45 46 47 The most alarming event was the recent epidemic on 21 November 2016 in Melbourne, Australia that resulted in eight deaths.48 In the time series analysis for this epidemic reported in the British Medical Journal, thunderstorm asthma was associated with a 432% increase in emergency medical attendances for acute respiratory distress symptoms on that evening, an 82% increase in the incidence of out-of-hospital cardiac arrest and a 41% increase in prehospital deaths on the same evening of the storm. It is suggested that grass pollens exploded during the thunderstorm, producing pollen fragments that could reach the lower respiratory tract to trigger bronchoconstriction. After the rupture of those pollens by osmotic force, they released allergenic glycoproteins in the form of minute respirable particles which were disseminated up to hundreds of miles.49
 
Asthma-related hospital admissions have been shown to be associated with extreme weather conditions. A recent time series showed an increase in asthma-related hospitalisation during extreme weather conditions such as the high humidity high temperature weather, the low humidity low temperature weather, and during periods of high ozone levels.50 Another recent study also revealed that the extent of diurnal temperature difference was positively associated with an increase in hospitalisation due to asthma exacerbation.51
 
Out-patient clinic visits for allergic conjunctivitis were shown to be significantly correlated with higher levels of nitrous oxide, ozone, and higher temperature in a time series conducted in Shanghai, China.52 Indoor and outdoor air pollution has been well recognised as a major environmental risk factor for allergic rhinoconjunctivitis. Associated air pollutants include tobacco smoke, products of fossil fuel combustion, dust in Asian region, and phthalates. It is postulated that these air pollutants may be allergenic, irritant, or a combination of both.53 54 55 56 57
 
The prevalence of physician-diagnosed allergic rhinitis has been positively correlated with warmer temperature in studies along the Pacific rim (odds ratio=1.1, 95% confidence interval=1.02-1.19).58 Studies using ISAAC data showed some regional associations in different age-groups and areas, but this observation was not consistent and has not clearly supported this correlation.59
 
Increased pollen sensitisation has been correlated with global warming according to the US National Health and Nutrition Examination Survey with at least a two-fold rise in the prevalence of sensitisation to perennial rye grass and ragweed during the two periods between 1976-1980 and 1988-1994.60 Similar findings were noted in Canada.61
 
There have been no studies that specifically focused on a link between urticaria and global warming per se, although a few anecdotal reports have observed that during high temperatures associated with global warming patients, tended to wear less clothing, leading to more light exposure that exacerbated their solar urticaria.62 As for eczema, there is no known correlation between mean outdoor temperature and its prevalence.
 
Effect on biodiversity
The scientific evidence is clear: a rich biodiversity in our living environment is important for human health and prevention of allergic diseases.63 Nonetheless global warming and population pressures are disrupting biodiversity in the ecosystem and human living environment.64 For instance, the beginning of the plant growing season has already advanced by an average of 10 days in Europe over the last few decades. These changes have altered food chains and created mismatches within ecosystems where different species have evolved synchronised interdependence, such as nesting and food availability, pollinators, and fertilisation. Climate change is also shifting the habitat ranges of disease-carrying organisms, bringing them into contact with potential hosts that have not developed any immunity. Freshwater habitats and wetlands, mangroves, coral reefs, Arctic and alpine ecosystems, dry and subhumid lands, and cloud forests are particularly vulnerable to the impacts of climate change. Many species are not equipped to adapt to the pace and scale of the progressive climate change, resulting in extinction, both locally and globally. In addition, seawater warming and ocean acidification due to excessive carbon dioxide lead to a progressive reduction in the growth of phytoplankton and fish and overgrowth of bacteria that depletes the oxygen content of water. These local changes boost the size and extent of oceanic dead zones and influence the food chain and biodiversity well beyond the Arctic.65
 
Urban residents have been found to have significantly more atopy such as asthmatic symptoms, rhinitis, eczema, and higher exhaled nitric oxide values than those who live in a rural environment.66 Exposure to the rich microbial diversity and variety of animals within rural areas plays a major protective role against the development of asthma and allergic diseases.67 A number of risk factors for atopic asthma related to urbanisation have been identified, including decreased family size and sibling numbers, frequent use of antibiotics especially during the infantile period, increases in environmental pollutants and household exposure to indoor allergens, decreased raw and fresh food consumption, sedentary lifestyle, higher socio-economic status, and reduction in environmental exposure to microbial endotoxins.68
 
Insect migration may be affected by global warming. In a retrospective review of three different patient databases in Alaska, there were statistically significant increases in the prevalence of insect sting reactions accompanying the rise in annual temperatures, suggesting expansion of the insect habitats and redistribution related to global warming.69 Invasive insect species such as destroyer ants and European fire ants are expanding their influence on humans due to the increase in quantity and quality of suitable habitats for them related to global warming.70
 
Food supply and food choice
Global warming leads to more extreme weather conditions such as heavy rainfalls, drought, frequent storms, floods, and heat waves. As aforementioned together with the sea warming effect that also damages the food chain and biodiversity, all of these factors have a detrimental effect on crop harvest and food production. It has been shown that an increase in outdoor temperature is associated with a decreasing trend in the nutrient content and total amount of crop yield per year.71 The fall in food production increases the price of fresh and raw foods, and encourages consumption of less expensive and unhealthy food alternatives that contain more artificial colours, chemicals, and preservatives. Recent research has shown that fresh foods with natural ingredients contain a richer diversity of microbiome, now known to be very important for intestinal immune health. On the contrary, prolonged consumption of preserved or refined foods with a poor diversity of microbiome is associated with the development of allergic, inflammatory, cardiovascular, and gastrointestinal diseases.71
 
Climate change mitigation and allergic disease prevention
One major challenge for climate change mitigation is the resistance against countering global warming. In an interview with CNBC, the US Environmental Protection Agency Administrator and also a climate change sceptic, Mr Scott Pruitt, stated that he did not believe carbon dioxide is a cause of global warming. He also described the Paris Agreement, where representatives from 190 countries agreed to work towards lowering carbon dioxide emissions, as a ‘bad deal’.72 More than 20 non-profit groups supported him and contributed more than US$88 million to spread climate science disinformation via think tanks and advocacy groups to support contrarian ‘science’ intended to create doubt about the prevailing science of anthropogenic climate change, mostly from fossil fuel interest groups, following the example of the Big Tobacco’s efforts to derail anti-tobacco legislation.
 
Despite this, a large body of scientific evidence shows that fossil fuel burning is the main cause of climate change. The use of renewable energy such as solar, wind, ocean, biomass, geothermal resources for electricity and heat generation to replace conventional fossil fuel combustion is an important strategy. Reforestation, afforestation, and avoidance of desertification require multinational and well-coordinated efforts. For example, China is shifting from fossil fuel to renewable energy with related investments rising from US$3 billion in 2005 to US$127 billion in 2017, more than the US and EU combined.73 Another example is India’s Forest Rights Act that aims to strike a balance between agriculture, urbanisation, and forest protection via legal reinforcement. This act protects the grassland and national parks from unauthorised agricultural activities and ensures livestock are fed in designated areas, and places a ban via legal measures on unauthorised deforestation.74 The inter-governmental panel on climate change established by the United Nations Environment Programme and the WMO is currently the international scientific collaborative network focusing on a multinational approach to climate change mitigation.
 
Efficient energy use is critical to reduce the energy consumption. New techniques in home insulation are available that can help reduce space heating and cooling requirements while maintaining a comfortable indoor temperature without additional energy consumption. Lighting using light-emitting diodes or compact fluorescent lights consume less than a quarter of the energy and are much longer-lasting than traditional incandescent light bulbs. In addition, the use of skylights reduces the energy required to attain the same level of illumination and they are now more commonly incorporated in architectural designs.
 
Low carbon living is a lifestyle that emits less carbon dioxide using the 4Rs of environmental protection principles: reduce, reuse, recycle, and replace. It is becoming an increasingly important refrain that is being heard more often. Below are some practical examples: concerning food selection, choose more vegetables and less meat, more organic and fresh foods rather than processed foods, local production rather than imported foods, purchase and prepare the amount of food according to actual need in order to avoid wastage or leftovers, or avoid accumulation of too much food that cannot be consumed before the expiry date; bring along reusable storage bags, and avoid restaurants that using disposable cutlery and crockery such as wooden chopsticks, plastic plates and plastic bowls; donate excessive food items to food banks before their expiry; use less oil during cooking (eg, avoid deep frying); send food waste and packaging for recycling as much as possible; concerning transportation, use more public transport more often than privately owned cars; choose less polluting transportation such as Mass Transit Railway, trams or light buses that use liquefied petroleum gas; walk or cycle if the destination is nearby, and is healthy and environmentally friendly; avoid leaving a car engine idling without switching it off; choose an airline involved in ‘carbon neutral’ programmes when travelling abroad; concerning energy efficiency: choose grade 1 electrical appliances under the government’s Energy Efficiency Labelling Scheme; turn off computer screens, laptops and television completely rather than using the standby mode; use air conditioners only when the temperature is higher than 26°C, and set the temperature to about 25.5°C if they are in use.75
 
Lifestyle and behavioural changes remain the most important strategies at an individual level. Educational and incentive programmes should be provided for public stakeholders for environmental protection. As the prevalence of allergic diseases is correlated with global warming, a better mitigation of important climatic changes will help to alleviate the progressive increasing trend of allergic disease development.
 
Conclusion
Global warming is caused by human activities. A paradigm shift should take place to enable everyone to live a healthy and environmentally friendly lifestyle. Allergy prevention and biodiversity preservation should not be practised at an individual level only, as it is a true global health emergency. Strategies must continue to be planned and coordinated at an international level. Measures to mitigate global warming, preserve biodiversity, and prevent allergic diseases are interdependent disciplines that will need to continue to be a major advocacy and research focus in the next century and beyond.
 
Declaration
As an editor of this journal, KL Hon was not involved in the peer review process of this article. All other authors have no conflicts of interest to disclose. All authors had full access to the data, contributed to the study, approved the final version for publication, and take responsibility for its accuracy and integrity.
 
References
1. World Health Organization. Climate change and health. Available from: http://www.who.int/mediacentre/factsheets/fs266/en/. Accessed 27 Sep 2017.
2. Hansen J, Ruedy R, Glascoe J, and Sato M. GISS analysis of surface temperature change. J Geophys Res 1999;104:30997-1022. Crossref
3. Hansen J, Ruedy R, Sato M, et al. A closer look at United States and global surface temperature change. J Geophys Res 2001;106:23947-63. Crossref
4. Karl TR, Trenberth KE. Modern global climate change. Science 2003;302:1719-23. Crossref
5. Ramaswamy V, Schwarzkopf MD, Randel WJ, Santer BD, Soden BJ, Stenchikov GL. Anthropogenic and natural influences in the evolution of lower stratospheric cooling. Science 2006;311:1138-41. Crossref
6. Marcott SA, Shakun JD, Clark PU, Mix AC. A reconstruction of regional and global temperature for the past 11,300 years. Science 2013;339:1198-201. Crossref
7. Hausfather Z, Cowtan K, Clarke DC, Jacobs P, Richardson M, Rohde R. Assessing recent warming using instrumentally homogeneous sea surface temperature records. Sci Adv 2017;3:e1601207. Crossref
8. Levitus S, Antonov JI, Boyer TP, Locarnini RA, Garcia HE, Mishonov AV. Global ocean heat content 1955-2008 in light of recently revealed instrumentation problems. Geophys Res Lett 2009;36:L07608. Crossref
9. Church JA, White NJ. A 20th century acceleration in global sea-level rise. Geophys Res Lett 2006;33:L01602. Crossref
10. Alley RB, Brigham-Grette J, Miller GH, et al. Past Climate Variability and Change in the Arctic and at High Latitudes. Washington: US Climate Change Science Program; 2009.
11. Kwok R, Rothrock DA. Decline in Arctic sea ice thickness from submarine and ICESat records: 1958-2008. Geophys Res Lett 2009;36:L15501. Crossref
12. Jacob T, Wahr J, Pfeffer WT, Swenson S. Recent contributions of glaciers and ice caps to sea level rise. Nature 2012;482:514-8. Crossref
13. Gardner AS, Moholdt G, Cogley JG, et al. A reconciled estimate of glacier contributions to sea level rise: 2003 to 2009. Science 2013;340:852-7. Crossref
14. Marshall S. Climate change. Glacier retreat crosses a line. Science 2014;345:872. Crossref
15. Marzeion B, Cogley JG, Richter K, Parkes D. Glaciers. Attribution of global glacier mass loss to anthropogenic and natural causes. Science 2014;345:919-21. Crossref
16. Zemp M, Frey H, Gärtner-Roer I, et al. Historically unprecedented global glacier decline in the early 21st century. J Glaciology 2015;61:745-62. Crossref
17. Groisman PY, Karl TR, Knight RW. Observed impact of snow cover on the heat balance and the rise of continental spring temperatures. Science 1994;263:198-200. Crossref
18. Frei A, Robinson DA. Northern Hemisphere snow extent: regional variability 1972-1994. Int J Climatol 1999;19:1535-60. Crossref
19. Kunkel KE, Robinson DA, Champion S, Yin X, Estilow T, Frankson RM. Trends and extremes in Northern Hemisphere snow characteristics. Curr Clim Change Rep 2016;2:65-73. Crossref
20. Kunkel KE, Karl TR, Easterling DR, et al. Probable maximum precipitation and climate change. Geophys Res Lett 2013;40:1402-8. Crossref
21. Kunkel KE, Karl TR, Brooks H, et al. Monitoring and understanding trends in extreme storms: state of the knowledge. BAMS 2013;94:499-514. Crossref
22. Meier MF, Dyurgerov MB, Rick UK, et al. Glaciers dominate eustatic sea-level rise in the 21st century. Science 2007;317:1064-7. Crossref
23. Bamber J, Riva R. The sea level fingerprint of recent ice mass fluxes. The Cryosphere 2010;4:621-7. Crossref
24. Radić V, Bliss A, Beedlow AC, Hock R, Miles E, Cogley JG. Regional and global projections of twenty-first century glacier mass changes in response to climate scenarios from global climate models. Clim Dyn 2014;42:37-58. Crossref
25. Chan EY, Goggins WB, Kim JJ, Griffiths SM. A study of intracity variation of temperature-related mortality and socioeconomic status among the Chinese population in Hong Kong. J Epidemiol Community Health 2012;66:322-7. Crossref
26. Hong Kong Observatory. Record-breaking high temperature [press release]. Available from: http://www.hko.gov.hk/press/SP/pre20150808.htm. Accessed 16 May 2018.
27. Hong Kong Observatory. Hong Kong in a warming world. Available from: http://www.hko.gov.hk/climate_change/climate_change_e.pdf. Accessed 16 May 2018.
28. D’Amato G, Holgate ST, Pawankar R, et al. Meteorological conditions, climate change, new emerging factors, and asthma and related allergic disorders. A statement of the World Allergy Organization. World Allergy Organ J 2015;8:25. Crossref
29. Santer BD, Taylor KE, Wigley TM, et al. A search for human influences on the thermal structure of the atmosphere. Nature 1996;382:39-46. Crossref
30. Hegerl GC, von Storch H, Hasselmann K, Santer BD, Cubasch U, Jones PD. Detecting greenhouse-gas-induced climate change with an optimal fingerprint method. J Climate 1996;9:2281-306. Crossref
31. Santer BD, Wehner MF, Wigley TM, et al. Contributions of anthropogenic and natural forcing to recent tropopause height changes. Science 2003;301:479-83. Crossref
32. Pawankar R, Holgate ST, Canonica GW, Lockey RF, Blaiss MS, editors. WAO White Book on Allergy: Update 2013. Milwaukee [WI], US: World Allergy Organization; 2013.
33. Fifth Assessment Report of the Intergovernmental Panel on Climate Change. Climate Change 2013: The Physical Science Basis; Summary for Policymakers. Intergovernmental Panel on Climate Change; 2013.
34. Brunekreef B, Holgate ST. Air pollution and health. Lancet 2002;360:1233-42. Crossref
35. Ariano R, Canonica GW, Passalacqua G. Possible role of climate changes in variations in pollen seasons and allergic sensitizations during 27 years. Ann Allergy Asthma Immunol 2010;104:215-22. Crossref
36. Celenza A, Fothergill J, Kupek E, Shaw RJ. Thunderstorm associated asthma: a detailed analysis of environmental factors. BMJ 1996;312:604-7. Crossref
37. Meng Z, Lu B. Dust events as a risk factor for daily hospitalization for respiratory and cardiovascular diseases in Minqin, China. Atmos Environ 2007;41:7048-58.
38. Mendell MJ, Mirer AG, Cheung K, Tong M, Douwes J. Respiratory and allergic health effects of dampness, mold, and dampness-related agents: a review of the epidemiologic evidence. Environ Health Perspect 2011;119:748-56. Crossref
39. Banerjee S, Resch Y, Chen KW, et al. Der p 11 is a major allergen for house dust mite-allergic patients suffering from atopic dermatitis. J Invest Dermatol 2015;135:102-9. Crossref
40. Potter PC, Motala C, Fenemore B, et al. Sensitisation to three cockroach species in Southern Africa. Curr Allergy Clin Immunol 2005;18:62-6.
41. Hales S, Lewis S, Slater T, Crane J, Pearce N. Prevalence of adult asthma symptoms in relation to climate in New Zealand. Environ Health Perspect 1998;106:607-10. Crossref
42. de Marco R, Poli A, Ferrari M, et al. The impact of climate and traffic-related NO2 on the prevalence of asthma and allergic rhinitis in Italy. Clin Exp Allergy 2002;32:1405-12. Crossref
43. Asher MI, Stewart AW, Mallol J, et al. Which population level environmental factors are associated with asthma, rhinoconjunctivitis and eczema? Review of the ecological analyses of ISAAC Phase One. Respir Res 2010;11:8. Crossref
44. Venables KM, Allitt U, Collier CG, et al. Thunderstorm-related asthma—the epidemic of 24/25 June 1994. Clin Exp Allergy 1997;27:725-36. Crossref
45. Marks GB, Colquhoun JR, Girgis ST, et al. Thunderstorm outflows preceding epidemics of asthma during spring and summer. Thorax 2001;56:468-71. Crossref
46. Girgis ST, Marks GB, Downs SH, Kolbe A, Car GN, Paton R. Thunderstorm-associated asthma in an inland town in south-eastern Australia: who is at risk? Eur Respir J 2000;16:3-8. Crossref
47. Losappio L, Heffler E, Contento F, Cannito C, Rolla G. Thunderstorm-related asthma epidemic owing to Olea Europaea pollen sensitisation. Allergy 2011;66:1510-1. Crossref
48. Woodhead M. Hospitals overwhelmed with patients after “thunderstorm asthma” hits Melbourne. BMJ 2016;355:i6391. Crossref
49. Andrew E, Nehme Z, Bernard S, et al. Stormy weather: a retrospective analysis of demand for emergency medical services during epidemic thunderstorm asthma. BMJ 2017;359:j5636. Crossref
50. Lam HC, Li AM, Chan EY, Goggins WB 3rd. The short-term association between asthma hospitalisations, ambient temperature, other meteorological factors and air pollutants in Hong Kong: a time-series study. Thorax 2016;71:1097-109. Crossref
51. Qiu H, Yu IT, Tse LA, Chan EY, Wong TW, Tian L. Greater temperature variation within a day associated with increased emergency hospital admissions for asthma. Sci Total Environ 2015;505:508-13. Crossref
52. Hong J, Zhong T, Li H, et al. Ambient air pollution, weather changes, and outpatient visits for allergic conjunctivitis: A retrospective registry study. Sci Rep 2016;6:23858. Crossref
53. Mimura T, Ichinose T, Yamagami S, et al. Airborne particulate matter (PM2.5) and the prevalence of allergic conjunctivitis in Japan. Sci Total Environ 2014;487:493-9. Crossref
54. Mimura T, Yamagami S, Fujishima H, et al. Sensitization to Asian dust and allergic rhinoconjunctivitis. Environ Res 2014;132:220-5. Crossref
55. Chang CC, Lee IM, Tsai SS, Yang CY. Correlation of Asian dust storm events with daily clinic visits for allergic rhinitis in Taipei, Taiwan. J Toxicol Environ Health A 2006;69:229-35. Crossref
56. World Health Organization. Health aspects of air pollution with particulate matter, ozone and nitrogen dioxide. 2003. Available from: http://www.euro.who.int/__data/assets/pdf_file/0005/112199/E79097.pdf. Accessed 6 Feb 2018.
57. Bekö G, Callesen M, Weschler CJ, et al. Phthalate exposure through different pathways and allergic sensitization in preschool children with asthma, allergic rhinoconjunctivitis and atopic dermatitis. Environ Res 2015;137:432-9. Crossref
58. Williams R. Climate change blamed for rise in hay fever. Nature 2005;434:1059. Crossref
59. Weiland SK, Hüsing A, Strachan DP, Rzehak P, Pearce N; ISSAC Phase One Study Group. Climate and the prevalence of symptoms of asthma, allergic rhinitis, and atopic eczema in children. Occup Environ Med 2004;61:609-15. Crossref
60. Arbes SJ Jr, Gergen PJ, Elliott L, Zeldin DC. Prevalences of positive skin test responses to 10 common allergens in the US population: results from the third national health and nutrition examination survey. J Allergy Clin Immunol 2005;116:377-83. Crossref
61. Boulet LP, Turcotte H, Laprise C, et al. Comparative degree and type of sensitization to common indoor and outdoor allergens in subjects with allergic rhinitis and/or asthma. Clin Exp Allergy 1997;27:52-9. Crossref
62. Dice JP. Physical urticarial. Immunol Allergy Clin North Am 2004;24:225-46. Crossref
63. Haahtela T, Holgate S, Pawankar R, et al. The biodiversity hypothesis and allergic disease: world allergy organization position statement. World Allergy Organ J 2013;6:3. Crossref
64. Aukema JE, Pricope NG, Husak GJ, Lopez-Carr D. Biodiversity areas under threat: overlap of climate change and population pressures on the world’s biodiversity priorities. PLoS One 2017;12:1. Crossref
65. Convention on Biological Diversity. Global Biodiversity Outlook 4: A Mid-term Assessment of Progress towards the Implementation of the Strategic Plan for Biodiversity 2011-2020. Montréal, Canada: Secretariat of the Convention on Biological Diversity; 2014.
66. Robinson CL, Baumann LM, Romero K, et al. Effect of urbanisation on asthma, allergy and airways inflammation in a developing country setting. Thorax 2011;66:1051-7. Crossref
67. Huang YJ, Marsland BJ, Bunyavanich S, et al. The microbiome in allergic disease: current understanding and future opportunities-2017 PRACTALL document of the American Academy of Allergy, Asthma & Immunology and the European Academy of Allergy and Clinical Immunology. J Allergy Clin Immunol 2017;139:1099-110. Crossref
68. Braun-Fahrländer C, Riedler J, Herz U, et al. Environmental exposure to endotoxin and its relation to asthma in school-age children. N Engl J Med 2002;347:869-77. Crossref
69. Demain JG, Gessner BD, McLaughlin JB, Sikes DS, Foote JT. Increasing insect reactions in Alaska: is this related to changing climate? Allergy Asthma Proc 2009;30:238-43. Crossref
70. Bertelsmeier C, Luque GM, Courchamp F. Increase in quantity and quality of suitable areas for invasive species as climate changes. Conserv Biol 2013;27:1458-67. Crossref
71. Lobell DB, Schlenker W, Costa-Roberts J. Climate trends and global crop production since 1980. Science 2011;333:616-20. Crossref
72. DiChristopher T. EPA chief Scott Pruitt says carbon dioxide is not a primary contributor to global warming. CNBC Politics news. Available from: https://www.cnbc.com/2017/03/09/epa-chief-scott-pruitt.html. Accessed 30 Jan 2018.
73. Frankfurt School-UNEP Centre/BNEF. Global Trends in Renewable Energy Investment 2018. Frankfurt School of Finance & Management gGmbH; 2018.
74. Boysen LR, Lucht W, Gerten D, Heck V, Lenton TM, Schellnhuber HJ. The limits to global-warming mitigation by terrestrial carbon removal. Earth’s Future 2017;5:463-74. Crossref
75. Pimm SL, Jenkins CN, Abell R, et al. The biodiversity of species and their rates of extinction, distribution, and protection. Science 2014;344:1246752. Crossref

Jaundice in infants and children: causes, diagnosis, and management

Hong Kong Med J 2018 Jun;24(3):285–92 | Epub 21 May 2018
DOI: 10.12809/hkmj187245
© Hong Kong Academy of Medicine. CC BY-NC-ND 4.0
REVIEW ARTICLE  CME
Jaundice in infants and children: causes, diagnosis, and management
YY Chee, MB, BS, FHKAM (Paediatrics)1; Patrick HY Chung, MB, BS, FHKAM (Surgery)2; Rosanna MS Wong, MB, BS, FHKAM (Paediatrics)1; Kenneth KY Wong, PhD, FHKAM (Surgery)2
1 Department of Paediatrics and Adolescent Medicine, The University of Hong Kong, Pokfulam, Hong Kong
2 Department of Surgery, The University of Hong Kong, Pokfulam, Hong Kong
 
Corresponding author: Dr Kenneth KY Wong (kkywong@hku.hk)
 
 Full paper in PDF
 
Abstract
Jaundice is caused by an accumulation of bilirubin in the blood. The presentation in infants and children can be indicative of a wide range of conditions, with some self-limiting and others potentially life-threatening. This article aims to provide a concise review of the common medical and surgical causes in children and discuss their diagnosis and management.


Introduction
Jaundice is caused by the accumulation of bilirubin in the blood. It can be a result of overproduction of or failure to metabolise and excrete bilirubin. The incidence of infantile jaundice is approximately 1 in 2500 to 5000 live births1 2 with a variety of underlying diagnoses ranging from self-limiting breast milk jaundice to aggressive life-threatening diseases such as biliary atresia (BA) and liver failure. Although the clinical features of certain diseases are obvious, some may have more subtle presentations that necessitate a high index of suspicion for diagnosis. In general, the differential diagnoses of jaundice in infancy follow those of adults and can broadly be divided into pre-hepatic, hepatic, and post-hepatic causes. In some cases, specific treatment may not be necessary but more often timely management is required for an optimal outcome. In this article, we highlight several medical and surgical diagnoses of infantile jaundice and a diagnostic strategy based on current evidence.
 
Medical diseases
Breast milk jaundice
Breast milk jaundice was first described more than 50 years ago, with benign unconjugated hyperbilirubinaemia associated with breastfeeding.3 4 5 It is the most common cause of prolonged jaundice in an otherwise healthy breastfed infant born at term. It usually presents in the first 2 to 3 weeks of life (incidence has been reported as 34%),6 and can persist for as long as 12 weeks before spontaneous resolution. Total serum bilirubin levels in breast milk jaundice alone do not exceed 200 μmol/L. Diagnosis of breast milk jaundice requires the exclusion of other possible pathological causes. Table 1 shows the essential clinical features of breast milk jaundice.
 

Table 1. Clinical features of breast milk jaundice
 
The aetiology of breast milk jaundice is not clear. Animal models suggest that mature breast milk may enhance bilirubin uptake in the gastrointestinal tract, thus increasing enterohepatic circulation and unconjugated bilirubin levels.7 8 Higher levels of epidermal growth factor both in the serum and breast milk of affected infants may offer a plausible mechanism for breast milk jaundice in the same way.9 Activity of beta-glucuronidase (which deconjugates intestinal bilirubin) that is higher in human milk than formula milk will again increase the serum bilirubin level by increasing enterohepatic circulation.10
 
Severity and duration of breast milk jaundice may be affected by a concurrent neonatal manifestation of Gilbert syndrome which will be discussed later.
 
Infants with breast milk jaundice require no treatment provided they are clinically well and the total serum bilirubin concentration remains below the recommended phototherapy level. The interruption of breastfeeding is not advised. If total serum bilirubin exceeds 200 μmol/L, further investigation is required. In case of a negative workup, the possibility of the additional presence of a mutation of the hepatic enzyme UGT1A1 (uridine diphosphate glucuronosyltransferase 1A1) conjugating bilirubin in the hepatocyte, ie, Gilbert syndrome, should be considered. Follow-up (every 2 weeks) should be offered preferably until a decreasing trend of jaundice becomes evident.
 
Glucose-6-phosphate dehydrogenase deficiency
Glucose-6-phosphate dehydrogenase (G-6-PD) is an enzyme found in all cells of the body. Reactive oxygen species (ROS) are continually formed in the body causing tissue oxidation, disruption of lipid membranes, destruction of cell enzyme functions, alteration of DNA structure, and eventually cell death. Glucose-6-phosphate dehydrogenase plays a major role in neutralising the ROS and offers protection against tissue oxidative damage. Red blood cells are particularly susceptible to oxidative stress so the major effect of G-6-PD deficiency is haematological.
 
Glucose-6-phosphate dehydrogenase deficiency is a genetic condition with an X-linked recessive inheritance. Males are more likely to be affected. In Hong Kong, there is routine cord blood screening for G-6-PD deficiency and an incidence of around 4.5% in males and 0.5% in females.11
 
Glucose-6-phosphate dehydrogenase deficiency– associated neonatal hyperbilirubinaemia can manifest in two forms: severe jaundice resulting from acute haemolysis or gradual onset jaundice. Some G-6-PD–deficient neonates may develop severe haemolysis that results in rapidly rising serum total bilirubin levels, with the potential to develop kernicterus, with or without the identification of a known trigger of haemolysis.12 13 In contrast to the severe haemolytic jaundice, gradual onset jaundice is less severe and is associated with a slower increase in total serum bilirubin concentration.
 
Apart from haemolysis (as evidenced by a falling haemoglobin with elevated reticulocyte count), diminished bilirubin clearance plays a role in the pathogenesis of jaundice in G-6-PD deficiency infants. Serum conjugated bilirubin studies indicate diminished bilirubin conjugation in G-6-PD–deficient neonates,14 with impaired excretion of conjugated bilirubin into the small intestine in bile.
 
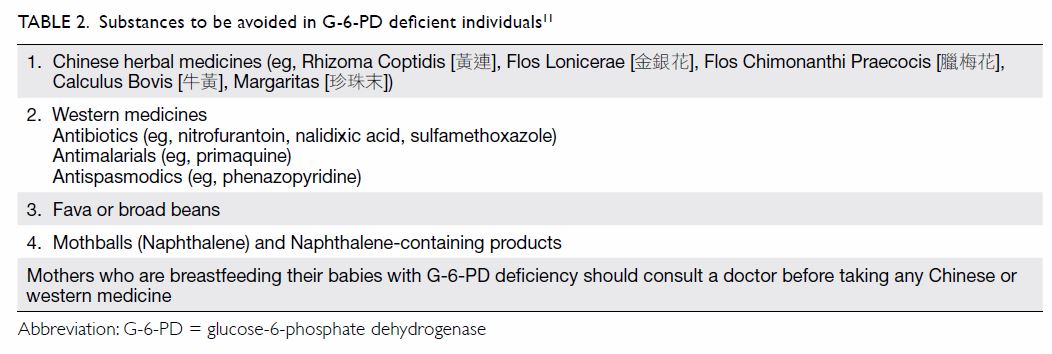
Prevention of hyperbilirubinaemia and kernicterus in G-6-PD–deficient neonates is possible. Parents of neonates affected should be counselled on the risks of jaundice. They should be advised to avoid triggers of haemolysis (Table 211). Predischarge measurement of the bilirubin level using transcutaneous bilirubin or serum total bilirubin should be performed followed by earlier and more frequent follow-up.15
 

Table 2. Substances to be avoided in G-6-PD deficient individuals11
 
Gilbert syndrome
Gilbert syndrome is the most common inherited disorder of bilirubin glucuronidation. The prevalence of Gilbert syndrome has been reported to be 5% to 10% in the Caucasian population,16 17 with a similar prevalence (3-7%) in Chinese.18 19 Uridine diphosphate glucuronosyltransferase 1A1 is the hepatic enzyme responsible for bilirubin conjugation. Gilbert syndrome results from a mutation in the UGT1A1 gene promotor region. It manifests only in people who are homozygous for the genetic mutation, consistent with an autosomal recessive inheritance. Such mutation may produce structural or functional enzymatic deficiencies, possibly resulting in impaired bilirubin conjugation and hyperbilirubinaemia. Such genetic mutations have been demonstrated in Asian populations.18 19 20
 
Patients typically present during the adolescent period (with recurrent episodes of jaundice that may be triggered by dehydration, fasting, intercurrent illness, menstruation, etc) when alterations in sex steroid concentrations affect bilirubin metabolism. Nonetheless they may also present with prolonged breast milk jaundice due to concurrent Gilbert syndrome. The diagnosis is made by excluding other causes of unconjugated hyperbilirubinaemia although genetic testing is available. No treatment is necessary. The long-term outcome is similar to that for the general population. Nonetheless the Gilbert genotype is associated with an increased severity and duration of neonatal jaundice.21 22
 
Viral hepatitis
Among the viral aetiologies in the developing world, hepatitis A, B, and E are the most common causes of paediatric acute liver failure (PALF). In the developed world, viruses like herpes simplex virus (HSV) and enterovirus are more commonly identified as the aetiological agent.
 
Hepatitis viruses
Hepatitis A virus infection resulting in PALF is uncommon in developed countries (2.5% in a PALF registry in North America and United Kingdom).23 Nonetheless acute hepatitis A virus infection accounts for up to 80% of PALF cases in developing countries.24 Similarly, acute hepatitis B virus (HBV) infection causing PALF is uncommon in the West where HBV is not endemic. On the contrary, in areas where HBV is endemic, it accounts for up to 46% of PALF.25 Hepatitis E virus infection has rarely been identified as the cause of PALF. Pregnant women have a high risk of fulminant hepatitis associated with hepatitis E virus infection, with a particularly high risk during the third trimester of pregnancy. The risk of symptomatic hepatitis in the newborn is high if a pregnant woman acquires hepatitis E virus infection during pregnancy.
 
Infection with viruses other than hepatitis viruses
Herpes simplex virus should be considered an important and treatable cause of PALF. Herpes simplex virus most commonly affects infants and newborns. In a registry study from North America and the UK, HSV was identified in 25% of young infants (0-6 months) with PALF.23
 
Other viruses associated with PALF include enterovirus and Epstein-Barr virus. The Enterovirus family (including echovirus, Coxsackie A and B virus) was identified as the aetiological agent of acute liver failure in 2.7% of young infants (0-90 days of age) in a multi-centre registry in North America and the UK.26 Epstein-Barr virus is more frequently implicated in PALF in older children and adolescents.
 
Chinese herbal medicine–associated hepatotoxicity
Chinese herbs are being increasingly used in the paediatric population in certain parts of the world and some have been implicated in the development of hepatotoxicity. A recent retrospective review of Chinese herbal medicine–induced liver injury in Beijing, China revealed that Ephedra sinica and Polygonum multiflorum were the major culprit herbs.27 These ingredients are found in products such as Gan-mao soft capsules (感冒軟膠), Xiao-er-ke-chuan-ling (小兒咳喘靈) granules, and Shou-wu-yan-shou (首烏延壽丹) tablets that are used to treat upper respiratory tract infection or vitiligo. Jaundice is the most common clinical sign. Median days from herbal ingestion to appearance of presenting symptoms can be up to 30 days. Therefore, it is important to enquire about the use of traditional Chinese medicine in the weeks preceding clinical presentation.
 
Surgical diseases
Surgical jaundice commonly refers to obstructive jaundice and consequent impaired biliary drainage. Unlike adults, the causes of obstruction in infants are usually congenital. The differentiation from medical causes can be made by measuring the level of conjugated bilirubin (which will usually be raised in cases of obstructive jaundice) as well as examination of the biliary system by ultrasound scan. Obstructive jaundice is curable by surgery but the magnitude of surgery ranges from minor to ultra-major. The management of individual diagnoses will be discussed below.
 
Biliary atresia
The first description in the English language of a condition similar to BA appeared in a textbook written by Dr John Burns from the University of Glasgow in 1817.28 Nonetheless it was more than a century later before the first operation was performed by Dr William Ladd from Boston in an attempt to correct BA.29 Unfortunately, his surgery did not improve the outcome of this condition and BA was at this time regarded as ‘the darkest chapter in paediatric surgery’. In 1959, Dr Morio Kasai from Japan reported his radical surgery for BA with a higher success rate.30 It was only then that BA became a potentially curable condition and the operation that was named after Dr Kasai is now the standard surgical approach for BA.
 
Biliary atresia is a rare disorder with an incidence that varies widely among populations (1 in 5000 in Asians to 1 in 18 000 in Caucasians). In 10% to 20% of patients, the disease is associated with other congenital anomalies.31 The disease is characterised by inflammatory sclerosing cholangiopathy affecting the entire biliary tract. The bile duct is replaced by fibrous tissue without luminal patency (Fig 1). Its aetiology remains largely unknown and the most widely accepted theory is that unknown exogenous factors trigger a series of self-limiting inflammatory events in a genetically predisposed individual during the embryonic or perinatal period. Current evidence suggests that genetics play an important role in the pathogenesis of BA.32 A genome-wide association study conducted by a group of scientists in Hong Kong discovered a BA-associated region on chromosome 10q24.2 that could alter the expression of adducin 3 in the liver.33 Nonetheless genetic abnormality alone cannot be the sole explanation since BA is not an inherited disease.
 

Figure 1. An intra-operative photograph showing a 2-month-old boy with biliary atresia, with the entire biliary tract replaced by fibrotic tissue (arrow) without luminal patency
 
Antenatal diagnosis is difficult and only a few small case series have been published.34 Affected babies usually present with prolonged jaundice beyond the neonatal period. Due to the absence of bile pigment in the stool, the stool is typically pale in colour (Fig 2). The passage of pale-coloured stool from a young infant should always raise the suspicion of BA. Liver function tests will reveal a cholestatic pattern that may help to differentiate from other causes of infantile jaundice. The gallbladder will be absent or small on ultrasound scan. At a later stage, the liver may demonstrate parenchymal or fibrotic changes. Although radio-isotope scan, such as a techetium-99m ethyl hepatic iminodiacetic acid scan may show impaired biliary excretion, this finding is not confirmatory. The diagnosis of BA should be confirmed by direct visualisation of the fibrotic biliary tract. If necessary, an intra-operative cholangiogram can be performed and is considered normal only if there is passage of contrast up to the intrahepatic ducts as well as down to the duodenum. This diagnostic procedure can now be performed via a laparoscopic approach.
 

Figure 2. A photograph showing the passage of pale-coloured stool should raise the suspicion of biliary atresia
 
In the majority of cases, the Kasai operation is still regarded as the operation of choice to treat BA and should be carried out in a highly specialised centre. Indeed, the outcome of Kasai operation in the UK has significantly improved following centralisation of all BA cases to three major centres after 1999.35 The operation consists of the excision of the fibrous cord at the porta and restoration of biliary drainage by portoenterostomy. Despite an uneventful operation, jaundice clearance can be achieved in only 60% to 70% of patients and the 5-year native liver survival rate is roughly 50% only.36 37 Factors that may improve the outcome including the timing of surgery, experience of the surgeon, surgical approach, and use of adjuvant medications have been studied extensively but a definitive answer is still lacking. Recurrent cholangitis has been found to be associated with a poor outcome and therefore each cholangitic episode should be treated aggressively.38 About 30% to 40% of post-Kasai patients will eventually develop end-stage liver failure and require liver transplantation as the salvage treatment.39
 
Alagille syndrome
Alagille syndrome is an autosomal dominant disease with a variable penetrance. The disorder is believed to be caused by a defect in the Notch signalling pathway that is important for normal embryonic development.40 This syndrome may present with infantile jaundice resembling BA but it also commonly affects other systems including the cardiovascular, musculoskeletal, and ocular systems. Some patients will have a characteristic facial expression (broad forehead, deep-set eyes and pointed chin). The manifestation in the hepatobiliary system is characterised by the paucity of intrahepatic bile ducts resulting in cholestatic jaundice during infancy. The diagnosis is sometimes confused with BA. It is not uncommon for the Kasai operation to be performed on a patient with Alagille syndrome with an invariably poor outcome. Preoperative distinction from BA is possible by genetic testing for JAG1 mutations but this mutation is also found in some patients with BA, leading to the belief that Alagille syndrome and BA belong to the same spectrum of disease.41 At present, the only effective treatment to correct Alagille syndrome is liver transplantation.42
 
Inspissated bile syndrome
Inspissated bile syndrome describes a condition where the bile duct is obstructed due to the impaction of a thick bile plug or sludge during the neonatal or infantile period. It is sometimes associated with prematurity, cystic fibrosis, or prolonged use of total parenteral nutrition but it can occur without an obvious underlying cause. The use of fluconazole has been reported as a risk factor for developing this disorder.43 The affected patient will present with symptoms of obstructive jaundice. Ultrasound examination may occasionally reveal the presence of sludge in the biliary system and dilatation of the bile duct. When the obstruction is mild, the bile plug may dissolve with hydration and high-dose ursodeoxycholic acid. Nonetheless in severe cases with prolonged obstruction, biliary obstruction may lead to liver damage and cirrhosis. Inspection of the gallbladder and the entire biliary tract should be performed to exclude other causes of obstructive jaundice. At the same time, an operative cholangiogram can be carried out to exclude BA by showing the passage of contrast into the intrahepatic ducts as well as small bowel (Fig 3). It also serves a therapeutic purpose by dissolving the bile plug. Some surgeons advocate concomitant cholecystectomy but it is not always necessary when the diagnosis is straightforward.
 

Figure 3. A photograph showing an operative cholangiogram in a 2-month-old boy with hyperbilirubinaemia. Operative cholangiogram is considered normal only if there is passage of contrast into the intrahepatic ducts (top arrow) as well as small bowel (bottom arrow)
 
Choledochal cyst
Choledochal cyst is a congenital disorder characterised by cystic dilatation of the intrahepatic and/or extrahepatic bile duct. The estimated incidence is around 1 in 5000 live births and slightly more in Asians.44 The diagnosis is usually made in the first few years of life when the patient presents with jaundice or abdominal pain. In recent years, antenatal diagnosis has become more common and more cysts are detected on prenatal scans. Occasionally, the disease can remain asymptomatic until adulthood when it presents with cholangitis. Malignant transformation into cholangiocarcinoma is a rare but possible sequelae of untreated choledochal cyst and thus, surgical excision is recommended.45
 
Choledochal cyst is traditionally classified into five types according to the Todani classification with type I cyst being the most common.46 Apart from a stenotic opening at the distal common bile duct causing biliary obstruction, the abnormal union of the pancreatic duct with a long common channel can predispose the reflux of pancreatic juice into the bile duct. Antenatally diagnosed choledochal cyst does not require fetal intervention and asymptomatic cysts after birth can be observed for a while. Nonetheless the observation period should not be long to avoid cholangitis. Earlier surgery has been found to be associated with less liver injury as well as operative complications.47 Cholangitic episodes should be treated with potent antibiotics and biliary drainage by either percutaneous or operative means if necessary to avoid progression to life-threatening sepsis.
 
Complete cyst excision and hepaticojejunostomy is regarded as the standard operative treatment for choledochal cyst. Since the first report of successful laparoscopic surgery in 1995,48 most centres now perform laparoscopic cyst excision (Fig 4). Previous studies have demonstrated superior outcomes compared with open surgery and it is safe and feasible in young infants. With the advances in laparoscopic techniques among paediatric surgeons, an even more minimally invasive approach by single-incision laparoscopic surgery has been adopted in some centres with satisfactory results.49
 

Figure 4. Cystic dilatation of the common bile duct (arrow) in a patient with choledochal cyst
 
Diagnostic algorithm
A diagnostic algorithm for infantile jaundice is summarised in Figure 5. Patients with jaundice beyond the neonatal period require a thorough evaluation for underlying causes. This should always start with recording a careful history of the antenatal and perinatal periods including prenatal ultrasonography findings, G-6-PD status, result of the newborn metabolic screen, etc. It is necessary to obtain both the child and mother’s medication history to identify any potential hepatotoxic agents. Although breast milk jaundice is a common cause of infantile jaundice, other aetiologies should be considered especially if the infant is not gaining weight, if the total bilirubin level exceeds 200 μmol/L, and in the presence of red flag symptoms. The passage of pale stool or tea-coloured urine must not be missed. Physical examination should not be limited to the abdomen and a systematic examination should be carried out to look for associated anomalies. Stool can be saved for inspection of the colour. Blood tests should include a complete blood picture (along with reticulocyte count and peripheral blood smear) to exclude haemolytic diseases. The bilirubin level is measured and it is essential to distinguish between unconjugated and conjugated hyperbilirubinaemia as they suggest different disease entities. An increased level of parenchymal enzyme aspartate aminotransferase/alanine aminotransferase may suggest liver injury due to virus-/drug-induced causes or autoimmune diseases. On the contrary, obstructive causes are suggested by an increased level of ductal enzyme alkaline phosphatase/gamma glutamyl transpeptidase. Serology and antigen of hepatitis viruses can be checked by sending blood samples to a microbiology laboratory. An ultrasound scan can detect the presence of anatomical anomalies in the biliary tract such as BA or choledochal cyst. A radioisotope scan will help to confirm the presence of biliary obstruction but does not always give clues to the underlying diagnosis. Laparoscopic examination of the biliary tract should be arranged when BA cannot be excluded from the above investigations. Nonetheless laparoscopy should also be arranged if cholestasis remains unresolved despite normal imaging to exclude the possibility of inspissated bile plug syndrome. Intra-operatively, a cholangiogram can be performed by injecting contrast into the gallbladder to confirm the patency of the biliary tract. It also serves the purpose of dissolving any bile plug that may be the cause of obstruction. A liver biopsy can be performed at the conclusion of the procedure to determine the degree of liver injury. The paucity of bile duct in a liver biopsy specimen is suggestive of Alagille syndrome.
 

Figure 5. Summary of diagnostic algorithm for infantile jaundice
 
Conclusion
Infantile jaundice is a common but potentially life-threatening condition. Referral to a specialist is necessary if jaundice persists beyond the neonatal period. The differentiation between medical and surgical causes should be made early on by measuring the blood level of conjugated and unconjugated bilirubin. Laparoscopy should be considered in any patient with persistent cholestatic jaundice to exclude BA that requires early intervention.
 
Declaration
As an editor of this journal, KKY Wong was not involved in the peer review process of this article. All other authors have no conflicts of interest to disclose. All authors had full access to the data, contributed to the study, approved the final version for publication, and take responsibility for its accuracy and integrity.
 
References
1. Suchy FJ. Neonatal cholestasis. Pediatr Rev 2004;25:388-96.
2. Wang JS, Tan N, Dhawan A. Significance of low or normal serum gamma glutamyl transferase level in infants with idiopathic neonatal hepatitis. Eur J Pediatr 2006;165:795-801. Crossref
3. Gartner LM, Arias IM. Studies of prolonged neonatal jaundice in the breast-fed infant. J Pediatr 1966;68:54-66. Crossref
4. Newman AJ, Gross S. Hyperbilirubinemia in breast-fed infants. Pediatrics 1963;32:995-1001.
5. Stiehm ER, Ryan J. Breast-milk jaundice. Report of eight cases and effect of breast feeding on incidence and severity of unexplained hyperbilirubinemia. Am J Dis Child 1965;109:212-6. Crossref
6. Maisels MJ, Clune S, Coleman K, et al. The natural history of jaundice in predominantly breastfed infants. Pediatrics 2014;134:e340-5. Crossref
7. Alonso EM, Whitington PF, Whitington SH, Rivard WA, Given G. Enterohepatic circulation of nonconjugated bilirubin in rats fed with human milk. J Pediatr 1991;118:425-30. Crossref
8. Gartner LM, Lee KS, Moscioni AD. Effect of milk feeding on intestinal bilirubin absorption in the rat. J Pediatr 1983;103:464-71. Crossref
9. Kumral A, Ozkan H, Duman N, Yesilirmak DC, Islekel H, Ozalp Y. Breast milk jaundice correlates with high levels of epidermal growth factor. Pediatr Res 2009;66:218-21. Crossref
10. Gourley GR, Arend RA. beta-Glucuronidase and hyperbilirubinaemia in breast-fed and formula-fed babies. Lancet 1986;1:644-6. Crossref
11. Glucose-6-Phosphate Dehydrogenase (G6PD) Deficiency. DH2289, Clinical Genetic Service, Department of Health, Hong Kong. 2016. Available from: http://www.dh.gov.hk/english/main/main_cgs/files/DH2289E%20G6PD%20English.pdf. Accessed 1 Nov 2017.
12. Valaes T. Severe neonatal jaundice associated with glucose-6-phosphate dehydrogenase deficiency: pathogenesis and global epidemiology. Acta Paediatr Suppl 1994;394:58-76. Crossref
13. Kaplan M, Hammerman C. Severe neonatal hyperbilirubinemia. A potential complication of glucose-6-phosphate dehydrogenase deficiency. Clin Perinatol 1998;25:575-90, viii. Crossref
14. Kaplan M, Rubaltelli FF, Hammerman C, et al. Conjugated bilirubin in neonates with glucose-6-phosphate dehydrogenase deficiency. J Pediatr 1996;128:695-7. Crossref
15. American Academy of Pediatrics Subcommittee on Hyperbilirubinemia. Management of hyperbilirubinemia in the newborn infant 35 or more weeks of gestation. Pediatrics 2004;114:297-316. Crossref
16. Owens D, Evans J. Population studies on Gilbert’s syndrome. J Med Genet 1975;12:152-6. Crossref
17. Sieg A, Arab L, Schlierf G, Stiehl A, Kommerell B. Prevalence of Gilbert’s syndrome in Germany. Dtsch Med Wochenschr 1987;112:1206-8. Crossref
18. Long J, Zhang S, Fang X, Luo Y, Liu J. Neonatal hyperbilirubinemia and Gly71Arg mutation of UGT1A1 gene: a Chinese case-control study followed by systematic review of existing evidence. Acta Paediatr 2011;100:966-71. Crossref
19. Chang PF, Lin YC, Liu K, Yeh SJ, Ni YH. Prolonged unconjugated hyperbilirubinemia in breast-fed male infants with a mutation of uridine diphosphate-glucuronosyl transferase. J Pediatr 2009;155:860-3. Crossref
20. Maruo Y, Morioka Y, Fujito H, et al. Bilirubin uridine diphosphate-glucuronosyltransferase variation is a genetic basis of breast milk jaundice. J Pediatr 2014;165:36-41.e1. Crossref
21. Roy-Chowdhury N, Deocharan B, Bejjanki HR, et al. Presence of the genetic marker for Gilbert syndrome is associated with increased level and duration of neonatal jaundice. Acta Paediatr 2002;91:100-1. Crossref
22. Monaghan G, McLellan A, McGeehan A, et al. Gilbert’s syndrome is a contributory factor in prolonged unconjugated hyperbilirubinemia of the newborn. J Pediatr 1999;134:441-6. Crossref
23. Schwarz KB, Dell Olio D, Lobritto SJ, et al. Analysis of viral testing in nonacetaminophen pediatric acute liver failure. J Pediatr Gastroenterol Nutr 2014;59:616-23. Crossref
24. Moreira-Silva SF, Frauches DO, Almeida AL, Mendonça HF, Pereira FE. Acute liver failure in children: observations in Vitória, Espírito Santo State, Brazil. Rev Soc Bras Med Trop 2002;35:483-6. Crossref
25. Chen HL, Chang CJ, Kong MS, et al. Pediatric fulminant hepatic failure in endemic areas of hepatitis B infection: 15 years after universal hepatitis B vaccination. Hepatology 2004;39:58-63. Crossref
26. Sundaram SS, Alonso EM, Narkewicz MR, et al. Characterization and outcomes of young infants with acute liver failure. J Pediatr 2011;159:813-8.e1. Crossref
27. Zhu Y, Li YG, Wang JB, et al. Causes, features, and outcomes of drug-induced liver injury in 69 Children from China. Gut Liver 2015;9:525-33. Crossref
28. Burns J. The Principals of Midwifery: Including the Disease of Women and Children. London: Longman; 1817.
29. Ladd WE. Congenital atresia and stenosis of the bile ducts. JAMA 1928;91:1082-5. Crossref
30. Kasai M, Suzuki S. A new operation for “non-correctable” biliary atresia: hepatic portoenterostomy. Shujutsu 1959;(13):733-9.
31. Hartley JL, Davenport M, Kelly DA. Biliary atresia. Lancet 2009;374:1704-13. Crossref
32. Lakshminarayanan B, Davenport M. Biliary atresia: a comprehensive review. J Autoimmun 2016;73:1-9. Crossref
33. Cheng G, Tang CS, Wong EH, et al. Common genetic variants regulating ADD3 gene expression alter biliary atresia risk. J Hepatol 2013;59:1285-91. Crossref
34. Caponcelli E, Knisely AS, Davenport M. Cystic biliary atresia: an etiologic and prognostic subgroup. J Pediatr Surg 2008;43:1619-24. Crossref
35. Davenport M, Ong E, Sharif K, et al. Biliary atresia in England and Wales: results of centralization and new benchmark. J Pediatr Surg 2011;46:1689-94. Crossref
36. Bijl EJ, Bharwani KD, Houwen RH, de Man RA. The long-term outcome of the Kasai operation in patients with biliary atresia: a systematic review. Neth J Med 2013;71:170-3.
37. Lampela H, Ritvanen A, Kosola S, et al. National centralization of biliary atresia care to an assigned multidisciplinary team provides high-quality outcomes. Scand J Gastroenterol 2012;47:99-107. Crossref
38. Chung PH, Wong KK, Tam PK. Predictors for failure after Kasai operation. J Pediatr Surg 2015;50:293-6. Crossref
39. Wang P, Xun P, He K, Cai W. Comparison of liver transplantation outcomes in biliary atresia patients with and without prior portoenterostomy: a meta-analysis. Dig Liver Dis 2016;48:347-52. Crossref
40. McDaniell R, Warthen DM, Sanchez-Lara PA, et al. NOTCH2 mutations cause Alagille syndrome, a heterogeneous disorder of the notch signaling pathway. Am J Hum Genet 2006;79:169-73. Crossref
41. Dědič T, Jirsa M, Keil R, Rygl M, Šnajdauf J, Kotalová R. Alagille syndrome mimicking biliary atresia in early infancy. PLoS One 2015;10:e0143939. Crossref
42. Spinner NB, Leonard LD, Krantz ID. Alagille Syndrome. In: Adam MP, Ardinger HH, Pagon RA, Wallace SE, et al, editors. GeneReviews®. Seattle; 1993.
43. Brownschidle S, Zenali M, Potenta S, Sartorelli K, Sullivan J. Neonatal cholestasis due to biliary sludge—review and report of a case associated with use of Diflucan. Ann Clin Pathol 2014;2:1018.
44. Singham J, Schaeffer D, Yoshida E, Scudamore C. Choledochal cysts: analysis of disease pattern and optimal treatment in adult and paediatric patients. HPB (Oxford) 2007;9:383-7. Crossref
45. Madadi-Sanjani O, Wirth TC, Kuebler JF, Petersen C, Ure BM. Choledochal cyst and malignancy: A plea for lifelong follow-up. Eur J Pediatr Surg 2017 Dec 19. Epub ahead of print. Crossref
46. Todani T, Watanabe Y, Toki A, Morotomi Y. Classification of congenital biliary cystic disease: special reference to type Ic and IVA cysts with primary ductal stricture. J Hepatobiliary Pancreat Surg 2003;10:340-4. Crossref
47. Diao M, Li L, Cheng W. Timing of surgery for prenatally diagnosed asymptomatic choledochal cysts: a prospective randomized study. J Pediatr Surg 2012;47:506-12. Crossref
48. Farello GA, Cerofolini A, Rebonato M, Bergamaschi G, Ferrari C, Chiappetta A. Congenital choledochal cyst: video-guided laparoscopic treatment. Surg Laparosc Endosc 1995;5:354-8.
49. Son TN, Liem NT, Hoan VX. Transumbilical laparoendoscopic single-site surgery with conventional instruments for choledochal cyst in children: early results of 86 cases. J Laparoendosc Adv Surg Tech A 2014;24:907-10. Crossref

Management of complications of ketamine abuse: 10 years’ experience in Hong Kong

Hong Kong Med J 2018 Apr;24(2):175–81 | Epub 6 Apr 2018
DOI: 10.12809/hkmj177086
© Hong Kong Academy of Medicine. CC BY-NC-ND 4.0
 
REVIEW ARTICLE
Management of complications of ketamine abuse: 10 years’ experience in Hong Kong
YL Hong, MSc1; CH Yee, FHKAM (Surgery)2, YH Tam, FHKAM (Surgery)1; Joseph HM Wong, FHKAM (Surgery)2; PT Lai, BN2; CF Ng, FHKAM (Surgery)2
1 Division of Paediatric Surgery and Paediatric Urology, Department of Surgery, The Chinese University of Hong Kong, Shatin, Hong Kong
2 SH Ho Urology Centre, Department of Surgery, The Chinese University of Hong Kong, Shatin, Hong Kong
 
Corresponding author: Prof CF Ng (ngcf@surgery.cuhk.edu.hk)
 
 Full paper in PDF
 
Abstract
Ketamine is an N-methyl-d-aspartate receptor antagonist, a dissociative anaesthetic agent and a treatment option for major depression, treatment-resistant depression, and bipolar disorder. Its strong psychostimulant properties and easy absorption make it a favourable candidate for substance abuse. Ketamine entered Hong Kong as a club drug in 2000 and the first local report of ketamine-associated urinary cystitis was published in 2007. Ketamine-associated lower–urinary tract symptoms include frequency, urgency, nocturia, dysuria, urge incontinence, and occasionally painful haematuria. The exact prevalence of ketamine-associated urinary cystitis is difficult to assess because the abuse itself and many of the associated symptoms often go unnoticed until a very late stage. Additionally, upper–urinary tract pathology, such as hydronephrosis, and other complications involving neuropsychiatric, hepatobiliary, and gastrointestinal systems have also been reported. Gradual improvement can be expected after abstinence from ketamine use. Sustained abstinence is the key to recovery, as relapse usually leads to recurrence of symptoms. Both medical and surgical management can be used. The Youth Urological Treatment Centre at the Prince of Wales Hospital, Hong Kong, has developed a four-tier treatment protocol with initial non-invasive investigation and management for these patients. Multidisciplinary care is essential given the complex and diverse psychological factors and sociological background that underlie ketamine abuse and abstinence status.
 
 
Introduction
Ketamine is an N-methyl-d-aspartate (NMDA) receptor antagonist, a dissociative anaesthetic agent that was first synthesised in the United States in 1962. It has been widely used in both human and veterinary medicine since 1971. It has also been used as a treatment for major depression, treatment-resistant depression, and bipolar disorder.1 However, its strong psychostimulant properties and easy absorption make it a favourable candidate for substance abuse. Ketamine abuse has become increasingly common over the past two decades. It entered Hong Kong as a club drug in 2000 and was initially used as a ‘top-up’ drug to ecstasy (3,4-methylenedioxymethamphetamine) by those aiming to elevate and redirect the ‘high’.2 It was viewed as a poor man’s version of cocaine, as it is available in powder form and can be consumed by snorting. By 2002, ketamine had become the drug of choice instead of a ‘top-up’ drug. Users self-administered ketamine to have a ‘time-out’ or ‘sit-down-to-float’ experience.2 3 Within a short period, the number of reported ketamine abusers in Hong Kong increased from 1605 in 2000 to its peak of 5280 in 2009. Ketamine remained the most popular psychotropic substance abused from 2005 to 2014 (Fig 1).4
 

Figure 1. Number of reported drug abusers in Hong Kong, 1996-2016, by common type of psychotropic substances (data source: Narcotics Division, HKSAR Government4)
 
The abuse of ketamine and its popularity nonetheless created a new medical entity. The first report of ketamine-associated urinary cystitis in Hong Kong was published in 2007.5 In the same year, Shahani et al reported a similar condition overseas.6 In the past decade, owing to the joint efforts of urologists, general surgeons, physicians, psychiatrists, pathologists, and basic scientists, we have gained a better understanding of other ketamine-associated conditions. This understanding spans from pathology to clinical management, from urological complications to upper-gastrointestinal (GI) complications, and from a mouse model to humans. We have also explored holistic ways to manage this condition in the long term, such as helping young adults to have a fresh start while living with potentially irreversible complications. This article reviews the evolution of local clinical awareness and management of these complications, with a particular focus on the work and contributions of local researchers.
 
Urological complications
Chu et al5 reported the first local case series of ketamine-associated bladder dysfunction in 2007. Ketamine-associated lower–urinary tract symptoms (LUTS) include frequency, urgency, nocturia, dysuria, urge incontinence, and occasionally painful haematuria. The exact prevalence of ketamine-associated urinary cystitis is difficult to assess because ketamine abuse and many of the associated symptoms often go unnoticed until a very late stage. A survey among 12 000 local secondary school students revealed that 18.5% of non-psychotropic substance users had LUTS, whereas 47.8% and 60.7% of psychotropic substance users and ketamine users had LUTS, respectively.7 Unpublished data from the same study showed that compared with non-psychotropic substance users, sole ketamine users were five times as likely to have LUTS, whereas concomitant users of ketamine and methamphetamine were eight times as likely to have LUTS.
 
In 2015, Yee et al8 reported the largest available cohort of both active and past ketamine users who had ketamine-associated uropathy. Among 463 patients, ketamine users had a significantly higher pelvic pain and urgency/frequency (PUF) score than ex-ketamine users. The PUF score is initially used to assess interstitial cystitis, and a higher PUF score correlates with worse symptoms. Among active ketamine users, a higher PUF score was found to correlate with a poorer quality of life and a smaller functional bladder capacity.8 Achieving abstinence from ketamine use and consuming smaller amounts of ketamine were factors that predicted improvement in PUF score.
 
As well as bladder involvement, upper–urinary tract pathology presenting as hydronephrosis and flank pain has also been reported (Fig 2). A study by Yee et al9 of 572 patients with ketamine-related LUTS found that up to 16.8% (n=96) of patients had hydronephrosis according to ultrasonography. Hydronephrosis was frequently accompanied by ureteral lesions, ureteral wall thickening, or vesicoureteral (vesicoureteric) reflux. Similarly, Chu et al10 reported that 51% (30/59) of their patients had hydronephrosis according to ultrasonography.
 

Figure 2. Intravenous urogram of a 28-year-old woman presenting to the Prince of Wales Hospital, showing bilateral hydronephrosis and small bladder
 
Pathophysiology
Although the exact mechanism of ketamine-associated cystitis remains to be explored, there is evidence that ketamine metabolites in the urine induce chemical irritation of the urothelium, thereby causing an inflammatory response.11 Severe irritation may lead to denudation of the urothelium and consequent transmural inflammation, loss of muscle thickness, fibrosis of the detrusor muscle, and ultimately poor urinary bladder compliance. Vesicoureteral reflux or urinary stasis in the ureter may occur, causing chronic ureteral inflammation and ureteral stricture. There is also evidence that both systemic and local inflammatory markers are elevated in ketamine users.10 12 In addition, the NMDA antagonist properties of ketamine may exert their effect via a central pathway.13
 
Neuropsychiatric complications
As ketamine is a psychostimulant, it is not surprising that it is associated with long-term neurocognitive problems. Chan et al14 found that when ketamine users were compared with healthy controls, they had impaired verbal fluency, cognitive processing speed, and verbal learning. Heavy ketamine use correlated with deficits in verbal memory and visual recognition memory. Liang et al15 also identified predominant verbal and visual memory impairment in ketamine poly-drug users. Unfortunately, these deficits persisted in ex-users. A much higher incidence of psychiatric co-morbidities, including psychosis, depression, and anxiety, was observed among ketamine users.16
 
Pathophysiology
Structural brain damage associated with ketamine abuse was supported by magnetic resonance imaging (MRI) by Wang et al.17 They were the first group to report patches of degeneration in the superficial white matter as early as 1 year after ketamine addiction onset. Cortical atrophy was also found in the frontal, parietal, or occipital cortices of addicts.17 Another MRI study also provided evidence of brain damage in chronic ketamine users. Reduced grey- and white-matter volumes were noted in the bilateral orbitofrontal cortex, right medial prefrontal cortex, and bilateral hippocampi. There was also significantly decreased connectivity inside the brain in chronic ketamine abusers.18
 
A series of studies on the neurotoxicity of ketamine suggested that ketamine could cause apoptosis of neuronal cells in both in-vitro and in-vivo models. Ketamine also potentially causes phosphorylation of tau protein, a marker of Alzheimer’s degeneration in the brain.19 20 21 22
 
Hepatobiliary complications
In 2009, Wong et al23 reported ketamine-associated hepatobiliary complications for the first time. Three ketamine abusers presented with recurrent epigastric pain and dilated bile ducts mimicking choledochal cysts. Subsequently, more similar cases were identified. Fusiform dilatation of the common bile duct was also observed.24 25 26 Liver biopsy confirmed development of active liver and/or bile duct injury. A study of 297 chronic ketamine abusers with urinary tract dysfunction showed that the prevalence of liver injury was 9.8%.27 These studies and reports show the possibility and severity of damage by ketamine to the hepatobiliary and pancreatic system.
 
Pathophysiology
The exact mechanism of ketamine-associated bile injury is still unknown. The associated rise in C-reactive protein suggests a possible inflammatory process in the liver parenchyma, including or excluding the bile duct.27 Others have postulated that either central or direct action of ketamine on the biliary smooth muscle in turn leads to the cholestasis and biliary dilatation observed in ketamine abusers.28
 
Gastrointestinal complications
In addition to urological complaints, GI problems are also frequently the symptoms for which ketamine abusers seek medical help. A review of 233 ketamine-related visits to accident and emergency departments found that 49 (21.0%) patients had abdominal pain, 23 (9.9%) had nausea or vomiting, and 41 (17.6%) had abdominal tenderness.29 Gastrointestinal complaints often co-exist with and precede the presentation of urological symptoms. Liu et al30 found that about a quarter (168; 27.5%) of 611 ketamine users who sought treatment for ketamine uropathy reported the presence of upper-GI symptoms, whereas only 42 (5.2%) of 804 non-ketamine users attending a general urology clinic reported similar symptoms (P<0.001). The majority of the symptoms reported were epigastric pain and recurrent vomiting. Nearly three-quarters of patients required hospitalisation for acute or chronic upper-GI symptoms. With the exception of acid reflux and perforated peptic ulcer, the prevalence of all the above-mentioned symptoms and hospitalisation rates were statistically significantly higher in ketamine users than in non-ketamine users. All 168 patients using ketamine had undergone oesophagogastroduodenoscopy during which biopsies were taken. Pathological findings ranged from gastritis to gastroduodenal erosions, peptic ulceration, and intestinal metaplasia.30
 
Liu et al30 also found that more than 80% of patients developed upper-GI symptoms before urological symptoms. Patients developed upper-GI symptoms after a mean (standard deviation) of 5.1 (3.1) years of ketamine use and developed uropathy symptoms after another 4.4 (3.0) years of ketamine use.30 Epigastric symptoms are not common in young people, but common in ketamine abusers. This difference may provide an opportunity to identify hidden ketamine abuse when assessing young patients with epigastric symptoms. The identification of ketamine use is important, as cessation of use can greatly improve GI symptoms.31 Further referral for help and counselling may improve psychological and physical health and promote long-term ketamine abstinence.
 
Pathophysiology
The exact pathophysiological mechanism by which ketamine produces upper-GI toxicity remains unknown but there are several postulations. First, ketamine, as an NMDA antagonist, might act on local smooth muscle or the central nervous system, thereby affecting gastric motility and leading to cramping pain. Second, microvascular damage by ketamine and its metabolites, which was believed to be a possible cause of ketamine uropathy, might also cause similar microvascular damage in the stomach and duodenum, leading to ischaemic pain and inflammation. Likewise, circulating ketamine might also trigger some unknown autoimmune responses, and thus induce interstitial inflammation in the urinary and GI tracts. Finally, as many ketamine abusers like to swallow the nasal drips occurring from ketamine inhalation, the swallowed ketamine might also induce direct cytotoxic injury to the vulnerable GI tract.30
 
Management
As in the management of other substance abuse, abstinence is the key to success in overall management of ketamine use. Whereas other treatment modalities may relieve symptoms and hasten the recovery process, many ketamine abusers have complicated underlying psychosocial problems and psychiatric co-morbidities. Long-term and consistent support and encouragement from doctors, nurses, social workers, family, and friends are vital for success.
 
Abstinence from ketamine use
Recurrence of symptoms after resuming ketamine use highlights the importance of ketamine abstinence. Studies have shown that abstinence leads to symptomatic improvement. Compared with active ketamine abusers, those who had abstained for 1 year had significantly lower PUF scores and a larger voided volume. There was a trend towards higher voided volumes and lower PUF scores as duration of ketamine cessation increased, although neither variable was statistically significant.32 Another follow-up study of 101 participants who had abstained from ketamine and 218 active ketamine users showed that the abstinence group had a statistically significantly lower PUF score, and a higher functional bladder capacity.8 Moreover, abstinence was the only protective factor associated with fewer symptoms, larger voided volume, and bladder capacity.33
 
Nonetheless, abstinence does not lead to immediate and full recovery of symptoms. Gradual improvement can be expected but sustained abstinence is the key to recovery. Patience and continuous support are of paramount importance. A study showed that on admission to a drug rehabilitation centre, 90% of 40 female ex-ketamine users still had active urinary symptoms, with increased 24-hour urinary frequency, lower maximum voided volume, smaller median functional bladder capacity, and higher mean Urogenital Distress Inventory Short Form (UDI-6) and Incontinence Impact Questionnaire Short Form (IIQ-7) scores, when compared with age-matched controls who attended a general gynaecology clinic. After having stopped using ketamine for 3 months or more, mean 24-hour urinary frequency and mean UDI-6 and IIQ-7 scores decreased, and maximum voided volume increased. These scores further improved after another 3 months, although this group continued to perform more poorly in all aspects compared with controls.34
 
Medical and surgical management
As ketamine-associated uropathy is an evolving ‘disease entity’, the exact pathophysiology remains to be elucidated. Some of the clinical features share similarities with interstitial cystitis. Protocols are being developed to cater to the needs of patients in Hong Kong. A one-stop service model has been adopted by the Youth Urological Treatment Centre at the Prince of Wales Hospital since 2011 (Fig 3). The standard treatment protocol involves four tiers of treatment, starting with an initial non-invasive investigative approach, including questionnaire assessment of symptoms and calculation of (1) functional bladder capacity by measuring voided volume using uroflowmetry and (2) residual urine using ultrasound bladder scanning. This non-invasive investigative approach helps gain patients’ trust and improve adherence to later follow-up.
 

Figure 3. One-stop screening clinic model of the Youth Urological Treatment Centre, Prince of Wales Hospital, Hong Kong
 
First-tier treatment includes oral non-steroidal anti-inflammatory drugs (NSAIDs) (eg, diclofenac) and anticholinergics (eg, solifenacin) or COX-II inhibitors (eg, etoricoxib) if patients cannot tolerate NSAIDS. Simple analgesics such as paracetamol and phenazopyridine are used for pain control. The Youth Urological Treatment Centre has reported the largest series of patients with ketamine-associated uropathy and their corresponding outcomes. Of 290 patients with ketamine cystitis who received first-line treatment, 202 (69.7%) reported symptom improvement and a reduction in PUF scores. Functional bladder capacity was also shown to have improved.8
 
The opioid group of analgesics and pregabalin are used in the next tier of pain-control treatment when first-tier treatment is insufficient for symptom relief. Sixty-two patients received second-line treatment and 42 (67.7%) responded to treatment.8
 
Third-tier treatment consists of a course of intravesical instillation of sodium hyaluronate (6-weekly instillations followed by 2-monthly instillations) attempting to repair the glycosaminoglycan layer. The drug is given to patients whose symptoms remain uncontrolled after second-tier treatment. Seventeen patients in the cohort received the third-tier treatment and eight completed the course. Significant improvement in voided volume was noted and five were able to reduce their oral medication usage after treatment. No significant adverse effects were reported.8
 
Unfortunately, for a proportion of patients with extremely refractory symptoms, surgery becomes the fourth-tier treatment of choice. In the Youth Urological Treatment Centre series, one patient in the cohort required hydrodistension and another underwent robotic-assisted laparoscopic augmentation cystoplasty. The patient with hydrodistension experienced a recurrence of symptoms post-treatment.8 Ng et al35 reported on four patients who underwent augmentation cystoplasty. Although they showed initial improvement, all patients relapsed and resumed ketamine use postoperatively. Three of the patients showed a further deterioration in renal function, secondary to new-onset ureteral strictures and/or sepsis. Therefore, patient selection, education, close follow-up, and support are vital to the success of augmentation cystoplasty.35
 
Multidisciplinary care
Given the complex and diverse psychological factors and sociological background contributing to an individual’s decision to abuse ketamine or achieve abstinence, joint multidisciplinary efforts are required to help affected young adults. Doctors, social workers, teachers, psychiatrists, psychologists, nurses, and patients’ families all need to support them on their long road to recovery, to help them rehabilitate physically and achieve sustained abstinence from ketamine.33 36 37
 
Conclusion
Since the initial discovery of ketamine-associated uropathy, the impact of this disease entity has become more prominent in Asian countries. Thanks to the joint efforts of urologists, gynaecologists, surgeons, psychiatrists, pathologists, and social workers, as well as the support of local government, the extent of medical complications has been revealed to also involve the brain, liver, and GI system. Many ketamine abusers are ‘hidden’ and can use ketamine stealthily at home for years without their family noticing. Clinicians must take the opportunity to identify hidden abusers when they consult for non-specific symptoms such as epigastric pain and LUTS. Doing so will not only enable early diagnosis of ketamine-associated uropathy, but it will also help provide appropriate medical treatment in a timely manner. In addition to medical therapy, referral for appropriate psychosocial support is essential to sustain abstinence and manage underlying psychosocial problems.
 
Acknowledgement
The Youth Urological Treatment Centre was developed by joint efforts of The Chinese University of Hong Kong and the Hong Kong Hospital Authority, with generous support from the Beat Drugs Fund of the Narcotics Division, Security Bureau, Government of the Hong Kong Special Administrative Region.
 
Declaration
The authors have no conflicts of interest to disclose.
 
References
1. Hasselmann HW. Ketamine as antidepressant? Current state and future perspectives. Curr Neuropharmacol 2014;12:57-70. Crossref
2. Joe Laidler KA. The rise of club drugs in a heroin society: the case of Hong Kong. Subst Use Misuse 2005;40:1257-78. Crossref
3. Joe-Laidler K, Hunt G. Sit down to float: the cultural meaning of ketamine use in Hong Kong. Addict Res Theory 2008;16:259-71. Crossref
4. Narcotics Division, Security Bureau, HKSAR Government. Statistical tables customization. Available from: http://cs-crda.nd.gov.hk/en/enquiry.php. Accessed 22 Sep 2017.
5. Chu PS, Kwok SC, Lam KM, et al. ‘Street ketamine’–associated bladder dysfunction: a report of ten cases. Hong Kong Med J 2007;13:311-3.
6. Shahani R, Streutker C, Dickson B, et al. Ketamine-associated ulcerative cystitis: a new clinical entity. Urology 2007;69:810-2. Crossref
7. Tam YH, Ng CF, Wong YS, et al. Population-based survey of the prevalence of lower urinary tract symptoms in adolescents with and without psychotropic substance abuse. Hong Kong Med J 2016;22:454-63. Crossref
8. Yee CH, Lai PT, Lee WM, et al. Clinical outcome of a prospective case series of patients with ketamine cystitis who underwent standardized treatment protocol. Urology 2015;86:236-43. Crossref
9. Yee CH, Teoh YC, Lai PT, et al. The risk of upper urinary tract involvement in patients with ketamine-associated uropathy. Int Neurourol J 2017;21:128-32. Crossref
10. Chu PS, Ma WK, Wong SC, et al. The destruction of the lower urinary tract by ketamine abuse: a new syndrome? BJU Int 2008;102:1616-22. Crossref
11. Chu PS, Ng CF, Ma WK. Ketamine uropathy: Hong Kong experience. In: Yew DT, editor. Ketamine: Use and Abuse. CRC Press; 2015: 207-26.
12. Division of Urology, Department of Surgery, Princess Margaret Hospital and Tuen Mun Hospital. Research on Urological Sequelae of Ketamine Abuse. Available from: http://www.nd.gov.hk/pdf/20110307_beat_drug_fund_report.pdf. Accessed 22 Sep 2017.
13. Jankovic SM, Jankovic SV, Stojadinovic D, et al. Effect of exogenous glutamate and N-methyl-D-aspartic acid on spontaneous activity of isolated human ureter. Int J Urol 2007;14:833-7. Crossref
14. Chan KW, Lee TM, Siu AM, et al. Effects of chronic ketamine use on frontal and medial temporal cognition. Addict Behav 2013;38:2128-32. Crossref
15. Liang HJ, Lau CG, Tang A, et al. Cognitive impairments in poly-drug ketamine users. Addict Behav 2013;38:2661-6. Crossref
16. Tang WK, Morgan CJ, Lau GC, et al. Psychiatric morbidity in ketamine users attending counselling and youth outreach services. Subst Abus 2015;36:67-74. Crossref
17. Wang C, Zheng D, Xu J, et al. Brain damages in ketamine addicts as revealed by magnetic resonance imaging. Front Neuroanat 2013;7:23. Crossref
18. Narcotics Division, Security Bureau, HKSAR Government. Evidence of Brain Damage in Chronic Ketamine Users—a Brain Imaging Study. Available from: http://www.nd.gov.hk/pdf/Evidence-of-Brain-Damage-in-Chronic-Ketamine-Users_Final-report.pdf. Accessed 22 Sep 2017.
19. Yeung LY, Wai MS, Fan M, et al. Hyperphosphorylated tau in the brains of mice and monkeys with long-term administration of ketamine. Toxicol Lett 2010;193:189-93. Crossref
20. Narcotics Division, Security Bureau, HKSAR Government. Long-term Ketamine Abuse and Apoptosis in Cynomolgus Monkeys and Mice. Available from: http://www.nd.gov.hk/pdf/long_term_ketamine_abuse_apoptosis_in_cynomologus_monkeys_and_mice/final_report_with_all_attachments.pdf. Accessed 22 Sep 2017.
21. Tan S, Rudd JA, Yew DT. Gene expression changes in GABA(A) receptors and cognition following chronic ketamine administration in mice. PLoS ONE 2011;6:e21328. Crossref
22. Mak YT, Lam WP, Lü L, et al. The toxic effect of ketamine on SH-SY5Y neuroblastoma cell line and human neuron. Microsc Res Tech 2010;73:195-201.
23. Wong SW, Lee KF, Wong J, et al. Dilated common bile ducts mimicking choledochal cysts in ketamine abusers. Hong Kong Med J 2009;15:53-6.
24. Ng SH, Lee HK, Chan YC, et al. Dilated common bile ducts in ketamine abusers. Hong Kong Med J 2009;15:157.
25. Cheung TT, Poon RT, Chan AC, et al. Education and imaging. Hepatobiliary and pancreatic: cholangiopathy in ketamine user—an emerging new condition. J Gastroenterol Hepatol 2014;29:1663. Crossref
26. Lui KL, Lee WK, Li MK. Ketamine-induced cholangiopathy. Hong Kong Med J 2014;20:78.e1-2. Crossref
27. Wong GL, Tam YH, Ng CF, et al. Liver injury is common among chronic abusers of ketamine. Clin Gastroenterol Hepatol 2014;12:1759-62.e1. Crossref
28. Lo RS, Krishnamoorthy R, Freeman JG, et al. Cholestasis and biliary dilatation associated with chronic ketamine abuse: a case series. Singapore Med J 2011;52:e52-5.
29. Ng SH, Tse ML, Ng HW, et al. Emergency department presentation of ketamine abusers in Hong Kong: a review of 233 cases. Hong Kong Med J 2010;16:6-11.
30. Liu SY, Ng SK, Tam YH, et al. Clinical pattern and prevalence of upper gastrointestinal toxicity in patients abusing ketamine. J Dig Dis 2017;18:504-10. Crossref
31. Poon TL, Wong KF, Chan MY, et al. Upper gastrointestinal problems in inhalational ketamine abusers. J Dig Dis 2010;11:106-10. Crossref
32. Mak SK, Chan MT, Bower WF, et al. Lower urinary tract changes in young adults using ketamine. J Urol 2011;186:610-4. Crossref
33. Tam YH, Ng CF, Pang KK, et al. One-stop clinic for ketamine-associated uropathy: report on service delivery model, patients’ characteristics and non-invasive investigations at baseline by a cross-sectional study in a prospective cohort of 318 teenagers and young adults. BJU Int 2014;114:754-60. Crossref
34. Cheung RY, Chan SS, Lee JH, et al. Urinary symptoms and impaired quality of life in female ketamine users: persistence after cessation of use. Hong Kong Med J 2011;17:267-73.
35. Ng CF, Chiu PK, Li ML, et al. Clinical outcomes of augmentation cystoplasty in patients suffering from ketamine-related bladder contractures. Int Urol Nephrol 2013;45:1245-51. Crossref
36. Ng CF. Editorial comment to possible pathophysiology of ketamine-related cystitis and associated treatment strategies. Int J Urol 2015;22:826. Crossref
37. Chu PS, Dasgupta P. Lessons learned from Asian Urology. BJU Int 2014;114:633. Crossref

Understanding breast cancer screening—past, present, and future

Hong Kong Med J 2018 Apr;24(2):166–74 | Epub 6 Apr 2018
DOI: 10.12809/hkmj177123
© Hong Kong Academy of Medicine. CC BY-NC-ND 4.0
 
REVIEW ARTICLE  CME
Understanding breast cancer screening—past, present, and future
Jacqueline CM Sitt, MB, BS, FHKCR; CY Lui, MB, ChB, FHKCR; Lorraine HY Sinn, MB, BS, FHKCR; Julian CY Fong, MB, BS, FHKCR
Hong Kong Women’s Imaging Limited, Suite 319, 3/F, Central Building, Central, Hong Kong
 
Corresponding author: Dr Jacqueline CM Sitt (jacquelinesitt@gmail.com)
 
 Full paper in PDF
 
Abstract
This article provides an up-to-date overview of breast cancer mammography screening and briefly discusses its history, controversies, current guidelines, practices across Asia, and future directions. An emphasis is made on shared decision-making—instead of giving just a ‘yes’ or ‘no’ answer to patients, the focus should be on providing sufficient information about the pros and cons of screening to help women make a personal, informed choice. Frontline experts, including breast surgeons, oncologists, breast radiologists, and their representative professional associations should all participate in guideline panels, with the goal of improving cancer detection, reducing mortality, and improving patient outcome.
 
 
Introduction
This article provides an up-to-date overview of breast cancer mammography screening and briefly discusses its history, controversies, current guidelines, practices across Asia, and future directions. An emphasis is made on shared decision-making—instead of giving just a ‘yes’ or ‘no’ answer to patients, the focus should be on providing sufficient information about the pros and cons of screening to help women make a personal, informed choice.
 
Goals and advantages of breast cancer screening
The goal of mammographic screening (and other breast-cancer screening tests) is to detect breast cancer earlier than it would otherwise manifest clinically, when it is less likely to have spread. Data clearly show that detection of breast cancers at smaller sizes and lower (earlier) stages is associated with better patient outcomes, lower morbidity, and reduced breast cancer deaths.1 Reduced morbidity is likely to be related to feasibility of breast conservation and hence less extensive surgery, fewer associated complications such as lymphoedema, less chemotherapy, and hence fewer adverse effects.2 Other benefits of diagnosing screen-detected cancers at an earlier stage also include a lower cost of treatment and consequent reduced financial burden on health care resources.3
 
Current guidelines
The Table summarises the mammography guidelines from selected nations.4 5 In common, all organisations emphasise that the benefits of screening outweigh the harm at all ages.3 6 They all endorse informed decision-making and the importance of informing women about both benefits and limitations of screening. However, there remain legitimate concerns about guideline differences, including the complexity of the guidelines; weak adherence to creating opportunities for informed decision-making; unreadiness of referring clinicians to discuss benefits, limitations, and harm associated with screening; and the lack of reminder systems, which results in weaker adherence to recommended screening intervals. Despite these concerns, it is widely accepted that high adherence to even the least aggressive guidelines will save more lives than the current weak adherence to regular screening programmes.4
 

Table. Summary of mammography guidelines from selected nations4 5
 
Current scientific evidence to support screening
Randomised controlled trials (RCTs) have been the gold standard for proving that early detection with mammography decreases mortality from breast cancer. Since the very first screening RCT performed in New York in the 1960s, there have been eight prospective RCTs and numerous subsequent meta-analyses published. Most well-executed RCTs demonstrated a 20% to 30% decrease in mortality from breast cancer when women were invited for screening. These results laid a solid foundation for population-based screening programmes worldwide.1 7 8
 
Subsequent studies that generated data from population-based screening programmes have provided further evidence of the benefits of screening mammography. The true benefit reported (in terms of mortality reduction) ranged from 38% to 49%, even higher than that shown by RCTs. This difference demonstrates that service screening studies measure the direct effect of screening on women who actually underwent mammography, and not just those who were invited to undergo mammography (as opposed to the methodology of RCTs). Service screening studies also tend to measure the effect of more recent screening practices that have benefited from improved mammography technology, better breast positioning techniques, and improved interpretive skills.1 9
 
Understanding screening controversy and ‘mammographic wars’
The Canadian National Breast Screening Study: root of all controversies
One exception to the RCTs that reported unfavourable results of mammographic screening was the Canadian National Breast Screening Study (CNBSS). It was conducted between 1980 and 1985, and was divided into two parts. The first CNBSS included approximately 50 000 volunteer women aged 40 to 49 years, and determined the mortality benefit in the experimental group, who were assigned to annual screening mammography plus clinical breast examination (CBE) versus the control group who received usual care.10 The second CNBSS had almost 40 000 volunteer women aged 50 to 59 years, and compared the benefit of annual mammography plus CBE with that of yearly CBE alone.11
 
From the time the results were first published in 1992 and again after follow-up in 2000, 2002, and 2014, the CNBSS has been controversial, because it is the only RCT to have reported no decrease in mortality associated with an invitation to screening. The study also claimed a 22% overdiagnosis of screen-detected invasive cancer, increasing to up to 35% when cases of ductal carcinoma in situ (DCIS) were included.12 13 14 However, the credibility and scientific value of the CNBSS study have been repeatedly questioned in peer-reviewed publications.15 16 17 18 19 Most criticisms of this study are related to vulnerabilities and shortcomings in its execution, including flaws in the randomisation process, lack of statistical power, non-generalisable results, poor quality imaging, suboptimal mammographic image acquisition and interpretation by untrained personnel, and inconsistent thresholds for interpretation.
 
The flaws in the randomisation process principally arose from three areas. First, unlike all other RCTs, potential participants in the Canadian trials initially underwent a careful physical examination. Second, women with positive findings on physical examination, including palpable lumps, skin or nipple retraction, and even palpable axillary adenopathy, were not excluded from this ‘screening’ trial.18 Finally, randomisation was unblinded and decentralised. Because almost 80% of women with advanced palpable cancers were assigned to the screening arm in the first round of the study, there has been speculation that concerned clinicians did not follow the randomisation process, but rather assigned some symptomatic women to the study group so that they would undergo mammography.19 Whether the imbalance was due to intentional tampering or occurred by chance alone, the net effect was the same—namely, a failure to produce two equal cohorts of patients for comparison.
 
The CNBSS was also criticised at the time of the trial for poor quality mammography, even compared with mammographic imaging of that era.15 20 To reduce radiation dose, mammography for the trial was performed without the benefit of scatter-reducing grids despite their routine use and availability. Standard imaging for much of the trial used a straight lateral view, not a mediolateral-oblique view, which images more tissue. The combination of poor quality imaging and the investigators’ resistance to taking corrective action led two advisors’ resignation in protest. In addition, technologists who participated in the trial received no special training in performing mammography. Radiologists new to mammography also received no training in interpretation.18 There was also a lack of immediate follow-up after recommendations for biopsy had been made. Overall, about 25% of the recommended biopsies were ultimately not performed.18
 
The CNBSS trials are an excellent example of the need to carefully consider all facets of a large-scale screening trial before accepting its results as scientifically valid. The numerous design and execution flaws described above explain in large part why the results of the CNBSS are dramatically different from those of all other RCTs. Ultimately, on the basis of the methodology of the CNBSS, the World Health Organization excluded those results when analysing the breast-screening data in the International Agency for Research on Cancer report.21
 
Controversial meta-analysis results from the Nordic Cochrane Centre
The greatest debate on the value of breast screening arose after the publication of a highly controversial but frequently quoted meta-analysis by Gotzsche (a medical statistician and director of the Nordic Cochrane Centre) and Olsen in The Lancet in 2000. Their study concluded that there was no benefit of mortality reduction by screening, after discarding six of eight RCTs because they deemed the randomisation to be “inadequate”. The only two RCTs included in their analysis showed no benefit, including the Malmo trial and the notorious CNBSS.7 22
 
Gotzsche and Olsen’s critique and methodology have caused much controversy and, in turn, have been criticised heavily by leading expert breast imagers, public health clinicians, and professional bodies such as the Society of Breast Imaging.7 8 23 24 25 26 27 Gotzsche and Olsen’s use of quoted figures from cancer registries rather than actual patient data, their selective approach to studies, and in particular the ignoring of the flaws of the CNBSS, have received the harshest criticism. Many experts have commented that Gotzsche and Olsen overstated the limitations of most of the well-executed RCTs, thereby reflecting a “context-free” application of guidelines in a way that did not address the real issues relevant to the effectiveness of mammographic screening. Moreover, Gotzsche and Olsen’s recommendation to abandon screening altogether has hampered collaborative efforts to improve breast cancer detection and control.27
 
Swiss Medical Board’s decision to stop population-based screening in 2014
In February 2014, the Swiss Medical Board attempted to overturn the widespread practice of mammography screening in Switzerland by stating that new systematic mammography screening programmes should not be introduced, irrespective of women’s age, and recommended that existing programmes should be discontinued. Their main argument was that the absolute risk reduction in breast cancer mortality was low and that the adverse consequences of screening (false-positive test results, overdiagnosis, overtreatment, and high costs and expense of follow-up tests and procedures) were substantial.28 29
 
The Swiss Medical Board’s attempt initiated a new phase of heated arguments and debate about the benefits of screening. Expert breast cancer clinicians in both the United States and Europe (including leading cancer associations in Switzerland) rejected their report. One criticism was that the Swiss Medical Board relied heavily on the controversial work by Gotzsche and Olsen and again quoted data from the flawed CNBSS. Another criticism that attracted great attention was the questionable “expert panels” of the board: they included a medical ethicist, a clinical epidemiologist, a clinical pharmacologist, an oncology surgeon, a nurse scientist, a lawyer, and a health economist. Frontline breast imagers, with expertise in diagnosing breast diseases, were excluded from the review panels because of a “conflict of interest”.28 29
 
The Swiss Medical Board did not adequately consider the fact that assessment of the balance between benefit and harm involves a value judgement that each woman should make only after she is fully informed about the strengths and weaknesses of screening mammography. They also disregarded the extensive literature in support of screening mammography (RCTs and population service screening studies), making their attempt at stopping national mammography screening unjustified.
 
Potential risks of screening overstated
Commonly mentioned potential harms of screening include false-positive mammograms, recall for additional imaging, a false-positive biopsy, missed breast cancer, radiation dose, patient anxiety, and, above all, overdiagnosis.
 
Overdiagnosis is defined as the detection (and subsequent actions taken) of a cancer by screening that would not have progressed to become symptomatic in a woman’s lifetime.1 The estimation of overdiagnosis is complex, highly debated, and very difficult to measure.3 Reported figures range widely, from 0% to 50%, vary greatly in terms of methodological rigour, and testify to the inexact nature of most mathematical models.30 31 32 33 34 When appropriate adjustments for temporal trends, risk factors, and lead time are considered, the level of overdiagnosis should be low, within the range of 0% to 10%.32 Importantly, a recent study of over 5 million women (aged 50-64 years) screened by the United Kingdom’s National Health Service showed that there was a significant negative association between the detection of DCIS at screening and invasive interval cancers. In that study, Duffy and colleagues analysed the data from four consecutive screen years and the 36-month outcome after each relevant screen. For every three screen-detected cases of DCIS, there was one less interval case of invasive cancer over the next 3 years. They agreed that the policy on detection and treatment of DCIS is worthwhile and can prevent subsequent invasive cancers.35
 
The effect of screening on heightening a patient’s anxiety has also been long questioned by critics, but the magnitude of the effect may have been over-exaggerated. In a survey of over 1200 women with a 6-question anxiety scale to understand the short-term and long-term impact of a recall examination, women involved in the digital mammographic imaging screening trial demonstrated only a transient, limited increase in anxiety after a false-positive mammogram compared with those with a negative mammogram, and there was no difference between the two groups’ intention to undergo mammography again in the subsequent 2 years.36 Schwartz et al reported that 96% of American women who received a false-positive mammography report were glad that they underwent the test and remained supportive of screening.37 Most women agreed that the anxiety, inconvenience, and the few image-guided needle biopsies using local anaesthesia associated with a recall from screening, were minor compared with dying of breast cancer.38
 
To summarise, papers citing a high rate of overdiagnosis in screening (in the magnitude of 20% or higher) and claiming that false-positives are a significant cause of patient anxiety are believed by most experts to be overstating the case.
 
Harms of not screening underestimated
Although it is important to discuss all aspects of screening asymptomatic women (including potential harm), the harm of not attending screening is underestimated and not discussed. For instance, women who do not attend screening have significantly larger tumours, a higher stage at diagnosis, poorer overall and disease-specific survival, and higher costs of treatment.39 It has been estimated that the cost of treating advanced metastatic breast cancer exceeds US$ 250 000 per patient, and the average cost of treating advanced cancer in the first year after diagnosis is almost double that of early cancers, mainly owing to the difference in costs of chemotherapy.3 40 The cost of treatment and lost productivity each year will far exceed the cost of annual screening and, additionally, do not include the indirect value of the lives saved (as a productive member of workforce).1
 
Situation in Asia
Rising breast cancer incidence: a universal phenomenon among Asian women
The incidence of breast cancer continues to increase worldwide. It remains highest in the United States and Europe, but has been increasing substantially in Asian countries over the past three decades.41 Studies that compare invasive breast cancer data from Asia with those from the United States over a 20-year period have shown that female breast cancer incidence among Asian and Western populations is more similar than expected.42 The incidence of female breast cancer in China will continue to rise, and is expected to exceed 100 per 100 000 women by 2021, giving a total of 2.5 million cases.43
 
According to GLOBOCAN 2012 of the International Agency for Research on Cancer, the specialised cancer research agency of the World Health Organization, almost a quarter (24%) of all breast cancers were diagnosed within the Asia-Pacific region, with the greatest number occurring in China (46%).44 The age-standardised incidence rate was highest among Taiwanese (65.9 per 100 000), followed by Singaporeans, South Koreans, and Japanese.44 In a multiracial country such as Singapore, Chinese women have been noted to have a significantly higher risk of developing breast cancer than Malays and Indians.45
 
The disease burden in Hong Kong is no different. Locally, the age-standardised incidence rate was 58.8 per 100 000 in 2015, with over 3900 new cases per year.46 A study of the local trend in female breast cancer incidence from 1973 to 1999 by the University of Hong Kong showed a significant yearly increase of an average of 3.6%; the increase was most marked and continued to accelerate in the younger age-groups. It was speculated that such trend changes were related to Westernisation of lifestyle.47 All these data indicate that the disease burden in Hong Kong is increasing and comparable to that of all other civilised Asian countries and cities.
 
Breast screening programmes in Asia
Breast screening services in Asian countries and cities are highly variable: some have advanced nationwide screening programmes and others have less developed programmes.48 South Korea and Taiwan are both well recognised for their experience in running such programmes, the former having the highest intake rate and the latter being the most well-structured.
 
South Korea places a very strong emphasis on screening for cancer control in general. Its national health service offers mammography and CBE every 2 years to women aged 40 or older, and at no cost to the 50% of people with the lowest incomes. Their programme is popular and widely accepted by the general public, and achieved an uptake of as high as 66% in 2014. Benefits of downstaging from screening were also observed. However, South Korea encountered a problem of potential overdiagnosis, with a noticeably higher false-positive rate when compared with other places.
 
Taiwan’s health authorities have been recognised for rolling-out well-organised and well-resourced screening programmes, with good support from a local randomised controlled trial showing a reduction in mortality by 40% with mammography screening.49 Since 2004, their health service has provided free breast screening to women aged 50 to 69 years, expanded in 2010 to those aged 40 to 49 years. By 2015, about 40% of the target population participated in screening. It is believed that the cause of the suboptimal participation rate was not due to capacity or outreach, but rather the Taiwanese public’s values and attitude. Nonetheless, with more resources being directed to public education and motivation, Taiwan’s health authorities are pushing their goal to 60% by 2018.
 
The experience of screening programmes in Singapore and Japan is more equivocal. Despite having sufficient scientific evidence to support their role in reducing mortality and reducing invasive cancer incidence, the participation rate has remained lower than expected, mostly owing to cultural barriers and paradigms, or a lack of central governing. Singapore established its national, population-wide screening programme (BreastScreen Singapore) in 2002 and now covers women aged 40 to 69 years. The participation rate has been noted to plateau at 40% since 2010, short of the target of 70%. The health promotion board believes that apart from cultural issues, costs (as screening is paid by an individual’s medical insurance account) constitute the greatest barrier to uptake.
 
The study of population-based screening in Japan has been complex, with scattered data owing to the lack of a single national organisation for monitoring. The participation rate remains lower than in other comparable Asian countries in the past century, again likely because of cultural paradigms. Despite these barriers, in the past decade, Japanese health officials have started designing their own methods and protocols for screening, particularly targeting the higher incidence of cancer among younger women (aged 40-49 years) and the large proportion of patients with dense breasts. After the launch of government-funded screening programmes, a clinical trial that started in 2007 (Japan Strategic Anti-cancer Randomised Trial, J-START) of over 70 000 women undergoing adjunctive ultrasonography to supplement mammography for screening showed an increased sensitivity and detection rate for early preclinical cancers.41
 
In China, there is no nationwide screening programme for breast cancer. A mammographic screening programme was attempted in 2005 but was abandoned because of lack of funding and concerns about false-positive diagnoses. Despite these barriers, national guidelines established in 2007 recommend annual mammography for women aged 40 to 49 years, and every 1 to 2 years for those aged 50 to 69 years. In a Beijing study of 1.46 million women (aged 35 to 59 years) who underwent screening by ultrasonography from 2009 to 2011, the cancer detection rate was 48.0 per 100 000, including 440 cases at early stage that constituted 69.7% of cases detected. The detection rate was lower than anticipated, maybe in part owing to the young age of the screened group and omission of mammography as a screening tool. Subsequently, a second-generation screening programme was initiated in 2012, after modification of the screening methods, cohort size (6 million), and target population that included women aged 35 to 64 years. The new screening procedures include parallel CBE and breast ultrasonography; women with suspicious findings from either examination are recommended to undergo mammographic imaging.50 Although the design of this screening protocol deviates from the standard practice of other countries, we believe that the programme will bring more research data and experience, and eventually lead to more comprehensive guidelines and consensus on a screening approach in China.
 
Breast-screening programmes in Hong Kong: room for development
The awareness of breast cancer and acceptance of screening in Hong Kong is growing, but is still inadequate. According to the latest Breast Cancer Registry Report No 8 (2016), which covers 13 453 breast cancer patients diagnosed from 2006 onwards, the mean and median age of patients at diagnosis was 52.6 and 51.3 years, respectively, and about two-thirds of patients were aged 40 to 59 years. The screening habits among these patients were poor, with over 60% never having undergone mammography screening before their cancer diagnosis.51
 
Although to date there has been no population-based screening for women in Hong Kong, opportunistic screening has long been practised in the private sector. The largest voluntary self-financed and self-referred opportunistic screening programme is run by the Tung Wah Group of Hospitals. In a retrospective review of their performance from 1998 to 2002 involving over 46 600 screening mammograms, a breast cancer detection rate of five cases per 1000 population was noted, which was comparable to the detection rate of Western screening programmes at that time.52
 
Regarding the input of expertise and quality assurance, the Hong Kong College of Radiologists issued their mammographic statement in 2006 (latest revision in 2015).53 Quoting desirable goals recommended by the United Kingdom and United States as a reference the statement sets specific benchmarks for standards of mammographic machines, quality of screening mammograms, radiation dose limits, and accreditation requirements of reporting radiologists.53 Given these guidelines, together with recent advances in mammographic technology, we believe that there should be room for further local development of large-scale quality breast-screening programmes.
 
Designing a screening programme for Hong Kong: can there be a protocol tailor-made for Chinese women?
When planning a breast-screening programme, it is necessary to decide whom to screen (ie, at what age and the target screening population) and how to screen (ie, screening method).
 
For the decision of whom to screen, we should note that the mean age at diagnosis of breast cancer in Chinese women is 45 to 55 years, considerably younger than for western women.43 Starting screening at age 40 or 45 years would likely be a better fit for Chinese women than starting at age 50 years, as recommended by some western guidelines. As for the target screening population, current data favour universal screening over risk-based screening (pre-selecting patients according to risk profile). First, one should note that 80% of women with newly diagnosed breast cancer have no family history (ie, first-degree relative) or other significant previous risk factors, and therefore risk-based screening will miss a majority of screen-detected breast cancers.3 54 Second, a recent 10-year population-based cohort study of over 1.4 million asymptomatic Taiwanese women undergoing various breast-cancer screening regimens showed that universal mammography screening based only on age and sex was more effective than other screening regimens (risk-based biennial mammography screening or annual CBE alone).49 In that study, universal biennial mammography screening was associated with a 41% reduction in mortality and a rate of overdiagnosis of only 13%. In contrast, risk-based biennial mammography (pre-selecting patients according to risk profile or risk score) did not lead to any statistically significant reduction in mortality. Moreover, among all screening regimens, only universal biennial screening was associated with a clear downstaging shift in tumours (30% reduction of stage 2+ cancers), a crucial factor that can improve patient outcome.49
 
Regarding methods of screening, conventional screening uses standard two-view full-field digital (two-dimensional; 2D) mammography. Multiple studies have proven that screening by digital breast tomosynthesis (DBT; also called three-dimensional mammography) can increase cancer detection rates compared with 2D mammography alone, and can reduce the recall rate for benign findings (false-positives). 1 55 A retrospective analysis of over 454 000 screens showed that use of DBT was associated with relative increases of 41% in invasive cancer detection, 49% in positive predictive value (PPV) for recall, and 21% in PPV for biopsy, in addition to a 15% reduction in the overall number of recalls.56 A recent meta-analysis by a Korean group also showed that screening with DBT increased detection of early invasive cancers of <2 cm.57 The American College of Radiology Commission on Breast Imaging now recommends that mammography and DBT are “usually appropriate” for screening of average-risk women, noting that DBT addresses some limitations of standard digital mammography.58 In Hong Kong, DBT has been increasingly adopted to replace or serve as an adjunct to 2D mammography in opportunistic screening. We anticipate that the shift to DBT screening will become a global trend.
 
The use of whole-breast ultrasonography to screen dense breasts is also commonly adopted in Asia, including for opportunistic screening in Hong Kong. In Japan, this practice was reinforced by a government-funded RCT (J-START) that studied the use of adjunctive ultrasonography to supplement mammography in screening over 70 000 women. The J-START study showed favourable results of increased sensitivity and detection rate for early, preclinical cancers.41
 
Screening for high-risk women is often considered a separate entity. According to the American College of Radiology’s Appropriateness Criteria, women at high risk due to prior mantle radiation between the ages of 10 and 30 years should start mammography 8 years after radiation therapy, but not before age 25. For women with a genetic predisposition, annual screening mammography is recommended to begin 10 years earlier than the age that an affected relative had been diagnosed, but not before age 30. Annual screening by magnetic resonance imaging is recommended in high-risk women as an adjunct to mammography.59
 
Future directions for Hong Kong
We believe that health care in Hong Kong should have the capability and expertise to roll out quality, large-scale population-screening programmes that are comparable to those in other developed Asian countries and cities. When we examine the common themes among available guidelines, literature, and expert reviews worldwide, the global trend is to provide women with an informed choice.
 
In the discussion of whether breast-cancer screening is feasible, one should bear in mind that this is an emotive issue. Apart from the critical appraisal of scientific evidence, the interpretation of literature and subsequent formulation of recommendations should always account for the socioeconomic, historical, and contextual realities. The value judgement of women should also be respected.
 
Frontline experts, including breast surgeons, oncologists, breast radiologists, and their representative professional associations should all participate in guideline panels, with a will to end the ‘mammography wars’. Our Holy Grail should always be focused on improving cancer detection, reducing mortality, and improving patient outcome.
 
References
1. Eby PR. Evidence to support screening women annually. Radiol Clin North Am 2017;55:441-56.
2. Society of Breast Imaging Breast Screening Leadership Group. Screening in the 40-49 Age Group. Available from: https://www.sbi-online.org/RESOURCES/BreastScreeningLeadershipGroupResources.aspx. Accessed 19 Nov 2017.
3. Ray KM, Price ER, Joe BN. Evidence to support screening women in their 40s. Radiol Clin North Am 2017;55:429-39.
4. The American College of Radiology. Guidelines for Breast Cancer Screening—An Update. SBI Breast Imaging Symposium 2016. Available from: https://www.sbi-online.org/Portals/0/Breast%20Imaging%20Symposium%202016/Final%20Presentations/4-7%20800am%20Smith%20-%20Guidelines%20for%20Breast%20Cancer%20Screening.pdf. Accessed 19 Nov 2017.
5. Shieh Y, Eklund M, Sawaya GF, et al. Population-based screening for cancer: hope and hype. Nat Rev Clin Oncol 2016;13:550-65. Crossref
6. Byrne SK. What's the Buzz: Tell me what’s happening in breast cancer screening. Asia Pac J Oncol Nurs 2017;4:122-6. Crossref
7. Freer P, Moy L, DeMartini W; the Screening Leadership Group. Breast Cancer Screening: Understanding the Randomised Controlled Trials. Available from: https://www.sbi-online.org/Portals/0/Screening%20Leaders/Breast%20Cancer%20Screening_Understanding%20the%20Randomized%20Controlled%20Trials.pdf. Accessed 19 Nov 2017.
8. Duffy SW, Chen TH, Smith RA, Yen AM, Tabar L. Real and artificial controversies in breast cancer screening. Breast Cancer Manage 2013;2:519-28. Crossref
9. Newell M, Eby PR; the Breast Screening Leadership Group. Benefits of Screening Mammography: Data from Population Service Screening. Available from: https://www.sbi-online.org/Portals/0/Screening Leaders/Benefitsof Screening Mammography_Data from PopulationService Screening.pdf. Accessed 19 Nov 2017.
10. Miller AB, Baines CJ, To T, et al. Canadian National Breast Screening Study: 2. Breast cancer detection and death rates among women aged 50 to 59 years. CMAJ 1992;147:1477-88.
11. Miller AB, Baines CJ, To T, et al. Canadian National Breast Screening Study: 1. Breast cancer detection and death rates among women aged 40 to 49 years. CMAJ 1992;147:1459-76.
12. Miller AB, To T, Baines CJ, et al. Canadian National Breast Screening Study-2: 13-year results of a randomized trial in women aged 50-59 years. J Natl Cancer Inst 2000;92:1490-9. Crossref
13. Miller AB, To T, Baines CJ, et al. The Canadian National Breast Screening Study-1: breast cancer mortality after 11 to 16 years of follow-up. A randomized screening trial of mammography in women age 40 to 49 years. Ann Intern Med 2002;137:305-12. Crossref
14. Miller AB, Wall C, Baines CJ, et al. Twenty five year follow-up for breast cancer incidence and mortality of the Canadian National Breast Screening Study: randomised screening trial. BMJ 2014;348:g366. Crossref
15. Kopans DB, Feig SA. The Canadian National Breast Screening Study: a critical review. AJR Am J Roentgenol 1993;161:755-60. Crossref
16. Burhenne LJ, Burhenne HJ. The Canadian National Breast Screening Study: a Canadian critique. AJR Am J Roentgenol 1993;161:761-3. Crossref
17. Kopans D. Breast Imaging. 3rd ed. Lippincott Williams & Wilkins: Philadelphia; 2007.
18. Heywang-Köbrunner SH, Schreer I, Hacker A, et al. Conclusions for mammography screening after 25-year follow-up of the Canadian National Breast Cancer Screening Study (CNBSS). Eur Radiol 2016;26:342-50. Crossref
19. Boyd NF. The review of randomization in the Canadian National Breast Screening Study. Is the debate over? CMAJ 1997;156:207-9.
20. Baines CJ, Miller AB, Kopans DB, et al. Canadian National Breast Screening Study: assessment of technical quality by external review. AJR Am J Roentgenol 1990;155:743-7; discussion 8-9. Crossref
21. International Agency for Cancer on Research (IARC), World Health Organization. IARC Handbooks of Cancer Prevention. Volume 7: Breast Cancer Screening. IARC Press; 2002. Available from: http://www.iarc.fr/en/publications/pdfs-online/prev/handbook7/Handbook7_Breast-4.pdf. Accessed 15 Mar 2018.
22. Gotzsche PC, Olsen O. Is screening for breast cancer with mammography justifiable? Lancet 2000;355:129-34. Crossref
23. Tabár L, Dean PB, Cen TH, et al. The impact of mammography screening on the diagnosis and management of early-phase breast cancer. In: Francescatti D, Silverstein M, editors. Breast Cancer: A New Era in Management. Springer New York; 2014: 31-78. Crossref
24. Bock K, Borisch B, Cawson J, et al. Effect of population-based screening on breast cancer mortality. Lancet 2011;378:1775-6. Crossref
25. Patnick J, Perry N, de Wolf C. Effect of population-based screening on breast cancer mortality—Authors’ reply. Lancet 2012;379:1298.
26. Mcneil DG. Confronting cancer: scientist at work—Peter Gotzsche; A career that bristles with against-the-grain conclusions. Available from: http://www.nytimes.com/2002/04/09/science/confronting-cancer-scientist-work-peter-gotzsche-career-that-bristles-with.html. Accessed 19 Nov 2017.
27. Cuzick J. Breast cancer screening—time to move forward. Lancet 2012;379:1289-90. Crossref
28. Chiolero A, Rodondi N. Lessons from the Swiss Medical Board recommendation against mammography screening programs. JAMA Intern Med 2014;174:1541-2. Crossref
29. Biller-Andorno N, Juni P. Abolishing mammography screening programs? A view from the Swiss Medical Board. N Engl J Med 2014;370:1965-7. Crossref
30. Helvie MA, Chang JT, Hendrick RE, et al. Reduction in late-stage breast cancer incidence in the mammography era: Implications for overdiagnosis of invasive cancer. Cancer 2014;120:2649-56. Crossref
31. Kopans DB, Smith RA, Duffy SW. Mammographic screening and “overdiagnosis”. Radiology 2011;260:616-20. Crossref
32. Puliti D, Duffy SW, Miccinesi G, et al. Overdiagnosis in mammographic screening for breast cancer in Europe: a literature review. J Med Screen 2012;19 Suppl 1:42-56. Crossref
33. Duffy SW, Agbaje O, Tabar L, et al. Overdiagnosis and overtreatment of breast cancer: estimates of overdiagnosis from two trials of mammographic screening for breast cancer. Breast Cancer Res 2005;7:258-65. Crossref
34. Bleyer A, Welch HG. Effect of three decades of screening mammography on breast-cancer incidence. N Engl J Med 2012;367:1998-2005. Crossref
35. Duffy SW, Dibden A, Michalopoulos D, et al. Screen detection of ductal carcinoma in situ and subsequent incidence of invasive interval breast cancers: a retrospective population-based study. Lancet Oncol 2016;17:109-14. Crossref
36. Tosteson AN, Fryback DG, Hammond CS, et al. Consequences of false-positive screening mammograms. JAMA Intern Med 2014;174:954-61. Crossref
37. Schwartz LM, Woloshin S, Fowler FJ, Jr, et al. Enthusiasm for cancer screening in the United States. JAMA 2004;291:71-8. Crossref
38. Kopans DB. An open letter to panels that are deciding guidelines for breast cancer screening. Breast Cancer Res Treat 2015;151:19-25. Crossref
39. Duffy SW, Chen TH, Smith RA, Yen AM, Tabar L. Real and artificial controversies in breast cancer screening. Breast Cancer Manage 2013;2:519-28. Crossref
40. Montero AJ, Eapen S, Gorin B, et al. The economic burden of metastatic breast cancer: a U.S. managed care perspective. Breast Cancer Res Treat 2012;134:815-22. Crossref
41. Ohuchi N, Ishida T, Kawai M, et al. Randomized controlled trial on effectiveness of ultrasonography screening for breast cancer in women aged 40-49 (J-START): research design. Jpn J Clin Oncol 2011;41:275-7. Crossref
42. Sung H, Rosenberg PS, Chen WQ, et al. Female breast cancer incidence among Asian and Western populations: more similar than expected. J Natl Cancer Inst 2015;107. Crossref
43. Fan L, Strasser-Weippl K, Li JJ, et al. Breast cancer in China. Lancet Oncol 2014;15:e279-89. Crossref
44. Youlden DR, Cramb SM, Yip CH, et al. Incidence and mortality of female breast cancer in the Asia-Pacific region. Cancer Biol Med 2014;11:101-15.
45. Singapore Health Promotion Board. National Registry of Diseases Office. Singapore Cancer Registry Interim Annual Report: Trends in cancer incidence in Singapore 2010-2014. Available from: https://www.nrdo.gov.sg/docs/librariesprovider3/default-document-library/cancer-trends-2010-2014_interim-annual-report_final-%28public%29.pdf?sfvrsn=0. Accessed 19 Nov 2017.
46. Hospital Authority, Hong Kong. Hong Kong Cancer Registry. Available from: http://www3.ha.org.hk/cancereg/. Accessed 19 Mar 2018.
47. Leung GM, Thach TQ, Lam TH, et al. Trends in breast cancer incidence in Hong Kong between 1973 and 1999: an age-period-cohort analysis. Br J Cancer 2002;87:982-8. Crossref
48. Breast cancer in Asia—The Challenge and Response. A Report from the Economist Intelligence Unit. Available from: https://www.eiuperspectives.economist.com/sites/default/files/EIU Breast Cancer in Asia_Final.pdf. Accessed 19 Nov 2017.
49. Yen AM, Tsau HS, Fann JC, et al. Population-based breast cancer screening with risk-based and universal mammography screening compared with clinical breast examination: a propensity score analysis of 1 429 890 Taiwanese women. JAMA Oncol 2016;2:915-21. Crossref
50. Song QK, Wang XL, Zhou XN, et al. Breast cancer challenges and screening in China: lessons from current registry data and population screening studies. Oncologist 2015;20:773-9. Crossref
51. A Hong Kong Breast Cancer Foundation Initiative. Hong Kong Breast Cancer Registry Report No. 8, 2016. Available from: http://www.hkbcf.org/download/bcr_report8/hkbcf_report_2016_full_report.pdf. Accessed 19 Nov 2017.
52. Lui CY, Lam HS, Chan LK, et al. Opportunistic breast cancer screening in Hong Kong; a revisit of the Kwong Wah Hospital experience. Hong Kong Med J 2007;13:106-13.
53. Hong Kong College of Radiologists Mammography Statement. Available from: https://www.hkcr.org/templates/OS03C00336/case/lop/HKCR MammographyStatement_rev20150825.pdf. Accessed 19 Nov 2017.
54. Destounis SV, Arieno AL, Morgan RC, et al. Comparison of breast cancers diagnosed in screening patients in their 40s with and without family history of breast cancer in a community outpatient facility. AJR Am J Roentgenol 2014;202:928-32. Crossref
55. Rafferty EA, Rose SL, Miller DP, et al. Effect of age on breast cancer screening using tomosynthesis in combination with digital mammography. Breast Cancer Res Treat 2017;164:659-66. Crossref
56. Friedewald SM, Rafferty EA, Rose SL, et al. Breast cancer screening using tomosynthesis in combination with digital mammography. JAMA 2014;311:2499-507. Crossref
57. Yun SJ, Ryu CW, Rhee SJ, et al. Benefit of adding digital breast tomosynthesis to digital mammography for breast cancer screening focused on cancer characteristics: a meta-analysis. Breast Cancer Res Treat 2017;164:557-69. Crossref
58. Monticciolo DL, Newell MS, Hendrick RE, et al. Breast cancer screening for average-risk women: recommendations from the ACR commission on breast imaging. J Am Coll Radiol 2017;14:1137-43. Crossref
59. Expert Panel on Breast Imaging; Mainiero MB, Moy L, Baron P, et al. ACR Appropriateness Criteria Breast Cancer Screening. J Am Coll Radiol 2017;14:S383-90. Crossref

Ageing in individuals with intellectual disability: issues and concerns in Hong Kong

Hong Kong Med J 2018 Feb;24(1):68–72 | Epub 12 Jan 2018
DOI: 10.12809/hkmj166302
© Hong Kong Academy of Medicine. CC BY-NC-ND 4.0
 
REVIEW ARTICLE
Ageing in individuals with intellectual disability: issues and concerns in Hong Kong
Mimi MY Tse, PhD; Rick YC Kwan, PhD; Joyce L Lau, MSc
School of Nursing, The Hong Kong Polytechnic University, Hung Hom, Hong Kong
 
Corresponding author: Dr Mimi MY Tse (mimi.tse@polyu.edu.hk)
 
 Full paper in PDF
 
Abstract
Introduction: The increasing longevity of people with intellectual disability is testimony to the positive developments occurring in medical intervention. Nonetheless, early-onset age-related issues and concerns cause deterioration of their overall well-being. This paper aimed to explore the issues and concerns about individuals with intellectual disability as they age.
 
Methods: Articles that discussed people older than 30 years with an intellectual disability and those that identified ageing health issues and concerns were included. Only studies reported in English from 1996 to 2016 were included. We searched PubMed, Google Scholar, and Science Direct using the terms ‘intellectual disability’, ‘ageing’, ‘cognitive impairment’, ‘health’, and ‘screening’.
 
Results: Apart from the early onset of age-related health problems, dementia is more likely to develop by the age of 40 years in individuals with intellectual disability. Geriatric services to people with intellectual disability, however, are only available for those aged 60 years and older. Cognitive instruments used for the general population are not suitable for people with intellectual disability because of floor effects. In Hong Kong, the Chinese version of the Dementia Screening Questionnaire for Individuals with Intellectual Disabilities is the only validated instrument for people with intellectual disability. The use of appropriate measurement tools to monitor the progression of age-related conditions in individuals with intellectual disability is of great value.
 
Conclusions: Longitudinal assessment of cognition and function in people with intellectual disability is vital to enable early detection of significant deterioration. This allows for therapeutic intervention before substantial damage to the brain occurs such as dementia that hastens cognitive and functional decline.


Introduction
Over the past half-century, the life expectancy of individuals with intellectual disability (ID) has increased. Intellectual disability is defined as a disorder with onset before the age of 18 years that includes both intellectual and adaptive functioning deficits in conceptual, social, and practical domains.1 The deficits prevent an individual from performing activities of daily living independently. Therefore, ID places a great burden not only on the individual but also on the caregiver and health care services.2 International studies report that 4.94 per 1000 adults globally have an ID.3 In Hong Kong, it is estimated that there are about 67 000 to 80 000 people with ID.4
 
An increased life expectancy may be accompanied by negative health outcomes such as obesity, osteoporosis, and cataract in people with ID and results in an early onset of age-related health conditions.5 6 Indeed, the incidence of these health conditions is rising and is higher than in non-ID individuals.7 In addition, by the age of 40 years, people with ID are more likely to develop dementia, as their cognition declines faster compared with their non-ID counterparts.8 9
 
Alzheimer’s disease (AD) is the most common form of dementia with symptoms that are severe enough to cause serious health deterioration. Affected individuals become increasingly dependent on caregivers and have an increased likelihood of institutionalisation.6 10 It is reported that AD has a strong association with Down’s syndrome (DS),6 which is the most commonly known genetic cause of ID, diagnosed in approximately 14 of 10 000 live births.11 It is associated with characteristic physical features, deficits in the immune and endocrine systems, and delayed cognitive development.
 
The prevalence of AD in DS varies between studies.12 Wiseman et al13 reported that approximately 5% to 15% of people with DS aged 40 to 49 years and more than 30% of those aged 50 to 59 years experience a significant decline in their cognition, indicating dementia. McCarron et al14 reported that 68% to 80% of people with DS have developed dementia by the age of 65 years.
 
The increasing longevity of people with ID is testimony to positive developments in medical intervention. Early-onset ageing issues and concerns, however, may further deteriorate overall well-being. To date, no study has examined the effects of ageing in people with ID in Hong Kong. This paper explored the issues and concerns surrounding people with ID as they age.
 
Methods
A search of the literature was conducted to identify the issues and concerns faced by individuals with ID. All articles about individuals older than 30 years with an ID, and those that identified ageing health issues and concerns were included. The search was restricted to articles published in English between 1996 and 2016. Databases of PubMed, Google Scholar, and Science Direct were searched. Keywords used were ‘intellectual disability’, ‘ageing’, ‘cognitive impairment’, ‘health’, and ‘screening’.
 
Results
Three major issues emerged: insufficient services and accommodation, cognitive screening, and lack of intervention to delay cognitive and health deterioration in individuals with ID.
 
Insufficient services and accommodation
As individuals with ID live longer, their demand for residential services has increased.15 This growing demand has led to longer waiting times and an increased burden on caregivers.16
 
Pang’s survey7 determined that there are insufficient government services and accommodation for individuals with ID in Hong Kong. Of 2159 eligible participants, only 1865 were catered for. Discrepancies in the prevalence reports by the government and non-governmental organisations (NGOs) in the field have also been reported. Government statistics have reported 67 000 to 80 000 individuals with ID in Hong Kong, but NGOs place this figure at 100 000. This huge difference suggests that a significant proportion of affected individuals are not receiving support services from the government.7
 
Moreover, geriatric services to individuals with ID are only available from the age of 60 years. Since individuals with ID face ageing at an earlier age, there is clearly insufficient access to health services and health promotion activities for this population. This further contributes to the rapid decline of their health, especially cognition.17
 
Cognitive screening of individuals with intellectual disability
Diagnosing the presence of significant cognitive deterioration such as dementia among individuals with ID is a challenge. This is because their level of cognition is already below-average.18 19 Non-standardised screening instruments, risk factors, and lack of diagnostic criteria add to the difficulty of diagnosing dementia among individuals with ID.
 
Non-standardised screening instrument
Cognitive screening tools such as the Mini-Mental State Examination that is used in the general population are unsuitable for individuals with ID because of floor effects and the absence of standard cut-off thresholds.20 This may result in underdiagnosis of dementia cases.21 22 In addition, late symptoms of dementia that are present in the general population are experienced by individuals with ID at an early stage. When the diagnosis is made, people with ID are already at the late stage of dementia.
 
Similar to previous studies, screening of cognitive level of individuals with ID in Hong Kong is lacking.18 19 23 A recent study developed and validated the first cognitive assessment instrument for the Chinese population—the Chinese version of the Dementia Screening Questionnaire for Individuals with Intellectual Disabilities (DSQIID).18 Approximately 200 individuals with ID (mean age, 51 years) joined the study. The results showed good internal consistency for all 53 items, and excellent test-retest reliability and inter-rater reliability. Individuals who scored ≥22 were likely to have a positive diagnosis of dementia. Those who scored <22 were considered to have cognitive and functional decline but of insufficient severity to be classified as dementia. The decline could be aged-related or due to other causes such as environmental factors. It is nevertheless important to remember that DSQIID is a screening instrument and not diagnostic.18
 
Risk factors for dementia in individuals with intellectual disability
Sex
Sex has a strong correlation with the development of dementia in individuals with ID. It has been reported that women are more likely to develop dementia than men. This is because of the suboptimal level of oestrogen in women.24 Patel et al25 reported that an increased level of bioavailable oestradiol can reduce the risk of dementia and also result in better neuropsychological function. On the contrary, Farrer et al26 and Schupf et al27 found that women were at decreased risk of dementia. This contradictory result might have been due to different age ranges of the study participants.
 
Oxidative damage
In individuals with DS, the enzyme superoxide dismutase is present with increased activity. This enzyme plays a role in the free-radical–mediated damage that occurs when there is an imbalance between free radical production and cellular antioxidant defences. In addition, inflammatory factors such as S100B overexpression increase the risk of having dementia. A combination of these two factors can accelerate the progression to dementia in individuals with DS aged 40 years and older.24
 
Genetic predisposition
Given that there are a variety of conditions that can cause cognitive and behavioural changes in individuals with DS, especially as they age, it would be of great value to identify the genetic factors involved in differential diagnoses.28 Apolipoprotein E (APOE) ε4 allele, and high levels of Aβ1-42 peptide have been reported to be associated with the onset of dementia in DS.29 Mok et al30 suggested that there are three variants in BACE2 that possibly affect the age of onset of dementia in DS, while Jones et al31 reported the involvement of PICALM and APOE loci in the process.
 
Nonetheless, some studies have found that the APOE ε2 allele decreases the risk of dementia in individuals with ID, although the sample sizes might have been too small to demonstrate a significant effect.32 33 34
 
Telomere shortening
Apart from the above-mentioned genes, Jenkins et al28 reported that the telomeres of chromosomes 21, 1, 2, and 16 are shorter in adults with DS and with either dementia or cognitive impairment compared with the general population. This finding suggests that telomere shortening can be used as a biomarker for inferring dementia.
 
High cholesterol level
A number of studies suggest a relationship between high serum cholesterol and increased risk of AD in individuals with ID.35 36 37 High cholesterol level increases the neural beta-amyloid load and the numbers of neuritic plaques and tangles that are characteristic of AD.38 39 Both factors are known to be elevated in people with ID. Zigman et al37 found that use of statin to lower cholesterol level decreased the risk of AD. Patel et al25 reported that high body mass index significantly decreased the risk of AD. This is because high body mass index is related to increased bioavailability of oestradiol and better neuropsychological function.
 
Lack of diagnostic criteria to diagnose dementia in individuals with intellectual disability
Nieuwenhuis-Mark40 has recommended measures to identify cognitive decline in people with ID such as clinical interviews, standard laboratory tests, neuroimaging, and cognitive testing. Nonetheless these are only guidelines. To date, no clear diagnostic criteria and assessment have been defined. This also explains the variation in the dementia prevalence from the published literature and further adds to the difficulty in identifying the presence of dementia.
 
Lack of intervention to delay cognitive and health deterioration in individuals with intellectual disability
Pang’s survey7 found that 6.5% of those with ID had more than three co-morbid disabilities and 7.3% had more than three chronic medical conditions such as hypertension and cataract. Of those surveyed, 19.9% were admitted to an advanced sheltered home. The findings of the survey showed that people with ID experienced age-related health problems at an earlier age.
 
Heller et al’s review41 summarised the effectiveness of health promotion interventions in people with ID without dementia and normal ageing adults. Despite searching 20 years of literature, only 25 ID studies were identified compared with 153 studies of ageing. The most common intervention that had a positive effect in individuals with ID was exercise. The review showed that there is limited research in the field of ageing adults with ID. It also concluded that individuals with ID are not included in the majority of health programmes for the ageing population.
 
Multicomponent interventions in normal ageing adults have demonstrated good physical, health, and psychosocial outcomes. There has been only one study in individuals with ID and dementia. After the 3-year study intervention, there was some improvement in cognition, stabilisation, and behaviour in the experimental group compared with the control group.42
 
Discussion
The early onset of age-related health conditions in individuals with ID, especially dementia, will hasten functional and cognitive deterioration. This will also shorten years of independent living and increase the demand for health services. Current available health services are lacking. How and what health services will be provided in the future as individuals with ID age remains unknown.43
 
In this study, different risk factors were correlated with the development of dementia in people with ID, although some evidence was equivocal. Some study findings were contradictory, possibly due to different sample sizes and ages of participants.24 In future, validated risk factors may help with early diagnosis and institution of treatment at the most effective time.24
 
Longitudinal assessment of cognition and function in individuals with ID is important to enable early detection of significant deterioration. Such assessment may also provide data for future studies of which symptoms suggest the presence of dementia. Baseline data must be obtained at a time when an individual is healthy. Strydom et al44 recommended that a baseline cognitive level be established before the age of 35 years and be reviewed annually. The use of appropriate measurement tools to monitor the progression of age-related symptoms in people with ID is valuable. Li et al’s study20 resulted in the development and validation of an instrument with good psychometric properties for screening cognitive changes in a Chinese population with ID.
 
Early detection allows for therapeutic intervention before any substantial damage to cognition occurs, such as dementia. The delay in receiving appropriate care and identifying the presence of significant cognitive and functional deficits can result in diagnosis of dementia at an already advanced stage.41 This delay can further complicate management. Future studies to examine the feasibility and efficacy of interventions are recommended in individuals with ID.
 
Declaration
The authors have disclosed no conflicts of interest.
 
References
1. American Association on Intellectual and Developmental Disabilities. Definition of intellectual disability. 2013. Available from: http://aaidd.org/intellectual-disability/definition#.WJsHrzt97b0. Accessed 27 Feb 2017.
2. Diagnostic and Statistical Manual of Mental Disorders: DSM-IV-TR. Washington, DC: American Psychiatric Association; 2000.
3. Maulik PK, Mascarenhas MN, Mathers CD, Dua T, Saxena S. Prevalence of intellectual disability: a meta-analysis of population-based studies. Res Dev Disabil 2011;32:419-36. Crossref
4. Census and Statistics Department, Hong Kong SAR Government. Persons with disabilities and chronic diseases in Hong Kong 2015. Available from: http://www.statistics.gov.hk/pub/B71501FB2015XXXXB0100.pdf. Accessed 27 Feb 2017.
5. Krinsky-McHale SJ, Silverman W. Dementia and mild cognitive impairment in adults with intellectual disability: issues of diagnosis. Dev Disabil Res Rev 2013;18:31-42. Crossref
6. Sheehan R, Ali A, Hassiotis A. Dementia in intellectual disability. Curr Opin Psychiatry 2014;27:143-8. Crossref
7. Pang M. Survey study on ageing trend of persons with intellectual disabilities 2015 [in Chinese]. Available from: http://www.lwb.gov.hk/eng/other_info/Report%20of%20 the%20Survey%20Study%20on%20Ageing%20Trend%20 of%20PwIDs_c.pdf. Accessed 27 Feb 2017.
8. Burt DB, Primeaux-Hart S, Loveland KA, et al. Aging in adults with intellectual disabilities. Am J Ment Retard 2005;110:268-84. Crossref
9. De Vreese LP, Gomiero T, Uberti M, et al. Functional abilities and cognitive decline in adult and aging intellectual disabilities. Psychometric validation of an Italian version of the Alzheimer’s Functional Assessment Tool (AFAST): analysis of its clinical significance with linear statistics and artificial neural networks. J Intellect Disabil Res 2015;59:370-84. Crossref
10. Corbett A, Husebo BS, Achterberg WP, Aarsland D, Erdal A, Flo E. The importance of pain management in older people with dementia. Br Med Bull 2014;111:139-48. Crossref
11. Parker SE, Mai CT, Canfield MA, et al. Updated national birth prevalence estimates for selected birth defects in the United States, 2004-2006. Birth Defects Res A Clin Mol Teratol 2010;88:1008-16. Crossref
12. Strydom A, Shooshtari S, Lee L, et al. Dementia in older adults with intellectual disabilities—epidemiology, presentation, and diagnosis. J Policy Pract Intellect Disabil 2010;7:96-110. Crossref
13. Wiseman FK, Al-Janabi T, Hardy J, et al. A genetic cause of Alzheimer disease: mechanistic insights from Down syndrome. Nat Rev Neurosci 2015;16:564-74. Crossref
14. McCarron M, McCallion P, Reilly E, Mulryan N. A prospective 14-year longitudinal follow-up of dementia in persons with Down syndrome. J Intellect Disabil Res 2014;58:61-70. Crossref
15. Lakin KC, Prouty R, Polister B, Coucouvants K. Change in residential placements for persons with intellectual and developmental disabilities in the USA in the last two decades. J Intellect Dev Disabil 2003;28:205-10. Crossref
16. Jokinen NS, Janicki MP, Hogan M, Force LT. The middle years and beyond: transitions and families of adults with Down syndrome. J Dev Disabil 2012;18:59-69.
17. Community support and service needs for old people with disabilities. Research Report July 2016. Available from: https://www.legco.gov.hk/yr16-17/chinese/panels/ws/ papers/wscb2-143-1-c.pdf. Accessed 23 Jan 2017.
18. Deb S, Hare M, Prior L, Bhaumik S. Dementia screening questionnaire for individuals with intellectual disabilities. Br J Psychiatry 2007;190:440-4. Crossref
19. Zeilinger EL, Nader IW, Brehmer-Rinderer B, Koller I, Weber G. CAPs-IDD: Characteristics of assessment instruments for psychiatric disorders in persons with intellectual developmental disorders. J Intellect Disabil Res 2013;57:737-46. Crossref
20. Li RS, Kwok HW, Deb S, Chui EM, Chan LK, Leung DP. Validation of the Chinese version of the dementia screening questionnaire for individuals with intellectual disabilities (DSQIID-CV). J Intellect Disabil Res 2015;59:385-95. Crossref
21. Chaplin E, Paschos D, O’Hara J, et al. Mental ill-health and care pathways in adults with intellectual disability across different residential types. Res Dev Disabil 2010;31:458-63. Crossref
22. Perry J, Linehan C, Kerr M, et al. The P15—A multinational assessment battery for collecting data on health indicators relevant to adults with intellectual disabilities. J Intellect Disabil Res 2010;54:981-91. Crossref
23. Devenny DA, Krinsky-McHale SJ, Sersen G, Silverman WP. Sequence of cognitive decline in dementia in adults with Down’s syndrome. J Intellect Disabil Res 2000;44(Pt 6):654-65.
24. Bush A, Beail N. Risk factors for dementia in people with Down syndrome: issues in assessment and diagnosis. Am J Ment Retard 2004;10:83-97. Crossref
25. Patel BN, Pang D, Stern Y, et al. Obesity enhances verbal memory in postmenopausal women with Down syndrome. Neurobiol Aging 2004;25:159-66. Crossref
26. Farrer MJ, Crayton L, Davies GE, et al. Allelic variability in D21S11, but not in APP or APOE, is associated with cognitive decline in Down syndrome. Neuroreport 1997;8:1645-9. Crossref
27. Schupf N, Kapell D, Nightingale B, Rodriguez A, Tycko B, Mayeux R. Earlier onset of Alzheimer’s disease in men with Down syndrome. Neurology 1998;50:991-5. Crossref
28. Jenkins EC, Velinov MT, Ye L, et al. Telomere shortening in T lymphocytes of older individuals with Down syndrome and dementia. Neurobiol Aging 2006;27:941-5. Crossref
29. Schupf N, Sergievsky GH. Genetic and host factors for dementia in Down’s syndrome. Br J Psychiatry 2002;180:405-10. Crossref
30. Mok KY, Jones EL, Hanney M, et al. Polymorphisms in BACE2 may affect the age of onset Alzheimer’s dementia in Down syndrome. Neurobiol Aging 2014;35:1513.e1-5.
31. Jones EL, Mok K, Hanney M, et al. Evidence that PICALM affects age at onset of Alzheimer’s dementia in Down syndrome. Neurobiol Aging 2013;34:2441.e1-5. Crossref
32. Hardy J, Crook R, Perry R, Raghavan R, Roberts G. ApoE genotype and Down’s syndrome. Lancet 1994;343:979-80. Crossref
33. Royston MC, Mann D, Pickering-Brown S, et al. Apolipoprotein E epilson 2 allele promotes longevity and protects patients with Down’s syndrome from dementia. Neuroreport 1994;5:2583-5. Crossref
34. Wisniewski T, Morelli L, Wegiel J, Levy E, Wisniewski HM, Frangione B. The influence of apolipoprotein E isotypes on Alzheimer’s disease pathology in 40 cases of Down’s syndrome. Ann Neurol 1995;37:136-8. Crossref
35. Kuo YM, Emmerling MR, Bisgaier CL, et al. Elevated low-density lipoprotein in Alzheimer’s disease correlates with brain abeta 1-42 levels. Biochem Biophys Res Commun 1998;252:711-5. Crossref
36. Launer LJ, White LR, Petrovitch H, Ross GW, Curb JD. Cholesterol and neuropathologic markers of AD: a population-based autopsy study. Neurology 2001;57:1447-52. Crossref
37. Zigman WB, Schupf N, Jenkins EC, Urv TK, Tycko B, Silverman W. Cholesterol level, statin use and Alzheimer’s disease in adults with Down syndrome. Neurosci Lett 2007;416:279-84. Crossref
38. Puglielli L, Tanzi RE, Kovacs DM. Alzheimer’s disease: the cholesterol connection. Nat Neurosci 2003;6:345-51. Crossref
39. Wolozin B. Cholesterol and the biology of Alzheimer’s disease. Neuron 2004;41:7-10. Crossref
40. Nieuwenhuis-Mark RE. Diagnosing Alzheimer’s dementia in Down syndrome: problems and possible solutions. Res Dev Disabil 2009;30:827-38. Crossref
41. Heller T, Fisher D, Marks B, Hsieh K. Interventions to promote health: crossing networks of intellectual and developmental disabilities and aging. Disabil Health J 2014;7(1 Suppl):S24-32. Crossref
42. De Vreese LP, Mantesso U, De Bastiani E, Weger E, Marangoni AC, Gomiero T. Impact of dementia-derived nonpharmacological intervention procedures on cognition and behavior in older adults with intellectual disabilities: a 3-year follow-up study. J Policy Pract Intellect Disabil 2012;9:92-102. Crossref
43. Innes A, McCabe L, Watchman K. Caring for older people with an intellectual disability: a systematic review. Maturitas 2012;72:286-95. Crossref
44. Strydom A, Hassiotis A, King M, Livingston G. The relationship of dementia prevalence in older adults with intellectual disability (ID) to age and severity of ID. Psychol Med 2009;39:13-21. Crossref

End-of-life services for older people in residential care homes in Hong Kong

Hong Kong Med J 2018 Feb;24(1):63–7 | Epub 4 Aug 2017
DOI: 10.12809/hkmj166807
© Hong Kong Academy of Medicine. CC BY-NC-ND 4.0
 
REVIEW ARTICLE
End-of-life services for older people in residential care homes in Hong Kong
James KH Luk, FHKCP, FHKAM (Medicine)
Department of Medicine and Geriatrics, Fung Yiu King Hospital, Pokfulam, Hong Kong
 
Corresponding author: Dr James KH Luk (lukkh@ha.org.hk)
 
 Full paper in PDF
 
Abstract
Good end-of-life care is needed for older people living in residential care homes with advanced irreversible chronic medical illnesses and cancers. At present, the usual practice of residential care homes is to send older residents to acute care hospitals when they are unwell, and some residents will die in hospital. Dying in hospital without choice for older people may not be in alignment with the principle of ‘good death’. There are many barriers for older people to die in the place of their choice, particularly in a residential care home. In the community, to enhance end-of-life care for elderly people living in residential care homes, pilot end-of-life programmes have been organised by community geriatric assessment teams. In 2015, the Hong Kong Hospital Authority started the ‘Enhance community geriatric assessment team support to end-of-life patients in residential care homes for the elderly’ programme in four clusters. In the hospital setting, an end-of-life clinical plan and end-of-life ward in geriatric step-down hospitals may improve the quality of death of elderly people. In September 2015, the Hospital Authority guideline on life-sustaining treatment for terminally ill people was updated. Among other key end-of-life issues, careful (comfort) hand feeding was first mentioned in the guideline. The possible establishment of enduring powers of attorney for health care decision-making and enhancement of careful (comfort) hand feeding are new developments in the coming years.


Introduction
The population of Hong Kong is ageing rapidly.1 Approximately 8.5% of those aged 65 years and above live in a residential care home for the elderly (RCHE) in Hong Kong.2 Older RCHE residents are characterised by multiple co-morbidities, with many advanced irreversible chronic medical illnesses (advanced dementia, chronic lung or heart diseases, end-stage renal failure, and Parkinson’s disease, to name but a few). They may also have cancers that require palliative rather than curative treatment. Many have poor mobility, high dependency, and poor cognitive function.3 It is increasingly realised that, similar to cancer patients, good end-of-life (EOL) care is important in the management of patients with irreversible chronic illnesses.4 Indeed, high mortality has been reported in RCHE residents with advanced dementia, with a 1-year mortality rate of 34%.5 As the EOL stage approaches, patients with advanced irreversible chronic medical illnesses may experience distressing symptoms similar to patients dying of more commonly recognised terminal conditions.6 7 8 Therefore, it is advocated that EOL care should be provided for this vulnerable group.9
 
Previous literature has laid down the concept of a ‘good death’, which includes being able to know when death is approaching; retaining control of what happens; having dignity, privacy, and pain and symptom control; having choice and control over where death occurs (at home or elsewhere), access to information and expertise, access to spiritual or emotional support, access to hospice care in any location, and control over who is present; having the ability to issue advance directives; having time to say goodbye; and leaving when it is time to go instead of having life prolonged pointlessly.10 Unfortunately, most, if not all, elderly patients living in RCHEs with advanced irreversible chronic medical illnesses die in public hospitals.11 Acute medical and surgical wards in public hospitals are intended for acute curative management of ill patients. They are not generally well-designed for dying with dignity and privacy. Elderly patients will die in an unfamiliar environment with restricted visiting hours. Ward staff are busy and most have not been trained to provide counselling and spiritual care to dying patients and family members. A single room with privacy for a dying patient is unavailable in most public hospitals, except in some palliative care units. The dying experience for RCHE residents with advanced irreversible chronic medical illnesses is still far from a ‘good death’ in Hong Kong.12
 
Can we have an alternative in the place of dying?
‘Dying in place’ is one of the elements of a good death.13 Dying in place usually means dying at home or in an RCHE, as opposed to a hospital.14 If an elderly person dies at home, there is no need to inform the Coroner. A registered practitioner can fill in a Medical Certificate of the Cause of Death (Form 18) of the Births and Deaths Registration Ordinance (Chapter 174). The form is available from the offices of the Registrar of Births and Deaths.15 The practitioner must have attended the patient within 14 days immediately prior to the patient’s death. Using Form 18, the deceased’s family has to register a death within 24 hours at the Births and Deaths General Register Office. After death registration, a Certificate of Registration of Death (Form 12) will be issued. According to Section 16 of the Births and Deaths Registration Ordinance, no person shall remove a dead body, unless they have obtained either Form 12 or, in urgent cases, a permit from the nearest police station.16 The problems for dying in place in Hong Kong include social taboo, lack of death education, fear of depreciation of property value if a person died at home, and inadequate medical support to take care of dying persons at home.17 18
 
For an RCHE, the Coroner Ordinance (Section 4, Coroner Ordinance, CAP 504) demands all deaths in RCHEs (except nursing homes) be reported to the Coroner.19 Because of the above ordinance, RCHEs are disinclined to allow an older resident to die in their premises. When they see a patient’s health is deteriorating, they will call an ambulance to take the patient to the accident and emergency department (AED). Moreover, RCHE staff are largely untrained in managing EOL patients. Environmentally, RCHEs are largely overcrowded, with no extra room for a resident to pass their last moments in privacy. Geriatric and palliative care specialists available to RCHEs are also insufficient. The lack of a family practice model whereby doctors would visit patients at home or the RCHE to provide EOL care is another obstacle.
 
New developments in end-of-life care at residential care homes for the elderly
The wishes of older people in RCHEs has been the subject of research recently. One study showed that 28.8% of the older residents wished to die in the RCHE as an alternative to a hospital.20 Another local study showed that 35% of older people would prefer dying in their RCHEs.21 A pioneer programme in the Haven of Hope Nursing Home has achieved favourable results, with nearly 30% of all deaths occurring in the nursing home.22
 
There have been encouraging developments in EOL care for older people in RCHEs in the past 10 years. A new model of EOL care has been implemented in the New Territories East Cluster in Hong Kong aiming at promoting quality EOL care for RCHE residents, through the establishment of an advance care plan (ACP) and introduction of a new care pathway.23 The pathway bypasses the emergency and acute medical wards by direct clinical admission to an extended-care facility. A study on this programme shows that nearly 40% of EOL patients could be managed entirely in an extended-care setting without compromising the quality of care and survival.23
 
In September 2009, the Hong Kong West Community Geriatric Assessment Team (HKW CGAT), which is based at the Tung Wah Group of Hospitals Fung Yiu King Hospital (FYKH), piloted the EOL programme for RCHE in cooperation with two care and attention homes.24 The programme aimed at providing EOL care for older RCHE residents with advanced irreversible chronic medical illnesses and cancers, ensuring the elderly people were able to have a comfortable and dignified period in the RCHE before they died. The Gold Standards Framework for the three illness trajectories was used to identify suitable candidates to join the EOL programme.25 In the programme, there were weekly EOL clinics and family conferences. An ACP and Do-Not-Attempt Cardiopulmonary Resuscitation (DNACPR) [non-hospitalised] option would be established. If patients were cognitively intact, an advance directive would also be created based on the wishes of the older residents. The patients/family members could select one of the two pathways, specifically the Hospital Pathway and AED Pathway. In the Hospital Pathway, an elderly person would be clinically admitted to a geriatric step-down hospital (instead of an acute care hospital) that was suitable for EOL care via an expedited route. In the AED Pathway, an elderly person would stay in the RCHE for as long as possible with support from the RCHE staff and the EOL team of HKW CGAT. At the last moment (when the patient becomes unconscious, his/her breathing becomes shallow, and/or blood pressure starts to drop), he/she would be transferred to the AED by ambulance. Resuscitation would still be carried out by the ambulance staff, as the Fire Services Ordinance in Hong Kong stipulates that resuscitation has to be carried out for their patients. When the patient reaches the AED, resuscitation would not be offered. Instead, a single room would be offered in the AED, allowing family members to stay with the dying patient. The AED doctors would help to certify death when the patient passed away, whereas the death certificate would be signed by the HKW CGAT doctors who had seen the patient within the previous 2 weeks.
 
An audit of the programme was performed to study the RCHE residents who had joined the piloted EOL programme for RCHE and passed away in the AED between September 2009 and August 2014.26 Twenty-two patients joined the programme with AED Pathway during the audit period. Nine (41%) patients finally died in the AED. When they arrived at the AED, all were not resuscitated according to the DNACPR (non-hospitalised) order and were allocated a single room for the family members to say goodbye. In the last 180 days before death, they had an average (per person) of 2.67 AED attendances (including the death episode in the AED), 1.67 medical admissions, and 16 medical bed-days. These figures were lower than those reported by the Hospital Authority in 2012 (2.98 AED attendances, 2.56 medical admissions, 26 medical bed-days) for local RCHE residents during the last 180 days of life.26 It seems that the AED Pathway was logistically feasible and potentially could reduce AED and hospital service utilisation. The programme is also a good model of medico-social collaboration in taking care of EOL patients.
 
In October 2015, a programme called ‘Enhance community geriatric assessment team support to end-of-life patients in residential care homes for the elderly’ was implemented by the Hospital Authority in Hong Kong. It was first started in Hong Kong West, Hong Kong East, New Territories West, and New Territories East clusters in 2015. In the programme, the CGAT service is enhanced, with a link-nurse as a case manager for older people in RCHEs approaching the EOL stage. The CGAT also collaborates with palliative care specialists to implement this programme. In the Hong Kong West Cluster, the CGAT collaborates with the Palliative Medical Unit of the Grantham Hospital. The Unit provides training to RCHE and CGAT staff, holds regular case conferences with the HKW CGAT, and assists in complex case management. To avoid duplication of service provision, RCHE patients who have been seen by the palliative care team are not recruited into the CGAT EOL programme. An ACP will be deliberated with patients and family members, and documented in a standard ACP form. Orders of DNACPR (non-hospitalised) are made if agreed by a patient or family members. An advance directive may also be signed if the patient is mentally sound and wishes to do so. The RCHE staff bring the ACP, DNACPR (non-hospitalised) records, and advance directive document (if available) whenever the older residents attend the AED or are admitted to hospital. An ACP without an advance directive is not legally binding. The health care team, if possible, will usually act in accordance with the wishes of the patients and family members as laid down in the ACP. The final treatment decision will be based on the assessment and judgement of the health care team. An advance directive is a legally binding order and has to be strictly adhered to by the health care team. The plan of the Hospital Authority is to expand the enhanced CGAT support to EOL patients in RCHE service to all clusters in the near future.
 
End-of-life care for older patients in the hospital setting
In view of the rising number of older patients with advanced and irreversible chronic medical illnesses dying in hospitals, FYKH—a geriatric step-down hospital—established the End-of-Life Clinical Plan for Inpatients (EOL-CPi) in 2012. At the time of writing, the EOL-CPi has been used for nearly 400 patients. A recently published study shows that a tailor-made clinical plan could be useful to guide the team in fostering dignified death in dying patients in a geriatric step-down hospital.27 Patients and relatives are satisfied with the programme as a whole. In August 2015, an EOL ward with eight beds was established in FYKH. A preliminary study of 149 patients who died in the EOL ward shows that it can enhance dignified death by providing a peaceful environment so that family members are able to stay with the patient for as long as possible before they die (unpublished data).
 
Feeding problems in end-of-life care
Poor feeding or swallowing difficulties may occur at the end stage of cancers. Similarly, many irreversible chronic diseases are associated with eating problems at the EOL stage. For instance, dementia, at the end stage, is commonly associated with feeding problems. When eating difficulties arise, unless there is a valid advance directive refusing enteral feeding, tube feeding is often started in Hong Kong. Tube feeding has shortcomings and complications.28 29 30 As yet, no benefits of survival or nutrition, and aspiration reduction have been demonstrated. Residents in RCHE with feeding tubes are frequently transferred to the AED to manage tube complications such as blockage and dislodgement.31 Different societies throughout the world, including the American Geriatrics Society and the Australian and New Zealand Society for Geriatric Medicine, have recommended against the use of tube feeding in advanced dementia, at least as the only option.32 33 Careful (or comfort) hand feeding (CHF) should be offered as it is at least as good as tube feeding for the outcomes of death, aspiration pneumonia, and comfort.34 35 In September 2015, the Hospital Authority guideline on life-sustaining treatment in the terminally ill was updated.36 Among other key EOL issues, it provides a clear and locally relevant picture of CHF from the ethical perspective.36 In some geriatric step-down hospitals such as FYKH, CHF is already incorporated as one of the management strategies for EOL patients. There are many practical difficulties, however, if CHF is used in EOL care for older patients with feeding difficulties in Hong Kong. Training of health care teams, better nursing staff-to-patient ratio, and elderly-friendly ward design are all essential elements for more elderly patients to be offered CHF. Training of RCHE staff and staff-resident ratio will be vital factors to determine whether CHF can be smoothly practised in the community of Hong Kong. Without a well-prepared EOL plan, patients receiving CHF will be given enteral tubes. The Social Welfare Department can play a role in encouraging RCHEs in practising EOL care and CHF. More training in EOL issues should be given to primary doctors who look after older people with advanced and irreversible chronic medical illnesses.37
 
What’s next?
Many new developments in EOL care have been seen in the past 10 years in Hong Kong. It is encouraging to see that the Hong Kong SAR Government has begun to look into EOL care for older people in the past few years. Many other organisations, including the Hong Kong Jockey Club, have funded innovative programmes and research projects in EOL themes. Notwithstanding, in the 2015 Quality of Death Index by The Economist, Hong Kong ranks 22nd in the world (Singapore ranks 12th and Taiwan sixth).38 This shows that Hong Kong still has a lot to do to catch up with other Asian neighbours. Further development and expansion of an EOL programme for older people with advanced and irreversible chronic medical illnesses in Hong Kong, in particular for those living in RCHEs, is needed. The Hospital Authority has to work with the Fire Services Department to establish guidelines for avoiding resuscitation among terminally ill patients who have opted for no resuscitation in an advance directive or in another form of ACP. At the time of writing this article, the Hong Kong Special Administrative Region Government is exploring the realisation of enduring power of attorney for health care decision-making, allowing mentally incapacitated older people to express their wishes through a chosen advocate.39 In academia, more studies of EOL issues in the Hong Kong Chinese population are needed. For instance, although the notion of ‘good death’ has been described in western societies, the concept of ‘good death’ among Chinese population, especially those who are frail or confused with multiple co-morbidities including advanced dementia, has not been fully delineated. Accurate prediction of life expectancy is often difficult in older non-cancer patients, including those with advanced dementia and chronic irreversible medical illnesses. Future studies are needed to establish a validated tool applicable to local Chinese older patients in predicting mortality.
 
Declaration
The author has disclosed no conflicts of interest.
 
References
1. Hong Kong population projections 2012-2014. Hong Kong: Census and Statistics Department, the Government of the Hong Kong Special Administrative Region.
2. Luk JK, Chiu PK, Chu LW. Factors affecting institutionalization in older Hong Kong Chinese patients after recovery from acute medical illnesses. Arch Gerontol Geriatr 2009;49:e110-4. Crossref
3. Luk JK, Chan FH, Pau MM, Yu C. Outreach geriatrics service to private old age homes in Hong Kong West Cluster. J Hong Kong Geriatr Soc 2002;11:5-11.
4. Lo RS, Woo J. Palliative care in the elderly. J Hong Kong Geriatr Soc 2000;10:16-24.
5. Luk JK, Chan WK, Ng WC, et al. Mortality and health services utilisation among older people with advanced cognitive impairment living in residential care homes. Hong Kong Med J 2013;19:518-24.
6. Gibbs LM, Addington-Hall J, Gibbs JS. Dying from heart failure: lessons from palliative care. Many patients would benefit from palliative care at the end of their lives. BMJ 1998;317:961-2. Crossref
7. Caird FI. The importance of psychological symptoms in Parkinson’s disease. Age ageing 1999;28:335-6. Crossref
8. Mitchell SL, Kiely DK, Hamel MB, Park PS, Morris JN, Fries BE. Estimating prognosis for nursing home residents with advanced dementia. JAMA 2004;291:2734-40. Crossref
9. Marsh GW, Prochoda KP, Pritchett E, Vojir CP. Predicting hospice appropriateness for patients with dementia of the Alzheimer’s type. Appl Nurs Res 2000;13:187-96. Crossref
10. Smith R. A good death. An important aim for health services and for us all. BMJ 2000;320:129-30. Crossref
11. Luk JK, Kwok T, Woo J. Geriatric screening in acute care wards—a novel method of providing care to elderly patients. Hong Kong Med J 1999;5:34-8.
12. Chan WC, Tse HS, Chan TH. What is good death: bridging the gap between research and intervention. Death, dying and bereavement—a Hong Kong experience. Chapter 9. Hong Kong: Hong Kong University Press; 2006.
13. Luk JK, Liu A, Ng WC, Lui B, Beh P, Chan FH. End-of-life care: towards a more dignified dying process in residential care homes for the elderly. Hong Kong Med J 2010;16:235-6.
14. Chan KS. Peaceful death in nursing home—a family perspective. Hong Kong Society of Palliative Medicine Newsletter 2006;(3):3.
15. Registration of a death. Available from: http://www.gov. hk/en/residents/immigration/bdmreg/death/deathreg/naturalcause.htm. Accessed 18 Mar 2017.
16. Application for a permit for removal of dead body from Hong Kong. Available from: http://www.immd.gov.hk/eng/services/birth-death/Apply_for_a_permit_to_remove_a_dead_body_from_Hong_Kong.html. Accessed 18 Mar 2017.
17. Luk JK, Liu A, Ng WC, Beh P, Chan FH. End-of-life care in Hong Kong. Asian J Gerontol Geriatr 2011;6:103-6.
18. Lam PT, Madocks I. Dying in place—palliative care in nursing home—an Australian perspective and its relevance to Hong Kong. Hong Kong J Gerontology 1998;12:49-53.
19. Hong Kong Ordinances: CAP 504 Coroners Ordinance. Available from: http://www.hklii.org/hk/legis/en/ord/504/. Accessed 18 Mar 2017.
20. Luk JK, Chu LW, Chan FH, Sham MM, Szeto Y, Law PK. A study of the knowledge and preferences in Chinese elderly concerning advance directive. Proceedings of the Hospital Authority Convention 2007; 2007 May 7-8; Hong Kong.
21. Chu LW, Luk JK, Hui E, et al. Advance directive and endof- life care preferences among Chinese nursing home residents in Hong Kong. J Am Med Dir Assoc 2011;12:143-52.Crossref
22. Chu WW, Leung AC, Lam C, Chan KS, Chui YT. An evaluation of a shared care program in end-of-life care service in a sub-vented nursing home in Hong Kong. Proceedings of the Hospital Authority Convention 2004; 2004 May 8-11; Hong Kong.
23. Hui E, Ma HM, Tang WH, et al. A new model for end-of-life care in nursing homes. J Am Med Dir Assoc 2014;15:287-9. Crossref
24. Ho AH, Luk JK, Chan FH, et al. Dignified palliative longterm care: an interpretive systemic framework of end-of-life integrated care pathway for terminally ill Chinese older adults. Am J Hosp Palliat Care 2016;33:439-47. Crossref
25. The National Gold Standards Framework Centre in End of Life Care. Available from: http://www. goldstandardsframework.org.uk. Accessed 18 Mar 2017.
26. Luk JK, Chan TC, Chan WK, Ng WC, Mok WW, Chan FH. End of life program in residential care homes reduces unnecessary hospital admissions and fosters ‘good death’ in last phase of life. Proceedings of the Hospital Authority Convention 2015; 2015 May 18-19; Hong Kong.
27. Luk JK, Chan TC, Mok WW, Wong EK, Chan FH. End-oflife clinical plan in a geriatric step-down hospital. Asian J Gerontol Geriatr 2016;11:42-7.
28. Luk JK, Chan DK. Preventing aspiration pneumonia in older people: do we have the ‘know-how’? Hong Kong Med J 2014;20:421-7. Crossref
29. Kuo S, Rhodes RL, Mitchell SL, Mor V, Teno JM. Natural history of feeding-tube use in nursing home residents with advanced dementia. J Am Med Dir Assoc 2009;10:264-70. Crossref
30. Teno JM, Mitchell SL, Kuo SK, et al. Decision-making and outcomes of feeding tube insertion: a five-state study. J Am Geriatr Soc 2011;59:881-6. Crossref
31. Odom SR, Barone JE, Docimo S, Bull SM, Jorgensson D. Emergency department visits by demented patients with malfunctioning feeding tubes. Surg Endosc 2003;17:651-3. Crossref
32. American Geriatrics Society Ethics Committee and Clinical Practice and Models of Care Committee. American Geriatrics Society feeding tubes in advanced dementia position statement. J Am Geriatr Soc 2014;62:1590-3. Crossref
33. Australian and New Zealand Society for Geriatric Medicine. Position statement 12: Dysphagia and aspiration in older people. Available from http://www.anzsgm.org/documents/PS12DYSPHAGIA2010cleanfinal.pdf. Accessed 18 Mar 2017.
34. Hanson LC, Ersek M, Gilliam R, Carey TS. Oral feeding options for people with dementia: a systematic review. J Am Geriatr Soc 2011;59:463-72. Crossref
35. Luk JK, Chan FH, Hui E, Tse CY. The feeding paradox in advanced dementia: a local perspective. Hong Kong Med J 2017;23:306-10. Crossref
36. Working Group on Modular Review of HA Guidelines on Life-Sustaining Treatment. HA guidelines on life-sustaining treatment in the terminally ill. 2015. Available from: http://www.ha.org.hk/haho/ho/psrm/HA_Guidelines_on_Life_sustaining_treatement_en_2015.pdf. Accessed Aug 2017.
37. Hong TC, Lam TP, Chao DV. Barriers for primary care physicians in providing palliative care service in Hong Kong—qualitative study. Hong Kong Pract 2010;32:3-9.
38. White paper – Quality of Death Index 2015. Available from: http://www.eiu.com/industry/article/1413563125/white-paper-quality-of-death-index-2015/2015-10-09. Accessed 18 Mar 2017.
39. The Law Reform Commission of Hong Kong. Enduring powers of attorney: personal care. Available from: http://www.hkreform.gov.hk/en/docs/repa2_e.pdf. Accessed 29 Apr 2017.

Polycystic ovary syndrome: a common reproductive syndrome with long-term metabolic consequences

Hong Kong Med J 2017 Dec;23(6):622–34 | Epub 24 Nov 2017
DOI: 10.12809/hkmj176308
© Hong Kong Academy of Medicine. CC BY-NC-ND 4.0
 
REVIEW ARTICLE  CME
Polycystic ovary syndrome: a common reproductive syndrome with long-term metabolic consequences
Tiffany TL Yau, FHKCP, FHKAM (Medicine)1; Noel YH Ng, BSc, MRes1; LP Cheung, FRCOG, FHKAM (Obstetrics and Gynaecology)2; Ronald CW Ma, FRCP, FHKAM (Medicine)1,3
1 Department of Medicine and Therapeutics, The Chinese University of Hong Kong, Shatin, Hong Kong
2 Department of Obstetrics and Gynaecology, The Chinese University of Hong Kong, Prince of Wales Hospital, Shatin, Hong Kong
3 Hong Kong Institute of Diabetes and Obesity, The Chinese University of Hong Kong, Shatin, Hong Kong
 
TT Yau and NY Ng have equal contribution in this study.
 
Corresponding author: Prof Ronald CW Ma (rcwma@cuhk.edu.hk)
 
 
 Full paper in PDF
 
Abstract
Polycystic ovary syndrome is the most common endocrine disorder among women of reproductive age. Although traditionally viewed as a reproductive disorder, there is increasing appreciation that it is associated with significantly increased risk of cardiometabolic disorders. Women with polycystic ovary syndrome may present to clinicians via a variety of different routes and symptoms. Although the impact on reproduction predominates during the reproductive years, the increased cardiometabolic problems are likely to become more important at later stages of the life course. Women with polycystic ovary syndrome have an approximately 2- to 5-fold increased risk of dysglycaemia or type 2 diabetes, and hence regular screening with oral glucose tolerance test is warranted. Although the diagnostic criteria for polycystic ovary syndrome are still evolving and are undergoing revision, the diagnosis is increasingly focused on the presence of hyperandrogenism, with the significance of polycystic ovarian morphology in the absence of associated hyperandrogenism or anovulation remaining uncertain. The management of women with polycystic ovary syndrome should focus on the specific needs of the individual, and may change according to different stages of the life course. In view of the clinical manifestations of the condition, there is recent debate about whether the current name is misleading, and whether the condition should be renamed as metabolic reproductive syndrome.


Introduction
Polycystic ovary syndrome (PCOS) was first described by Stein and Leventhal in 1935,1 when they noted an association between the presence of bilateral polycystic ovaries and signs of amenorrhoea, oligomenorrhoea, hirsutism, and obesity. It is now recognised as one of the most common endocrine disorders of women, affecting between 6% and 12% of women overall.2 A study in southern Chinese reported a prevalence of 2.2% among women of reproductive age.3 The prevalence can be as high as 70% to 80% in women with oligoamenorrhoea and 60% to 70% in women with anovulatory infertility. Women with PCOS have an increased risk of gynaecological, reproductive, medical and sleep problems, and hence are at risk of increased morbidities across the life course (Fig 1).4 Despite being a common condition, however, the presenting features of PCOS are often not recognised, resulting in a delay in diagnosis. In a recent international survey, approximately half of the women with PCOS consulted three or more health care providers before the diagnosis was made, and more than one third experienced a diagnostic delay in excess of 2 years.5
 

Figure 1. Impacts of polycystic ovary syndrome on reproductive, endocrine, and cardiometabolic outcome across the life course
 
Diagnosis of polycystic ovary syndrome: historical aspects and evolution of diagnostic criteria
Polycystic ovary syndrome is considered to be a heterogeneous disorder with multifactorial cause. The principal features of PCOS include hyperandrogenism, oligomenorrhoea, and/or polycystic ovaries. There have been several proposed diagnostic criteria for PCOS as described in Table 1.6 7 8 9 All criteria require exclusion of other disorders that may mimic the clinical features of PCOS, such as thyroid dysfunction, hyperprolactinaemia, non-classic congenital adrenal hyperplasia (CAH), and Cushing’s syndrome.
 

Table 1. Summary of proposed diagnostic criteria for PCOS in adults 6 7 8 9
 
The prevalence of PCOS depends on the diagnostic criteria used to define the disorder. To date, the prevalence of PCOS has been determined primarily using the National Institutes of Health 1990 criteria. A summary report from the National Institutes of Health Evidence-based Methodology Workshop on PCOS in December 2012 concluded that the Rotterdam criteria should be adopted for now because it is the most inclusive.10 Using the Rotterdam criteria, many patients can be diagnosed based on the history and physical examination (eg a history of irregular menses, and clinical signs of hyperandrogenism). The panel also suggested that the disorder should be renamed to more adequately reflect the complex metabolic, hypothalamic, pituitary, ovarian, and adrenal interactions that characterise the syndrome. A previous local study by Lam et al11 comparing the different diagnostic criteria in Hong Kong Chinese women concluded that the Rotterdam criteria are generally applicable to our population. Nevertheless, recent discussion has centred on the importance of hyperandrogenism, and emerging evidence suggests that women with radiological evidence of polycystic ovaries, but no other clinical features of PCOS, represent a population generally of lower risk who are distinct from other women with PCOS who fulfil current diagnostic criteria.12
 
Pathogenesis
To date, the pathophysiology of PCOS remains unclear; yet, substantial evidence suggests it is a multifactorial condition, where interactions between endocrine, metabolic, genetic, and environmental factors intrinsic to each other act in consonance towards a common result (Fig 2).13 14 Also, the heterogeneity of PCOS further reinforces its multifactorial nature. Although familial segregation of cases suggests a genetic component in this syndrome, most of the susceptibility genes and single-nucleotide polymorphisms remain to be discovered.15 16 Among its diverse phenotypes, hyperandrogenism and ovarian dysfunction are recognised as the two main features of PCOS.6 16 Hyperandrogenism in PCOS is recognised as the excessive androgen biosynthesis, use, and metabolism. When the ovaries are stimulated to produce excessive amounts of androgen, an accumulation of numerous follicles or cysts can be observed in the ovary. Insulin resistance is also a major cause of hyperandrogenism in PCOS, through stimulating the secretion of ovarian androgen and inhibiting hepatic sex hormone–binding globulin (SHBG) production.17 Approximately 80% to 85% of women with clinical hyperandrogenism have PCOS.8 18 Women with PCOS and hyperandrogenism may experience excess hair growth, acne, and/or abnormal folliculogenesis. Three major pathophysiological pathways have been described, but they are not mutually exclusive. They are ovulatory dysfunction, disordered gonadotropin release, and insulin resistance.
 

Figure 2. Pathophysiology of polycystic ovary syndrome
 
Disordered gonadotropin release and excess androgen release
In PCOS, hypersecretion of luteinising hormone (LH) can lead to an increase in androgen production by the ovarian thecal cells. This is thought to be due to increased gonadotropin-releasing hormone (GnRH) pulse frequency, resulting in increased frequency and pulsatile secretion of LH, and increased levels of LH relative to follicle-stimulating hormone (FSH) in the circulation.14 19 20 There also appears to be resistance to the negative feedback by progesterone to the GnRH pulse generator, which is often present by puberty. The increased LH/FSH ratio, along with some ovarian resistance to FSH, results in excess production of androgens from thecal cells in ovarian follicles, leading to impaired follicular development, and reduced inhibition of the GnRH pulse generator by progesterone, thereby setting up a vicious cycle that exacerbates the hypersecretion of LH, and ovulatory dysfunction.14 19 20
 
Ovulatory dysfunction
Unlike the ovarian follicular development in healthy women, in PCOS cases, follicle growth is disrupted due to ovarian hyperandrogenism, hyperinsulinaemia from insulin resistance, and intra-ovarian paracrine signalling. Hyperinsulinaemia further impairs follicle growth by amplifying LH-stimulated and insulin-like growth factor 1 (IGF-1)–stimulated androgen production.21 22 23 24 Hyperinsulinaemia also elevates serum free testosterone levels through decreased hepatic SHBG production, and enhances serum IGF-1 bioactivity through suppression of IGF-binding protein production.25 Insulin excess also promotes premature follicle luteinisation through enhanced FSH-induced granulosa cell differentiation, which arrests granulosa cell proliferation and subsequent follicle growth.26 Finally, overproduction of anti-Müllerian hormone (AMH)27 28 29 by the granulosa cells of ovarian follicles in PCOS appears to antagonise FSH action in small PCOS follicles.30 The relatively lower FSH levels contribute to arrested follicular development in the ovary, leading to amenorrhoea, anovulation, and polycystic morphology.8 16
 
Insulin resistance
In PCOS cases, there is an increased level of bioavailable androgens that leads to increased insulin resistance in peripheral tissues (mostly in the skeletal muscle).31 Insulin resistance causes compensatory hyperinsulinaemia and might contribute to hyperandrogenism and gonadotropin aberrations through several mechanisms. Insulin may act directly in the hypothalamus, the pituitary or both and thereby contribute to abnormal gonadotropin levels. By facilitating the stimulatory role of LH, hyperinsulinaemia leads to further increase in ovarian androgen production in theca calls.32 High insulin can also serve as a co-factor to stimulate adrenocorticotropic hormone–mediated androgen production in the adrenal glands.33 Moreover, an insulin-induced decrease in the production of SHBG in the liver increases the amount of free bioavailable androgens.34
 
Most women with PCOS, particularly those who are overweight or obese, do in fact have insulin resistance and compensatory hyperinsulinaemia,35 36 partly attributable to an intrinsic insulin resistance mechanism.36 37 38
 
Using the homeostasis model assessment, 50% to 70% of women with PCOS demonstrate insulin resistance. Using the gold standard technique of euglycaemic hyperinsulinaemic clamp, it was found that PCOS exhibits insulin resistance that is independent of obesity, and is present even among lean patients with PCOS, but this is further exacerbated in the presence of obesity.39 40
 
A stepwise increase in the prevalence of glucose intolerance with increasing body mass index (BMI) has been described in cross-sectional studies performed in women with this disorder.41 Although most women with PCOS have normal insulin secretory responsiveness, studies have suggested that PCOS women, particularly those with a family history of type 2 diabetes (T2D), have impaired β-cell function or a subnormal disposition index (an index of β-cell function that takes insulin resistance into account).16 42 43
 
Adipose dysfunction
Although the full molecular mechanisms underlying insulin resistance in PCOS remain unclear, primary defects in insulin-medicated glucose transport,44 GLUT4 production,45 and insulin or adrenergic regulated lipolysis46 in adipocytes (and sometimes in myocytes and fibroblasts) have been reported. Insulin resistance in PCOS contributes to the dysfunctional adipogenesis to some degree from an impaired capacity of regional adipose tissue storage to properly expand with increased dietary caloric intake.47 48 49 Adipose tissue secretes numerous factors to regulate metabolic function, appetite, neural activity, and digestion. This tissue is also heavily infiltrated by macrophages, and a crosstalk exists between adipocytes, macrophages, and pluripotent cells for complex paracrine interactions. It is known that dysregulation of adipokine production, such as adiponectin, by macrophage-secreted cytokines in PCOS facilitates the development of insulin resistance.50 Other adipokines including leptin, retinol-binding protein 4, and visfatin have also been implicated.51 Improved understanding of the underlying mechanisms that govern adipose tissue dysfunction and insulin resistance in PCOS would be beneficial in the identification of novel therapeutic targets for PCOS and other related disorders.16
 
Intrauterine environment
In humans, rhesus monkeys and sheep, inappropriate testosterone exposure during fetal life alters the developmental trajectory of the female leading to PCOS-like phenotypes, such as phenotypic masculinisation; reproductive, neuroendocrine, ovarian disruptions; and hyperinsulinaemia.52 In a human study, it has been shown that there is an increased prevalence of PCOS in women with classic CAH and congenital adrenal virilising tumours.53 In one human study, higher testosterone levels compared with those usually observed in normal females were found in the umbilical vein of female infants born to mothers with PCOS54; yet, another prospective study that investigated the relationship between prenatal androgen exposure and the development of PCOS in female adolescence did not confirm any association between these variables.55
 
Excess fetal exposure to maternal androgens is thought to contribute to induction of the PCOS phenotype in offspring/children. Nonetheless, more clinical studies are needed to confirm the role of intrauterine androgen exposure on human fetal development.
 
Recent insights from genetic studies
Polycystic ovary syndrome has a high heritability of approximately 80%. Although a large number of candidate gene studies have been conducted, no genetic variants have been found to be consistently associated with PCOS. Recent hypothesis-free genome-wide association studies using high-density genotyping arrays that systematically investigate common variants across the genome have identified several genetic loci to be significantly associated with PCOS (Table 2).56 These have shed light on the important role of the gonadotropin axis in the pathogenesis of PCOS, as well as several other novel pathways, including epidermal growth factor signalling. Interestingly, genetic studies have revealed a significant overlap of findings when different diagnostic criteria of PCOS have been applied, highlighting greater homogeneity than previously appreciated.16 56 57
 

Table 2. Genetic loci associated with polycystic ovary syndrome discovered in genome-wide association studies
 
Clinical features and co-morbidities
Gynaecological and reproductive dysfunction
Menstrual dysfunction is common and is characterised by oligomenorrhoea and, less often, amenorrhoea. Nonetheless, menstrual problems are frequently neglected and anovulatory infertility is frequently the initial complaint for which the patient seeks medical advice. Women with PCOS have an increased risk of miscarriage, gestational diabetes, pre-eclampsia, and preterm labour.58 59 60 A meta-analysis highlighted that the risks of gestational diabetes, pregnancy-induced hypertension, and pre-eclampsia are approximately 3-fold, whereas the risk for preterm labour is approximately 2-fold among women with PCOS.58 The reasons for the adverse pregnancy outcomes are unclear, but hypersecretion of LH, hyperandrogenaemia and hyperinsulinaemia have all been postulated. Due to anovulatory dysfunction and consequent long-term unopposed oestrogen stimulation, PCOS patients are at increased risk of endometrial cancer.61 62 Nonetheless, there is currently no consensus to support routine biopsy or ultrasound of the endometrium for endometrial hyperplasia or cancer screening in asymptomatic women due its poor diagnostic accuracy.63
 
Endocrine dysfunction
Women with PCOS have varying degrees and manifestations of androgen excess. Clinical signs of hyperandrogenism include acne, hirsutism, male-pattern hair loss, and/or elevated serum androgen concentrations. Hirsutism is the most common symptom of hyperandrogenism, affecting up to 70% of women with PCOS. It is commonly noted on the upper lip, chin, periareolar area, in the mid-sternum, and along the linea alba of the lower abdomen. There is substantial ethnic variation in hirsutism where Asian women with PCOS have a lesser degree of hirsutism.8 Signs of more severe androgen excess—such as deepening of the voice, breast atrophy, and clitoromegaly—occur rarely and suggest the possibility of ovarian hyperthecosis or an androgen-secreting tumour.
 
Metabolic dysfunction and cardiovascular risks
Polycystic ovary syndrome is associated with cardiovascular risk factors, including obesity, hypertension, glucose intolerance, dyslipidaemia, and obstructive sleep apnoea.64 The high prevalence of metabolic disturbances and the consequent increase in the long-term risk of T2D indicate that PCOS should be considered a general health problem rather than just a reproductive syndrome. Most investigators found that at least one half of PCOS women are obese.8 The prevalence of obesity in PCOS varies widely with the population studied, similar to the wide variability in prevalence of obesity in the general population.
 
Insulin resistance occurs in 60% to 80% of women with PCOS, and 95% of obese women with PCOS. The risk of T2D is increased in PCOS, particularly in women with a first-degree relative with T2D.65 In a systematic review, it was estimated that the prevalence of impaired glucose tolerance and T2D was as high as 31% to 35%, and 7.5% to 20%, respectively, in women with PCOS by their fourth decade, and the risks were significantly higher at all ages and all weights even in young or lean subjects with PCOS.66 67 In Hong Kong, the prevalence of T2D under 35 years old is 0.6% in the general population, but 7.5% in women with PCOS.68
 
Dyslipidaemia is the most common metabolic abnormality in PCOS. Most studies of women with PCOS have demonstrated low high-density lipoprotein cholesterol and high triglyceride concentrations, consistent with their insulin resistance, as well as an increase in low-density lipoprotein cholesterol.69 70 71
 
Metabolic syndrome, characterised by a cluster of cardiometabolic risk factors associated with insulin resistance, is a disease with a large health impact as it confers a 5-fold increase in risk of T2D and a 2-fold increase in risk of cardiovascular diseases.72 A cross-sectional study evaluated the cardiometabolic risk factors in 295 Hong Kong Chinese women with PCOS with a mean age of 30 years.68 It found that the prevalence of metabolic syndrome in this cohort was 24.9% despite their relatively young age, a 5-fold increase in risk compared with women without PCOS even after controlling for age and BMI.68 In another study involving 170 Asian women with PCOS, metabolic syndrome as defined according to the International Diabetes Federation criteria was present in 35.3% of the subjects.73
 
The prevalence of non-alcoholic fatty liver disease (including non-alcoholic steatohepatitis), and obstructive sleep apnoea is also increased in women with PCOS. Even after controlling for BMI, women with PCOS are still 30 times more likely to have sleep-disordered breathing and 9 times more likely than controls to have daytime sleepiness.74 75
 
The presence of obesity, insulin resistance, impaired glucose tolerance (or T2D), and dyslipidaemia may predispose women with PCOS to coronary heart disease. An excess risk of coronary heart disease or stroke in women with PCOS, however, is not well established due to the lack of long-term prospective studies. Available studies are mostly too small to detect differences in event rates, and none have shown an evident increase in cardiovascular events.76 77 78 79 Therefore, the focus has been on risk factors of cardiovascular disease although these may not necessarily equate with events or mortality. Studies have found that women with PCOS have an increased carotid intima media thickness and coronary artery calcification, the two major surrogate markers for atherosclerotic cardiovascular disease.80 81 82 Serum concentrations of C-reactive protein, a biochemical predictor of cardiovascular disease, also appear to be commonly elevated in women with PCOS.83
 
Patient evaluation
Clinical features
The history-taking should include detailed inquiry about growth and sexual development, menstrual pattern, reproductive history, medical and drug history, symptoms of androgen excess, co-existing cardiovascular risk factors such as tobacco and alcohol use, and family history. Drug history is important as a history or current use of sodium valproate has been shown to be associated with PCOS.
 
During the physical examination, it is essential to search for signs of androgen excess (hirsutism, acne, androgenic alopecia) and insulin resistance (acanthosis nigricans). Modified Ferriman-Gallwey scoring is the method generally used to evaluate clinical hirsutism, but is affected by subjective variability and cosmetic treatments. It has been suggested that in East Asian patients, a lower cut-off of the modified Ferriman-Gallwey score (of 3) should be used instead of the usual cut-off of 8.16 19 As cosmetic hair removal is common in many Asian countries, evaluation of hirsutism should always include enquiry about any previous hair-removal procedures. Assessment of blood pressure, BMI, and waist circumference is also essential. Features of virilisation, Cushing’s syndrome, and thyroid dysfunction should also be looked for and excluded.19
 
Biochemical features
Laboratory measurements should include tests to achieve the diagnosis, exclude other endocrine problems, and evaluate cardiovascular risk factors. In someone with clinical signs of hyperandrogenism, one could argue that biochemical testing is not necessary according to current diagnostic criteria. Most expert groups, however, suggest measuring total testosterone concentration in women who present with hirsutism. Women with PCOS mostly have high-normal or borderline elevated levels of testosterone.
 
Elevated total testosterone is the most direct evidence for androgen excess, but it is important to note that most assays are relatively inaccurate at the lower levels present in females, and use of mass spectrometry–based assays of total testosterone are more accurate and preferred.9 Measurement of free testosterone is a more sensitive test, but commercially available free testosterone assays are often unreliable. The free testosterone index, calculated by total testosterone divided by SHBG, is considered more reliable but is not routinely performed due to the high cost of measuring SHBG.9 Serum LH and FSH levels should be measured at the early follicular phase of the menstrual cycle. Ovulatory assessment such as mid-luteal progesterone measurement is sometimes required in patients seeking infertility treatment. In rare instances where there are rapidly progressive features of hyperandrogenism, virilising symptoms, or markedly elevated androgen levels (such as a serum testosterone >5 nmol/L), additional investigations to exclude an androgen-secreting tumour may be indicated, including checking cortisol, dehydroepiandrosterone sulfate, and imaging of the adrenal glands and ovaries. As mentioned earlier, AMH is implicated in the pathogenesis of PCOS, and recent studies have highlighted its potential utility in the diagnosis of women with PCOS,16 although no diagnostic cut-off value has been defined yet due to the heterogeneity between the different AMH assay methods.
 
Blood tests to exclude other endocrine problems include thyroid function tests, prolactin, or tests to exclude other underlying causes of excess androgens, including 17-hydroxyprogesterone to exclude late-onset CAH and the 1-mg overnight dexamethasone suppression test to exclude Cushing’s syndrome. It is sometimes noted that women with PCOS have mildly elevated prolactin.20 If the level of 17-hydroxyprogesterone is borderline elevated, a short synacthen test with measurement of 17-hydroxyprogesterone may be indicated to exclude late-onset CAH.19
 
Assessment of cardiovascular risk factors includes an oral glucose tolerance test (OGTT) and fasting lipid profiles. Fasting glucose, although more convenient, has been shown to underestimate diabetes prevalence and cardiovascular risk when compared with OGTT, particularly in obese subjects. Measuring fasting glucose alone is therefore inadequate for the assessment of dysglycaemia in women with PCOS.84 Patients with normal glucose tolerance should be re-screened at least once every 2 years, or more frequently if additional risk factors are identified. Patients with impaired glucose tolerance should be screened annually for development of T2D.
 
Ultrasound features
The use of ultrasound in the diagnosis of PCOS must be tempered by an awareness of the broad spectrum of women with ultrasonographic findings characteristic of polycystic ovaries.85 If the patient has both oligo-ovulation and hyperandrogenism, a transvaginal ultrasound to document polycystic ovaries is not necessary according to the Rotterdam criteria. In women who are ready to conceive, ultrasound can be used to monitor and document ovulation.
 
The ultrasound criteria in the diagnosis of PCOS have evolved since the first ultrasound description of polycystic ovaries in 1986.8 The Rotterdam criteria described polycystic ovaries as the presence of ≥12 follicles in each ovary measuring 2 to 9 mm in diameter and/or increased ovarian volume of >10 mL. One ovary fulfilling this definition is sufficient to define polycystic ovaries. More recently, it has been proposed that if newer technology such as ultrasound machines with transducer frequency of ≥8 MHz are available, then raising the follicle number per ovary to 25 for diagnosing PCOS would be more specific.86
 
Ultrasonography is operator-dependent and requires expertise. Transvaginal ultrasound is the method of choice, but is practically difficult in patients without previous sexual experience. Transrectal ultrasound examination is an alternative in women where transvaginal scan is not possible. Transabdominal ultrasound has poorer resolution, especially in obese subjects. Recent research suggests that ultrasound might be useful to supplement the diagnosis in the event of ovulatory disturbance without hyperandrogenism.12 86 87
 
Treatment approach
The management of women with polycystic ovary varies according to the main symptoms and primary problem experienced by the patient. The particular needs of the patient may change according to different stages of the life course, from adolescence through to reproductive age.88 Hence management should involve a multidisciplinary approach involving paediatricians, gynaecologists, endocrinologists, family physicians, dietitians, clinical psychologists, and surgeons, as appropriate.84
 
Management of menstrual irregularity
Menstrual irregularity is one of the most common presenting symptoms of patients with PCOS, and often reflects underlying ovarian dysfunction and anovulation. Chronic anovulation and secondary amenorrhoea can be associated with endometrial hyperplasia and increased risk of endometrial carcinoma, along with other complications associated with amenorrhoea including osteoporosis. Overweight women with PCOS should be encouraged to lose weight; as low as a 5% reduction in body weight is associated with improvement in amenorrhoea.88 89 90 Previous studies have highlighted that a lifestyle modification programme is associated with improvement in menses, hirsutism, biochemical hyperandrogenism, and insulin resistance.90 91
 
Progestagens can be administered both as a diagnostic test to induce progesterone withdrawal, as well as to treat amenorrhoea. Cyclical progestagens, preferably given 12 to 14 days per month, can be used to ensure regular withdrawal bleeding to avoid endometrial hyperplasia, and are associated with less-adverse cardiometabolic effects than combined oestradiol-progestagen pills. Periodic short courses of progestogen (2-3 monthly) are an alternative option.
 
The use of the combined oral contraceptive (COC) pill, with its beneficial effects on suppressing excess androgen and its manifestations, has been a commonly used and convenient treatment for amenorrhoea, with the added benefit of providing contraception. In women with PCOS, COC formulations containing less androgenic progestagens are preferred. Nonetheless, there has been some debate about whether the use of COC may cause exacerbation of cardiometabolic risk.92 Contra-indications to use of a COC include heavy smokers aged ≥35 years, those with hypertension or established cardiac disease, and those with multiple cardiovascular risk factors.93 Nevertheless, current recommendations suggest that this is a useful alternative, although clinicians should monitor for changes in body weight, blood pressure, lipid profile as well as dysglycaemia if patients are prescribed COC, especially if the patient is overweight.
 
Management of hyperandrogenism
As highlighted earlier, administration of an oestrogen-containing oral contraceptive has beneficial effects on hyperandrogenism. Furthermore, the oral contraceptive pill containing the anti-androgenic progestagen cyproterone acetate, administered in cyclical doses, or drospirenone-containing COC might be beneficial for hirsutism.16 The use of cyproterone-containing pills to alleviate hyperandrogenic symptoms should ideally be limited to short-term use and discontinued 3 to 4 months after symptom resolution due to higher thromboembolic risk than the first-line COC pills.94 Other anti-androgens, such as finasteride, are sometimes used in severe cases of hirsutism, although again patients need to ensure they avoid conceiving whilst on anti-androgenic drugs.
 
In most circumstances, women may elect to use cosmetic measures to treat the clinical manifestations of hyperandrogenism. Different cosmetic approaches for hair removal—including shaving, waxing, and electrolysis—have variable efficacy and duration of effects. Laser therapy in the form of photoepilation represents a more permanent solution but is also more costly.4 Other options for treatment of hirsutism due to hyperandrogenism include use of topical eflornithine that may help reduce excess facial hair.
 
Management of anovulatory infertility
The presence of anovulatory infertility can be investigated by measurement of progesterone in the mid-luteal phase of the menstrual cycle (eg day 21 of a 28-day cycle, or day 28 of a 35-day cycle), and can help to establish the presence of anovulation. The monitoring of basal body temperature to confirm ovulation does not predict ovulation reliably, and is no longer recommended.95 In patients with anovulatory infertility, clomiphene treatment is usually considered the first-line treatment. Clomiphene should be started at a low dose (eg 50 mg daily for 5 days per cycle) and gradually increased until the lowest effective dose that achieves ovulation is reached, but this requires close monitoring, especially for the potential side-effects of multiple pregnancy and ovarian hyperstimulation. Treatment can be repeated if unsuccessful, but the majority of patients who respond usually do so within the first three cycles.4 96 The highest recommended dose for clomiphene is 150 mg, and if the woman still does not respond, second-line treatment should be considered.
 
Metformin has beneficial effects on anovulation. In a systematic review and meta-analysis, metformin was found to be associated with increased success at inducing ovulation.97 Doses vary in clinical trials from 1 g daily to higher doses. In a multicentre randomised controlled trial, therapy-naїve PCOS women who received metformin had a significantly lower live birth rate than women who conceived through clomiphene alone, or were treated with a combination of clomiphene and metformin.98 The use of metformin as a co-treatment with clomiphene has been shown to improve ovulation in women with clomiphene-resistant PCOS.99 Metformin is in general stopped after successful conception, although some advocate continued use during the first trimester to reduce the risk of spontaneous miscarriage. This is still an area of controversy, and the pros and cons of continuing metformin should be carefully discussed. Metformin is known to cross the placenta but it has also been shown to be a useful treatment for gestational diabetes.
 
Aromatase inhibitors reduce circulating oestrogen levels, lead to a rise in pituitary FSH, and have previously shown beneficial effects in a meta-analysis. Letrozole, an aromatase inhibitor, was found to be superior to clomiphene in achieving live births in a randomised clinical trial.100
 
Daily injections of exogenous gonadotropins, including recombinant FSH or menopausal gonadotropin, have been found to improve ovulation induction among women who did not respond to other treatments. This treatment requires careful monitoring, and should be used with a ‘chronic low-dose step-up’ approach as outlined by the ESHRE/ASRM to avoid multiple pregnancies or ovarian hyperstimulation syndrome.96 101
 
Ovarian surgery/drilling/laparoscopic ovarian diathermy
Surgical procedures such as ovarian wedge resection or ovarian drilling by diathermy or laser lead to a decreased number of antral follicles, reduced ovarian androgen production, and improved ovulation.16 Ovarian wedge resection is no longer performed due to the higher extent of adhesion formation and ovarian tissue damage. Ovarian drilling has been used as an alternative to exogenous gonadotropins for treatment of anovulatory infertility, with similar success rates. The main limitations include the potential for formation of adhesions, and reduced ovarian reserve. In a retrospective analysis of Chinese women with PCOS treated by laser diathermy, spontaneous ovulation rates and cumulative pregnancy rates were similar regardless of the presence or absence of metabolic syndrome.102
 
Assisted reproductive procedures
In women who fail second-line treatment such as metformin, ovarian drilling or ovarian stimulation with gonadotropins, third-line treatment such as intrauterine insemination or in-vitro fertilisation can be considered.17
 
Management of cardiometabolic risk
Women with PCOS are at substantially increased cardiometabolic risk, and therefore should undergo periodic evaluation of associated risk factors.4 Overweight women with PCOS should undergo comprehensive evaluation by a dietitian, and be encouraged to lose weight. Weight loss of approximately 5% is already associated with improved metabolic parameters as well as reproductive outcome. Even among women with normal BMI, those with PCOS appear to have increased visceral adiposity that contributes to the endogenous insulin resistance, and is correlated with metabolic parameters, fatty liver as well as carotid intimal-medial thickness.103
 
In addition to lifestyle measures, women should be screened for glucose intolerance by an OGTT. Screening using fasting glucose alone is inadequate in this high-risk population.4 Presence of impaired glucose tolerance may warrant treatment with metformin given the multiple metabolic and reproductive benefits, regardless of whether there is clinical evidence of insulin resistance. Overt diabetes should be treated using an appropriate combination of dietary treatment, metformin, other oral glucose-lowering agents, and in some cases, insulin. The choice of agent should depend on the underlying pathophysiology (eg whether obesity is present), but also take into account the fertility wishes and plans of the patient. Metformin in combination with lifestyle intervention has been found to be associated with greater reduction in BMI compared with lifestyle intervention alone.104 Several studies have demonstrated the efficacy of thiazolidinediones in improving metabolic parameters as well as menses and hyperandrogenism in women with PCOS. Due to possible adverse effects, however, this class of agent is currently not recommended for treatment of insulin resistance among women with PCOS.4
 
Treatment of hypertension likewise should take into account the fertility wishes of the patient. Screening for other secondary causes of young-onset hypertension may be necessary, especially if atypical features such as proteinuria are present. Preferred anti-hypertensive agents in women contemplating pregnancy would be the older agents such as methyldopa. It is notable that women with pre-existing hypertension are more likely to develop hypertension-related complications during pregnancy, and therefore require more strict surveillance during pregnancy. Hyperlipidaemia can be managed using dietary measures, and in some cases, lipid-lowering agents such as HMG CoA (3-hydroxy-3-methylglutaryl coenzyme A) reductase inhibitors. If there are plans for pregnancy, drug treatment with lipid-lowering treatment should be withheld.
 
Psychological distress, anxiety, and depression are common among women with PCOS, and may be linked to some of the skin complications such as hirsutism and acne or presence of menstrual and fertility problems; all these impact on psychological well-being. Clinicians need to have a high level of awareness and screen for these symptoms when appropriate and offer the necessary referrals for psychological support. Sleep-disordered breathing including obstructive sleep apnoea is also common, impacts sleep quality, and can exacerbate both mood problems as well as cardiometabolic risk. It should be screened for and managed accordingly. In those with marked obesity, bariatric surgery is an option to address obesity and associated metabolic abnormalities. Interestingly, a systematic review including 13 primary studies found that the incidence of PCOS was reduced from 45.6% to 7.1% after bariatric surgery.105
 
The screening and management of metabolic abnormalities is particularly relevant in those women with PCOS who are planning a pregnancy or undergoing fertility treatment. Women with PCOS are at increased risk of different complications including gestational diabetes and pre-eclampsia. Undiagnosed gestational diabetes/maternal hyperglycaemia or poorly controlled blood pressure all contribute to poorer pregnancy outcome among women with PCOS. Optimal management before pregnancy and intrapartum can help to minimise the risk of these pregnancy complications.
 
Conclusions
Polycystic ovary syndrome is a multi-faceted syndrome that is becoming increasingly recognised, and is an important contributor to multiple medical and reproductive problems. As illustrated in this review, given the multiple reproductive and metabolic complications associated with PCOS, patients may seek medical attention via a variety of different channels, and may present to clinicians through different disciplines. Clinicians therefore need to recognise the multi-faceted nature of this complex disorder and be aware of the associated complications. Diagnostic criteria are still evolving, although currently the Rotterdam criteria remain the most widely accepted. Given the burden of metabolic complications associated with the disorder, there has been much recent discussion regarding the potential need to rename the syndrome to better highlight its metabolic consequences, in addition to the known reproductive features. The long-term risks of the different complications are still not clearly defined, given the scarcity of well-conducted prospective studies. These limitations in our current knowledge highlight the need to follow-up this group of high-risk women.
 
Acknowledgement
RCW Ma acknowledges support from the Research Grants Council General Research Fund (Ref. 14110415).
 
Declaration
All authors have disclosed no conflicts of interest.
 
References
1. Stein IF, Leventhal ML. Amenorrhea associated with bilateral polycystic ovaries. Am J Obstet Gynecol 1935;29:181-91. Crossref
2. March WA, Moore VM, Willson KJ, Phillips DI, Norman RJ, Davies MJ. The prevalence of polycystic ovary syndrome in a community sample assessed under contrasting diagnostic criteria. Hum Reprod 2010;25:544-51. Crossref
3. Chen X, Yang D, Mo Y, Li L, Chen Y, Huang Y. Prevalence of polycystic ovary syndrome in unselected women from southern China. Eur J Obstet Gynecol Reprod Biol 2008;139:59-64. Crossref
4. Legro RS, Arslanian SA, Ehrmann DA, et al. Diagnosis and treatment of polycystic ovary syndrome: an Endocrine Society clinical practice guideline. J Clin Endocrinol Metab 2013;98:4565-92. Crossref
5. Gibson-Helm M, Teede H, Dunaif A, Dokras A. Delayed diagnosis and a lack of information associated with dissatisfaction in women with polycystic ovary syndrome. J Clin Endocrinol Metab 2017;102:604-12.
6. Zawadski J, Dunaif A. Diagnostic criteria for polycystic ovary syndrome: towards a rational approach. In: Dunaif A, Givens JR, Haseltine FP, Merriam GR, editors. Polycystic ovary syndrome. Boston: Blackwell Scientific Publications; 1992: 377-84.
7. Rotterdam ESHRE/ASRM-Sponsored PCOS Consensus Workshop Group. Revised 2003 consensus on diagnostic criteria and long-term health risks related to polycystic ovary syndrome. Fertil Steril 2004;81:19-25. Crossref
8. Azziz R, Carmina E, Dewailly D, et al. The Androgen Excess and PCOS Society criteria for the polycystic ovary syndrome: the complete task force report. Fertil Steril 2009;91:456-88. Crossref
9. Rosner W, Auchus RJ, Azziz R, Sluss PM, Raff H. Position statement: utility, limitations, and pitfalls in measuring testosterone: an Endocrine Society position statement. J Clin Endocrinol Metab 2007;92:405-13. Crossref
10. Evidence-based Methodology Workshop on Polycystic Ovary Syndrome (PCOS). December 3-5, 2012. Available from: https://www.nichd.nih.gov/about/meetings/2012/Pages/120512.aspx. Accessed 10 Jul 2017.
11. Lam PM, Ma RC, Cheung LP, Chow CC, Chan JC, Haines CJ. Polycystic ovarian syndrome in Hong Kong Chinese women: patient characteristics and diagnostic criteria. Hong Kong Med J 2005;11:336-41.
12. Boyle JA, Teede HJ. PCOS: Refining diagnostic features in PCOS to optimize health outcomes. Nat Rev Endocrinol 2016;12:630-1. Crossref
13. Rojas J, Chávez M, Olivar L, et al. Polycystic ovary syndrome, insulin resistance, and obesity: navigating the pathophysiologic labyrinth. Int J Reprod Med 2014;2014:719050. Crossref
14. Cheung LP. Polycystic ovary syndrome: not only a gynaecological disease. J Paediatr Obstet Gynaecol 2008(May/Jun):125-31.
15. Diamanti-Kandarakis E, Piperi C. Genetics of polycystic ovary syndrome: searching for the way out of the labyrinth. Hum Reprod Update 2005;11:631-43. Crossref
16. Azziz R, Carmina E, Chen Z, et al. Polycystic ovary syndrome. Nat Rev Dis Primers 2016;2:16057. Crossref
17. Goodarzi MO, Dumesic DA, Chazenbalk G, Azziz R. Polycystic ovary syndrome: etiology, pathogenesis and diagnosis. Nat Rev Endocrinol 2011;7:219-31. Crossref
18. Azziz R, Carmina E, Dewailly D, et al. Positions statement: criteria for defining polycystic ovary syndrome as a predominantly hyperandrogenic syndrome: an Androgen Excess Society guideline. J Clin Endocrinol Metab 2006;91:4237-45. Crossref
19. McCartney CR, Marshall JC. Clinical practice. Polycystic ovary syndrome. N Engl J Med 2016;375:54-64. Crossref
20. Franks S. Polycystic ovary syndrome. N Engl J Med 1995;333:853-61. Crossref
21. Agarwal SK, Judd HL, Magoffin DA. A mechanism for the suppression of estrogen production in polycystic ovary syndrome. J Clin Endocrinol Metab 1996;81:3686-91. Crossref
22. Jakimiuk AJ, Weitsman SR, Magoffin DA. 5alpha-reductase activity in women with polycystic ovary syndrome. J Clin Endocrinol Metab 1999;84:2414-8. Crossref
23. Moghetti P, Castello R, Negri C, et al. Metformin effects on clinical features, endocrine and metabolic profiles, and insulin sensitivity in polycystic ovary syndrome: a randomized, double-blind, placebo-controlled 6-month trial, followed by open, long-term clinical evaluation. J Clin Endocrinol Metab 2000;85:139-46. Crossref
24. Bergh C, Carlsson B, Olsson JH, Selleskog U, Hillensjö T. Regulation of androgen production in cultured human thecal cells by insulin-like growth factor I and insulin. Fertil Steril 1993;59:323-31. Crossref
25. Balen AH, Conway G, Homburg R, Legro R. Polycystic ovary syndrome: A guide to clinical management. UK: Taylor & Francis; 2006.
26. Franks S, Gilling-Smith C, Watson H, Willis D. Insulin action in the normal and polycystic ovary. Endocrinol Metab Clin North Am 1999;28:361-78. Crossref
27. Knight PG, Glister C. Local roles of TGF-beta superfamily members in the control of ovarian follicle development. Anim Reprod Sci 2003;78:165-83. Crossref
28. Seifer DB, MacLaughlin DT, Cuckle HS. Serum mullerian-inhibiting substance in Down’s syndrome pregnancies. Hum Reprod 2007;22:1017-20. Crossref
29. Visser JA, de Jong FH, Laven JS, Themmen AP. Anti-Müllerian hormone: a new marker for ovarian function. Reproduction 2006;131:1-9. Crossref
30. Pellatt L, Hanna L, Brincat M, et al. Granulosa cell production of anti-Müllerian hormone is increased in polycystic ovaries. J Clin Endocrinol Metab 2007;92:240-5. Crossref
31. Dunaif A. Insulin resistance and the polycystic ovary syndrome: mechanism and implications for pathogenesis. Endocr Rev 1997;18:774-800. Crossref
32. Diamanti-Kandarakis E, Argyrakopoulou G, Economou F, Kandaraki E, Koutsilieris M. Defects in insulin signaling pathways in ovarian steroidogenesis and other tissues in polycystic ovary syndrome (PCOS). J Steroid Biochem Mol Biol 2008;109:242-6. Crossref
33. Moghetti P, Castello R, Negri C, et al. Insulin infusion amplifies 17 alpha-hydroxycorticosteroid intermediates response to adrenocorticotropin in hyperandrogenic women: apparent relative impairment of 17,20-lyase activity. J Clin Endocrinol Metab 1996;81:881-6. Crossref
34. Yki-Järvinen H, Mäkimattila S, Utriainen T, Rutanen EM. Portal insulin concentrations rather than insulin sensitivity regulate serum sex hormone-binding globulin and insulin-like growth factor binding protein 1 in vivo. J Clin Endocrinol Metab 1995;80:3227-32. Crossref
35. Poretsky L, Cataldo NA, Rosenwaks Z, Giudice LC. The insulin-related ovarian regulatory system in health and disease. Endocr Rev 1999;20:535-82. Crossref
36. Gambineri A, Patton L, Altieri P, et al. Polycystic ovary syndrome is a risk factor for type 2 diabetes: results from a long-term prospective study. Diabetes 2012;61:2369-74. Crossref
37. Bremer AA, Miller WL. The serine phosphorylation hypothesis of polycystic ovary syndrome: a unifying mechanism for hyperandrogenemia and insulin resistance. Fertil Steril 2008;89:1039-48. Crossref
38. Corbould A, Kim YB, Youngren JF, et al. Insulin resistance in the skeletal muscle of women with PCOS involves intrinsic and acquired defects in insulin signaling. Am J Physiol Endocrinol Metab 2005;288:E1047-54. Crossref
39. Dunaif A, Segal KR, Futterweit W, Dobrjansky A. Profound peripheral insulin resistance, independent of obesity, in polycystic ovary syndrome. Diabetes 1989;38:1165-74. Crossref
40. Stepto NK, Cassar S, Joham AE, et al. Women with polycystic ovary syndrome have intrinsic insulin resistance on euglycaemic-hyperinsulaemic clamp. Hum Reprod 2013;28:777-84. Crossref
41. Legro RS. Diabetes prevalence and risk factors in polycystic ovary syndrome. Obstet Gynecol Clin North Am 2001;28:99-109. Crossref
42. Dunaif A, Finegood DT. Beta-cell dysfunction independent of obesity and glucose intolerance in the polycystic ovary syndrome. J Clin Endocrinol Metab 1996;81:942-7. Crossref
43. Ehrmann DA, Kasza K, Azziz R, Legro RS, Ghazzi MN; PCOS/Troglitazone Study Group. Effects of race and family history of type 2 diabetes on metabolic status of women with polycystic ovary syndrome. J Clin Endocrinol Metab 2005;90:66-71. Crossref
44. Dunaif A, Wu X, Lee A, Diamanti-Kandarakis E. Defects in insulin receptor signaling in vivo in the polycystic ovary syndrome (PCOS). Am J Physiol Endocrinol Metab 2001;281:E392-9.
45. Ciaraldi TP, Aroda V, Mudaliar S, Chang RJ, Henry RR. Polycystic ovary syndrome is associated with tissue-specific differences in insulin resistance. J Clin Endocrinol Metab 2009;94:157-63. Crossref
46. Ciaraldi TP. Molecular defects of insulin action in the polycystic ovary syndrome: possible tissue specificity. J Pediatr Endocrinol Metab 2000;13 Suppl 5:1291-3.
47. Ibáñez L, Sebastiani G, Diaz M, Gómez-Roig MD, Lopez-Bermejo A, de Zegher F. Low body adiposity and high leptinemia in breast-fed infants born small-for-gestational-age. J Pediatr 2010;156:145-7. Crossref
48. Virtue S, Vidal-Puig A. It’s not how fat you are, it’s what you do with it that counts. PLoS Biol 2008;6:e237. Crossref
49. Virtue S, Vidal-Puig A. Adipose tissue expandability, lipotoxicity and the metabolic syndrome—an allostatic perspective. Biochim Biophys Acta 2010;1801:338-49. Crossref
50. Chazenbalk G, Trivax BS, Yildiz BO, et al. Regulation of adiponectin secretion by adipocytes in the polycystic ovary syndrome: role of tumor necrosis factor-{alpha}. J Clin Endocrinol Metab 2010;95:935-42. Crossref
51. Barber TM, Franks S. Adipocyte biology in polycystic ovary syndrome. Mol Cell Endocrinol 2013;373:68-76. Crossref
52. Padmanabhan V, Manikkam M, Recabarren S, Foster D. Prenatal testosterone excess programs reproductive and metabolic dysfunction in the female. Mol Cell Endocrinol 2006;246:165-74. Crossref
53. Dumesic DA, Schramm RD, Abbott DH. Early origins of polycystic ovary syndrome. Reprod Fertil Dev 2005;17:349-60. Crossref
54. Legro RS, Bentley-Lewis R, Driscoll D, Wang SC, Dunaif A. Insulin resistance in the sisters of women with polycystic ovary syndrome: association with hyperandrogenemia rather than menstrual irregularity. J Clin Endocrinol Metab 2002;87:2128-33. Crossref
55. Hickey M, Sloboda DM, Atkinson HC, et al. The relationship between maternal and umbilical cord androgen levels and polycystic ovary syndrome in adolescence: a prospective cohort study. J Clin Endocrinol Metab 2009;94:3714-20. Crossref
56. Dumesic DA, Oberfield SE, Stener-Victorin E, Marshall JC, Laven JS, Legro RS. Scientific statement on the diagnostic criteria, epidemiology, pathophysiology, and molecular genetics of polycystic ovary syndrome. Endocr Rev 2015;36:487-525. Crossref
57. Hayes MG, Urbanek M, Ehrmann DA, et al. Genome-wide association of polycystic ovary syndrome implicates alterations in gonadotropin secretion in European ancestry populations. Nat Commun 2015;6:7502. Crossref
58. Boomsma CM, Eijkemans MJ, Hughes EG, Visser GH, Fauser BC, Macklon NS. A meta-analysis of pregnancy outcomes in women with polycystic ovary syndrome. Hum Reprod Update 2006;12:673-83. Crossref
59. Weerakiet S, Srisombut C, Rojanasakul A, Panburana P, Thakkinstian A, Herabutya Y. Prevalence of gestational diabetes mellitus and pregnancy outcomes in Asian women with polycystic ovary syndrome. Gynecol Endocrinol 2004;19:134-40. Crossref
60. Qin JZ, Pang LH, Li MJ, Fan XJ, Huang RD, Chen HY. Obstetric complications in women with polycystic ovary syndrome: a systematic review and meta-analysis. Reprod Biol Endocrinol 2013;11:56. Crossref
61. Chittenden BG, Fullerton G, Maheshwari A, Bhattacharya S. Polycystic ovary syndrome and the risk of gynaecological cancer: a systematic review. Reprod Biomed Online 2009;19:398-405. Crossref
62. Haoula Z, Salman M, Atiomo W. Evaluating the association between endometrial cancer and polycystic ovary syndrome. Hum Reprod 2012;27:1327-31. Crossref
63. Timmermans A, Opmeer BC, Khan KS, et al. Endometrial thickness measurement for detecting endometrial cancer in women with postmenopausal bleeding: a systematic review and meta-analysis. Obstet Gynecol 2010;116:160-7. Crossref
64. Sartor BM, Dickey RP. Polycystic ovarian syndrome and the metabolic syndrome. Am J Med Sci 2005;330:336-42. Crossref
65. Colilla S, Cox NJ, Ehrmann DA. Heritability of insulin secretion and insulin action in women with polycystic ovary syndrome and their first degree relatives. J Clin Endocrinol Metab 2001;86:2027-31. Crossref
66. Legro RS, Gnatuk CL, Kunselman AR, Dunaif A. Changes in glucose tolerance over time in women with polycystic ovary syndrome: a controlled study. J Clin Endocrinol Metab 2005;90:3236-42. Crossref
67. Boudreaux MY, Talbott EO, Kip KE, Brooks MM, Witchel SF. Risk of T2DM and impaired fasting glucose among PCOS subjects: results of an 8-year follow-up. Curr Diab Rep 2006;6:77-83. Crossref
68. Cheung LP, Ma RC, Lam PM, et al. Cardiovascular risks and metabolic syndrome in Hong Kong Chinese women with polycystic ovary syndrome. Hum Reprod 2008;23:1431-8. Crossref
69. Berneis K, Rizzo M, Lazzarini V, Fruzzetti F, Carmina E. Atherogenic lipoprotein phenotype and low-density lipoproteins size and subclasses in women with polycystic ovary syndrome. J Clin Endocrinol Metab 2007;92:186-9. Crossref
70. Phelan N, O’Connor A, Kyaw-Tun T, et al. Lipoprotein subclass patterns in women with polycystic ovary syndrome (PCOS) compared with equally insulin-resistant women without PCOS. J Clin Endocrinol Metab 2010;95:3933-9. Crossref
71. Valkenburg O, Steegers-Theunissen RP, Smedts HP, et al. A more atherogenic serum lipoprotein profile is present in women with polycystic ovary syndrome: a case-control study. J Clin Endocrinol Metab 2008;93:470-6. Crossref
72. Isomaa B, Almgren P, Tuomi T, et al. Cardiovascular morbidity and mortality associated with the metabolic syndrome. Diabetes Care 2001;24:683-9. Crossref
73. Weerakiet S, Bunnag P, Phakdeekitcharoen B, et al. Prevalence of the metabolic syndrome in Asian women with polycystic ovary syndrome: using the International Diabetes Federation criteria. Gynecol Endocrinol 2007;23:153-60. Crossref
74. Vgontzas AN, Legro RS, Bixler EO, Grayev A, Kales A, Chrousos GP. Polycystic ovary syndrome is associated with obstructive sleep apnea and daytime sleepiness: role of insulin resistance. J Clin Endocrinol Metab 2001;86:517-20. Crossref
75. Gopal M, Duntley S, Uhles M, Attarian H. The role of obesity in the increased prevalence of obstructive sleep apnea syndrome in patients with polycystic ovarian syndrome. Sleep Med 2002;3:401-4. Crossref
76. Wild S, Pierpoint T, McKeigue P, Jacobs H. Cardiovascular disease in women with polycystic ovary syndrome at long-term follow-up: a retrospective cohort study. Clin Endocrinol (Oxf) 2000;52:595-600. Crossref
77. Lo JC, Feigenbaum SL, Yang J, Pressman AR, Selby JV, Go AS. Epidemiology and adverse cardiovascular risk profile of diagnosed polycystic ovary syndrome. J Clin Endocrinol Metab 2006;91:1357-63. Crossref
78. Cibula D, Cifkova R, Fanta M, Poledne R, Zivny J, Skibova J. Increased risk of non-insulin dependent diabetes mellitus, arterial hypertension and coronary artery disease in perimenopausal women with a history of the polycystic ovary syndrome. Hum Reprod 2000;15:785-9. Crossref
79. Schmidt J, Landin-Wilhelmsen K, Brännström M, Dahlgren E. Cardiovascular disease and risk factors in PCOS women of postmenopausal age: a 21-year controlled follow-up study. J Clin Endocrinol Metab 2011;96:3794-803. Crossref
80. Shroff R, Kerchner A, Maifeld M, Van Beek EJ, Jagasia D, Dokras A. Young obese women with polycystic ovary syndrome have evidence of early coronary atherosclerosis. J Clin Endocrinol Metab 2007;92:4609-14. Crossref
81. Luque-Ramirez M, Mendieta-Azcona C, Alvarez-Blasco F, Escobar-Morreale HF. Androgen excess is associated with the increased carotid intima-media thickness observed in young women with polycystic ovary syndrome. Hum Reprod 2007;22:3197-203. Crossref
82. Talbott EO, Zborowski JV, Rager JR, Boudreaux MY, Edmundowicz DA, Guzick DS. Evidence for an association between metabolic cardiovascular syndrome and coronary and aortic calcification among women with polycystic ovary syndrome. J Clin Endocrinol Metab 2004;89:5454-61. Crossref
83. Boulman N, Levy Y, Leiba R, et al. Increased C-reactive protein levels in the polycystic ovary syndrome: a marker of cardiovascular disease. J Clin Endocrinol Metab 2004;89:2160-5. Crossref
84. Fauser BC, Tarlatzis BC, Rebar RW, et al. Consensus on women’s health aspects of polycystic ovary syndrome (PCOS): the Amsterdam ESHRE/ASRM-Sponsored 3rd PCOS Consensus Workshop Group. Fertil Steril 2012;97:28-38.e25. Crossref
85. Johnstone EB, Rosen MP, Neril R, et al. The polycystic ovary post-rotterdam: a common, age-dependent finding in ovulatory women without metabolic significance. J Clin Endocrinol Metab 2010;95:4965-72. Crossref
86. Dewailly D, Lujan ME, Carmina E, et al. Definition and significance of polycystic ovarian morphology: a task force report from the Androgen Excess and Polycystic Ovary Syndrome Society. Hum Reprod Update 2014;20:334-52. Crossref
87. Quinn MM, Kao CN, Ahmad A, et al. Raising threshold for diagnosis of polycystic ovary syndrome excludes population of patients with metabolic risk. Fertil Steril 2016;106:1244-51. Crossref
88. Conway G, Dewailly D, Diamanti-Kandarakis E, et al. The polycystic ovary syndrome: a position statement from the European Society of Endocrinology. Eur J Endocrinol 2014;171:P1-29. Crossref
89. Moran LJ, Noakes M, Clifton PM, Tomlinson L, Galletly C, Norman RJ. Dietary composition in restoring reproductive and metabolic physiology in overweight women with polycystic ovary syndrome. J Clin Endocrinol Metab 2003;88:812-9. Crossref
90. Moran LJ, Hutchison SK, Norman RJ, Teede HJ. Lifestyle changes in women with polycystic ovary syndrome. Cochrane Database Syst Rev 2011;(7):CD007506. Crossref
91. Pasquali R, Gambineri A, Pagotto U. The impact of obesity on reproduction in women with polycystic ovary syndrome. BJOG 2006;113:1148-59. Crossref
92. Diamanti-Kandarakis E, Baillargeon JP, Iuorno MJ, Jakubowicz DJ, Nestler JE. A modern medical quandary: polycystic ovary syndrome, insulin resistance, and oral contraceptive pills. J Clin Endocrinol Metab 2003;88:1927-32. Crossref
93. World Health Organization. Medical eligibility criteria for contraceptive use. 2015. Available from: http://apps.who.int/iris/bitstream/10665/181468/1/9789241549158_eng.pdf. Accessed 10 Jul 2017.
94. The Faculty of Sexual and Reproductive Healthcare of the Royal College of Obstetricians and Gynaecologists (FSRH). FSRH Statement: Venous thromboembolism (VTE) and hormonal contraception Nov 2014. Available from: https://www.fsrh.org/standards-and-guidance/documents/fsrhstatementvteandhormonalcontraception-november/. Accessed 10 Jul 2017.
95. National Institute for Health and Care Excellence. Fertility problems: assessment and treatment. 20 Feb 2013. Available from: https://www.nice.org.uk/guidance/cg156. Accessed 10 Jul 2017.
96. Jayasena CN, Franks S. The management of patients with polycystic ovary syndrome. Nat Rev Endocrinol 2014;10:624-36. Crossref
97. Lord JM, Flight IH, Norman RJ. Metformin in polycystic ovary syndrome: systematic review and meta-analysis. BMJ 2003;327:951-3. Crossref
98. Legro RS, Barnhart HX, Schlaff WD, et al. Clomiphene, metformin, or both for infertility in the polycystic ovary syndrome. N Engl J Med 2007;356:551-66. Crossref
99. Moll E, van der Veen F, van Wely M. The role of metformin in polycystic ovary syndrome: a systematic review. Hum Reprod Update 2007;13:527-37. Crossref
100. Legro RS, Brzyski RG, Diamond MP, et al. Letrozole versus clomiphene for infertility in the polycystic ovary syndrome. N Engl J Med 2014;371:119-29. Crossref
101. Thessaloniki ESHRE/ASRM-Sponsored PCOS Consensus Workshop Group. Consensus on infertility treatment related to polycystic ovary syndrome. Hum Reprod 2008;23:462-77. Crossref
102. Kong GW, Cheung LP, Lok IH. Effects of laparoscopic ovarian drilling in treating infertile anovulatory polycystic ovarian syndrome patients with and without metabolic syndrome. Hong Kong Med J 2011;17:5-10.
103. Ma RC, Liu KH, Lam PM, et al. Sonographic measurement of mesenteric fat predicts presence of fatty liver among subjects with polycystic ovary syndrome. J Clin Endocrinol Metab 2011;96:799-807. Crossref
104. Naderpoor N, Shorakae S, de Courten B, Misso ML, Moran LJ, Teede HJ. Metformin and lifestyle modification in polycystic ovary syndrome: systematic review and meta-analysis. Hum Reprod Update 2015;21:560-74. Crossref
105. Skubleny D, Switzer NJ, Gill RS, et al. The impact of bariatric surgery on polycystic ovary syndrome: a systematic review and meta-analysis. Obes Surg 2016;26:169-76. Crossref

Childhood lead poisoning: an overview

Hong Kong Med J 2017 Dec;23(6):616–21 | Epub 13 Oct 2017
DOI: 10.12809/hkmj176214
© Hong Kong Academy of Medicine. CC BY-NC-ND 4.0
 
REVIEW ARTICLE
Childhood lead poisoning: an overview
KL Hon, MD, FAAP1; CK Fung, MB, ChB2; Alexander KC Leung, FRCP(UK), FRCPCH3
1 Department of Paediatrics, Prince of Wales Hospital, The Chinese University of Hong Kong, Shatin, Hong Kong
2 Department of Anatomical and Cellular Pathology, United Christian Hospital, Kwun Tong, Hong Kong
3 Department of Pediatrics, Alberta Children’s Hospital, University of Calgary, Calgary, Alberta, Canada
 
Corresponding author: Prof KL Hon (ehon@cuhk.edu.hk)
 
 Full paper in PDF
 
Abstract
Childhood lead poisoning is a major public health concern in many countries. In 2015, the Hong Kong SAR Government and its citizens faced a major public health crisis due to the presence of lead in the drinking water of a number of public housing estates. Fortunately, no child was diagnosed with lead poisoning that required treatment with chelation. Lead is a ubiquitous, naturally occurring material that exists in air, dust, soil, and water. It is also widely present in industrial products including petrol, paints, ceramics, food cans, candies, cosmetics, traditional remedies, batteries, solder, stained glass, crystal vessels, ammunition, ceramic glazes, jewellry, and toys. It can also be found in human milk. There is no safe blood lead level and it may be impossible to completely eliminate lead from any city. Hence routine measurement of blood lead levels is not considered useful. Acute poisoning, especially with encephalopathy, deserves immediate medical treatment in hospital. Chelation therapy is recommended if blood lead level is 45 µg/dL or higher. For blood levels between 20 and 45 µg/dL, treatment is indicated if the child is symptomatic. For blood levels below 20 µg/dL in otherwise asymptomatic children, the principle of treatment is to provide long-term neurodevelopmental follow-up and counselling. In all cases, immediate removal of the source of lead exposure is vital. Even low levels of lead exposure can significantly impair learning, educational attainment, and neurodevelopment.


Introduction
Childhood lead poisoning is a major public health concern in many countries as it may result in serious health consequences. In general, children absorb a greater percentage of lead from the gastrointestinal tract than adults.1 2 Fasting, iron deficiency, and calcium deficiency may further increase gastrointestinal absorption of lead.1 2 In Hong Kong, food safety has become a major public concern in recent years. In 2015, the Hong Kong SAR Government and its citizens faced a major public health crisis due to the presence of lead in the drinking water of a number of public housing estates. Fortunately, no child was diagnosed with lead poisoning and hence did not require chelation therapy.
 
This review discusses the possible sources of lead exposure and poisoning in children, public health implications, medical management, and neurodevelopmental outcomes with a focus on the situation in Hong Kong. References were searched in January 2017 using keywords: ((“toxicity”) OR (“poisoning”) AND “lead”) AND ((“lead toxicity”) OR (“lead poisoning”) AND “Hong Kong”) in PubMed, limited to ‘human’, with no filters for article type or date of publication. Discussion is based on, but not limited to, the search results.
 
Possible sources of lead exposure and poisoning in children
According to the World Health Organization, lead is a ubiquitous, naturally occurring material that exists in air, dust, soil, and water. It is also widely present in industrial products including petrol, paints, ceramics, food cans, candies, cosmetics, traditional remedies, batteries, solder, stained glass, crystal vessels, ammunition, ceramic glazes, jewellry, and toys.3 4 5 6 7 It is also found in human breast milk.8 In the US, lead-containing paint in old houses is one of the main sources of lead exposure or poisoning in children. In many industrialising countries including China, smelters, refineries, mines, soil contamination, and use of lead gasoline are important sources of lead exposure.
 
Water supply can be contaminated with lead.9 10 11 12 A recent example is the drinking water crisis that occurred in the post-industrial city of Flint in Michigan, US.11 In this situation, lead in drinking water is absorbed to a greater extent than lead in food and may account for more than 50% of the lead ingested by children.13 The US Environmental Protection Agency recommended taking actions when lead in drinking water exceeds 15 parts per billion, including taking further steps to optimise their corrosion-control treatment (for water systems serving 50 000 people who have not fully optimised their corrosion control), educating the public about lead in drinking water and actions consumers can take to reduce their exposure to lead, replacing the portions of lead service lines (lines that connect distribution mains to customers) under the water system’s control.14 Most incidents of lead contamination of household water were caused by copper plumbing with lead solder. Occasionally, lead pipes may also be responsible although they are now rarely used.
 
No review article about lead toxicity in Hong Kong was found on MEDLINE/PubMed at the time of writing. Nevertheless discrete reports from different institutes about local lead toxicity are available, with the earliest report dated 1969, when 121 Gurkha soldiers investigated for ‘epidemic myalgia’ were found to have lead poisoning due to curry powder contaminated with lead chromate.5 Later in 1977, a 4-month-old girl presented with a grand mal seizure after ingestion of Chinese herbal medicines containing lead.3 In 1991, a case of acute lead poisoning with cerebral oedema and death was reported in a 2-month-old girl.15 Two other case reports described a total of four adult patients who had lead poisoning following ingestion of two different Chinese herbal pills. They had variable clinical presentations ranging from relatively asymptomatic to end-organ complications.16 17 In 2014, a middle-aged woman who presented with motor neuron disease was found to have a raised blood lead level after consumption of ashes from burnt Chinese talismans (Dao religious handwriting believed to have the power to expel evil).18 Hong Kong is a commercialised city with very few industries and factories. The main sources of lead are contaminated food, toys, adulterated medicines, traditional remedies, and batteries. A study of children with eczema revealed that disease severity and quality of life correlated with blood lead level, and patients who had used traditional herbal remedies generally had a higher blood lead level.19 Contaminated water in public housing estates was first described in 2015 in Hong Kong.20
 
Potential public health implications
There is no screening programme for lead or other heavy metals in Hong Kong. Guidelines about lead screening, however, are available worldwide. In 2013, nearly 30 questionnaires were available, designed as a preliminary screening tool for paediatric lead poisoning. They showed variable sensitivity and specificity based on systematic reviews.21 22 According to the latest guideline in 2012 from the Centers for Disease Control and Prevention (CDC)’s Advisory Committee on Childhood Lead Poisoning Prevention (ACCLPP), clinicians should perform an environmental assessment before screening children for lead poisoning.13 23 This changed the practice of universal screening of all children for elevated blood lead levels2 23 24 to targeted screening after mathematical simulations suggested that such screening among 1-year-old children may not be cost-effective, especially in communities with a lower prevalence of lead poisoning.25 At the same time, with reference to the level of ‘lead toxicity’ in children, ACCLPP eliminated the term ‘level of concern’ for blood lead level (previously defined as 10 µg/dL) and replaced it with a reference level of 5 µg/dL, based on the 97.5th percentile of the population blood lead level in children aged between 1 and 5 years.2 13 24 This was supported by the American Academy of Pediatrics who acknowledged that even the lowest degree of lead exposure might harm children,13 23 26 and echoed the European Food Safety Authority who concluded that there is no known safe exposure to lead as evidenced by international studies in Europe.27 28 29 In other words, there is no safe or ‘non-toxic’ blood lead level.
 
A systematic review of the effectiveness of interventions to reduce lead exposure from consumer products and drinking water in Germany concluded that the limited quantity and quality of the evidence derived from measuring blood lead level and associated health outcomes suggested an urgent need for more robust research into the effectiveness of interventions to reduce lead exposure from consumer products and drinking water, especially for regulatory interventions.6 The dilemma is that there is no safe lead level, and it is impossible to completely eliminate lead from any city. Hence routine measurement of blood lead level is not considered useful for management.
 
Clinical manifestations/complications of lead poisoning
Lead is a potent neurotoxin. Neurotoxicity is more prominent in children and infants in-utero than in adults because of the incomplete blood-brain barrier.8 30 31 Despite this, the majority of children with lead poisoning is asymptomatic. Neurological manifestations/complications of lead poisoning include acute encephalopathy, peripheral neuropathy, hearing loss, and neurobehavioural deficits such as hyperactivity, withdrawal, developmental delay, lower intelligence quotient, higher academic failure, and lower overall life achievements.32 33 34 Meta-analysis of 19 studies with a total of 8561 children suggested that lead exposure is positively related to conduct problems.35 The causal effect of lead exposure on these behavioural problems, however, cannot be proven as poor housing, poverty, and other stressors are significant confounding factors.36 According to the American Academy of Neurology, the clinical correlation of mildly elevated but non-toxic levels of blood lead with developmental status remains controversial.
 
Lead lines at the junction of the gums and teeth, if present, suggest severe and prolonged lead exposure. Other clinical manifestations/complications include colicky abdominal pain, constipation, growth retardation, vitamin D deficiency, anaemia, and nephropathy.1 2 24 Rarely, lead poisoning may also lead to hypertension, immunodeficiency, osteoporosis, changes in serum level of sex hormones and thyroid hormones, premature delivery, pre-eclampsia, infertility, and malignancy.30 37 38
 
Exposure versus poisoning
Despite the potential harmful effects of lead on humans, lead exposure is not synonymous with lead toxicity. According to the Agency for Toxic Substances and Disease Registry, exposure is defined as contact with a substance by swallowing, breathing, or touching the skin or eyes. Exposure may be short-term (acute exposure), of intermediate duration, or long-term (chronic exposure). A toxic agent is a chemical or physical (eg radiation, heat, cold, microwaves) agent that, under certain circumstances of exposure, can cause harmful effects to living organisms (https://www.atsdr.cdc.gov/glossary.html). In other words, it is the lead toxicity per se not lead exposure that necessitates treatment. Although there is no definitive toxic level for blood lead, the affected child should be continuously monitored to ensure medical intervention if necessary.
 
Screening of children for lead poisoning
The American Academy of Neurology suggests screening of children with developmental delay for lead toxicity. This should target those with known identifiable risk factors for excessive lead exposure, including children aged 1 to 2 years living in housing built before 1950, exposure to lead-containing folk remedies, child immigrants from countries where lead poisoning is prevalent, children with iron deficiency, children with developmental delay with pica disorder, victims of neglect, and children of low-income families.39
 
The CDC’s ACCLPP has updated its guidelines for blood lead screening among children eligible for Medicaid by providing recommendations to improve screening and information for health care providers, state officials, and others interested in lead-related services for Medicaid-eligible children.40 Because state and local officials are more familiar than federal agencies with local risks for elevated blood lead levels, the CDC recommends that state and local officials have the flexibility to develop blood lead screening strategies that reflect local risk. Rather than provision of universal screening to all Medicaid children, which was previously recommended, state and local officials should target screening towards specific groups of children in their area at higher risk. The updated CDC recommendations provide strategies to (1) improve screening rates of children at risk of an elevated blood lead level, (2) develop surveillance policies that are not solely dependent on blood lead level testing, and (3) assist states with evaluation of screening plans.
 
Neurocognitive impairment in children is a grave concern as it may be irreversible. The current policy in Hong Kong is to perform lead exposure risk assessment in citizens with a borderline raised blood lead level, and carry out developmental assessment in affected children under the age of 12 years, while continuously monitoring all citizens with raised blood lead levels. The threshold for further management for children under 18 years, pregnant women, and lactating mothers is lower than that for the general adult population. This strategy correlates with the targeted screening promoted by the ACCLPP.
 
Medical management protocol for childhood lead poisoning
The protocol of management according to blood lead level, adopted from ‘Care plan for residents of public estates with elevated lead level in drinking water’, was last updated on 28 August 2015 by the Centre for Health Protection, Hong Kong SAR.41
 
Management of patients with lead exposure involves not only the pharmacological management of toxicity, but also strategies for intervention and prevention of further exposure. Once an elevated lead level is found, the local health department should be notified and a home risk assessment performed to determine the need for abatement strategies. With the gradual lowering of the ‘blood lead level of concern’ by the CDC, the threshold for action has also decreased. The Pediatric Environmental Health Specialty Units have made recommendations for further evaluation and/or intervention based on the blood lead level.42
 
In all cases, identification and immediate removal of the source of lead exposure from the child’s environment is crucial to the successful management of the patient. Medical treatment of lead poisoning is relatively straightforward.40 43 44 45 46 There is no benefit in prescribing activated charcoal for lead ingestion since it binds lead poorly. Gastric lavage may be performed although the American Academy of Clinical Toxicology stated that there is no evidence to show that its use improves clinical outcome. Whole bowel irrigation has a theoretical benefit for decontamination of heavy metal ingestion but there are insufficient data at present to support or exclude its use.
 
For blood lead level between 20 and 45 µg/dL, the minimum medical management for children is to decrease their exposure to all sources of lead, to correct any iron deficiency and maintain an adequate calcium intake, and to test frequently to ensure that the child’s blood lead levels are decreasing. Although not approved by the CDC, some clinicians prescribe D-penicillamine for children within this range of blood lead level. Otherwise the patient should have a confirmatory venous blood lead level measured within 1 to 4 weeks as a venous sample is subjected to less contamination than a capillary one. A capillary blood sampling protocol has also been documented by the CDC, and is more practical than venous blood sampling, especially in infants. For blood lead level of <20 µg/dL in otherwise asymptomatic children, the principle of treatment is to provide long-term neurodevelopmental follow-up and counselling as well as periodic blood sampling to ensure lead level is not increasing and to continue until the level is <5 µg/dL.40 43 44 45 46 For symptomatic patients with blood lead level of <20 µg/dL, sequential measurements of blood lead level along with review of the child’s clinical status should be done at least every 3 months. Iron deficiency should be treated promptly. Children with blood lead levels in this range should be referred for environmental investigation and management. Identifying and eradicating all sources of excessive lead exposure is the most important intervention for decreasing blood lead levels.
 
Chelation therapy is recommended if the patient has a blood lead level of ≥45 µg/dL. Before starting therapy, the blood lead measurement must be repeated immediately for confirmation but treatment should not be delayed while awaiting the result if encephalopathy is suspected. Chelation therapy, especially in the setting of encephalopathy, can be complicated. The patient must be admitted to a hospital with at least a physician who has proficiency with chelation therapy and management of childhood lead poisoning. The decision as to which agent should be used depends on the blood lead level, the symptomatology, and the environmental lead burden. Intravenous fluids should be given if necessary to ensure adequate urine output to permit chelation and excretion of lead in the body.2 47 Fluid intake and output should be monitored to permit early detection of inappropriate antidiuretic hormone secretion.
 
Succimer (dimercaptosuccinic acid) is a water-soluble, oral chelating agent that is appropriate for asymptomatic children with a blood lead level of 45 to 69 µg/dL. The recommended dose is 10 mg/kg or 350 mg/m2 three times per day.47 D-penicillamine is a second-line oral chelating agent because of its potential for significant side-effects (thromobocytopenia, leukopaenia, urticaria, angioedema, abnormal liver function, Stevens-Johnson syndrome, and nephrotic syndrome).47
 
Calcium disodium edetate (CaNa2 EDTA) is a chelating agent that is preferably given by continuous intravenous infusion. The recommended dose is 35 to 50 mg/kg/day or 1000 to 1500 mg/m2/day.47 It should not be used as the sole agent in patients who manifest features of lead encephalopathy, because it does not cross the blood-brain barrier and can potentially lead to exacerbation of lead encephalopathy. Rather, dimercaprol (also referred to as British anti-Lewisite), which does cross the blood-brain barrier, should be used in combination with CaNa2 EDTA. Dimercaprol is a parenteral chelating agent of choice for patients with lead encephalopathy; the recommended dose is 3 to 5 mg every 4 hours given by deep intramuscular injection. Combination therapy with CaNa2 EDTA and dimercaprol or succimer should be instituted in symptomatic children with blood lead level of 45 to 69 µg/dL.2 47 Children whose blood lead level is ≥70 µg/dL should be treated as medical emergencies, preferably with intravenous therapy. A combination of intramuscular dimercaprol and intravenous CaNa2 EDTA should be used for children with blood lead level of 70 to 99 µg/dL if there are features of lead encephalopathy or with a blood lead level of ≥100 µg/dL even in the absence of features of lead encephalopathy. Features of lead encephalopathy include persistent lethargy, persistent vomiting, headache, afebrile seizures, or coma.
 
Chelation therapy has its own limitations. With chronic lead ingestion, lead can be incorporated into the skeletal system and can be an endogenous reservoir of lead exposure that is hard to eliminate.2 47
 
Neurodevelopmental outcomes: who and for how long should at-risk children be monitored?
Lead poisoning in childhood produces long-term problems with learning, intelligence, and earning power.48 Asymptomatic lead poisoning has a far better prognosis. Given that there is no safe blood lead level, the CDC stresses the importance of regular follow-up of children with elevated blood lead levels. A monitoring programme should include nutritional support (such as ensuring sufficient intake of calcium, vitamin D, vitamin C) to minimise lead absorption, preventive measures to avoid household lead exposure, and education of caregivers about sources of lead exposure, prevention of exposure, and ways to decrease intestinal absorption.40 44 45 46 Affected children should be followed up continuously at least until environmental sources of lead have been identified and eliminated, and thereafter until blood lead level has declined to <15 µg/dL for at least 6 months, while other objectives of the management plan are achieved. Long-term neurodevelopmental monitoring is also advised after a case is closed, in view of many of the neurological deficits that manifest late in life. Any surveillance should be continued until a child reaches 6 years of age, an age of critical learning transition points and elevated risk exposure, although the definitive duration of follow-up is unclear.40 43 44 45 46 Likewise, no end-point of follow-up is recommended by the Centre of Health Protection in Hong Kong.
 
Conclusion
It has been established that even low-level lead exposure can significantly impair the learning and educational attainment and neurodevelopment of a child.49 50 51 52 53 54 In-utero exposure to lead can adversely affect the infant’s neurodevelopment, independent of postnatal blood lead level. With no safe limit of blood lead level, rigorously reducing the amount of lead in the environment is imperative for young children and unborn babies.13
 
Declaration
All authors have disclosed no conflicts of interest.
 
References
1. Lowry JA. Childhood lead poisoning: clinical manifestations and diagnosis. Available from: https://www.uptodate.com/contents/childhood-lead-poisoning-clinical-manifestations-and-diagnosis. Accessed 2 Jan 2017.
2. Centers for Disease Control (CDC). Preventing lead poisoning in young children—United States. MMWR Morb Mortal Wkly Rep 1985;34:66-8,73.
3. Chan H, Billmeier GJ Jr, Evans WE, Chan H. Lead poisoning from ingestion of Chinese herbal medicine. Clin Toxicol 1977;10:273-81. Crossref
4. Chui SH, Wong YH, Chio HI, et al. Study of heavy metal poisoning in frequent users of Chinese medicines in Hong Kong and Macau. Phytother Res 2013;27:859-63. Crossref
5. Power JG, Barnes RM, Nash WN, Robinson JD. Lead poisoning in Gurkha soldiers in Hong Kong. Br Med J 1969;3:336-7. Crossref
6. Pfadenhauer LM, Burns J, Rohwer A, Rehfuess EA. Effectiveness of interventions to reduce exposure to lead through consumer products and drinking water: a systematic review. Environ Res 2016;147:525-36. Crossref
7. Gorospe EC, Gerstenberger SL. Atypical sources of childhood lead poisoning in the United States: a systematic review from 1966-2006. Clin Toxicol (Phila) 2008;46:728-37. Crossref
8. Koyashiki GA, Paoliello MM, Tchounwou PB. Lead levels in human milk and children’s health risk: a systematic review. Rev Environ Health 2010;25:243-53. Crossref
9. Falta RW, Bulsara N, Henderson JK, Mayer RA. Leaded-gasoline additives still contaminate groundwater. Environ Sci Technol 2005;39:379A-384A. Crossref
10. Peplow D, Edmonds R. Health risks associated with contamination of groundwater by abandoned mines near Twisp in Okanogan County, Washington, USA. Environ Geochem Health 2004;26:69-79. Crossref
11. Hanna-Attisha M, LaChance J, Sadler RC, Champney Schnepp A. Elevated blood lead levels in children associated with the flint drinking water crisis: a spatial analysis of risk and public health response. Am J Public Health 2016;106:283-90. Crossref
12. Brown MJ, Margolis S. Lead in drinking water and human blood lead levels in the United States. MMWR Suppl 2012;61:1-9.
13. Schnur J, John RM. Childhood lead poisoning and the new Centers for Disease Control and Prevention guidelines for lead exposure. J Am Assoc Nurse Pract 2014;26:238-47. Crossref
14. Basic information about lead in drinking water. Available from: https://www.epa.gov/ground-water-and-drinking-water/basic-information-about-lead-drinking-water. Accessed 1 Aug 2017.
15. Wong VC, Ng TH, Yeung CY. Electrophysiologic study in acute lead poisoning. Pediatr Neurol 1991;7:133-6. Crossref
16. Auyeung TW, Chang KK, To CH, Mak A, Szeto ML. Three patients with lead poisoning following use of a Chinese herbal pill. Hong Kong Med J 2002;8:60-2.
17. Fung HT, Fung CW, Kam CW. Lead poisoning after ingestion of home-made Chinese medicines. Emerg Med (Fremantle) 2003;15:518-20. Crossref
18. Chan CK, Ching CK, Lau FL, Lee HK. Chinese talismans as a source of lead exposure. Hong Kong Med J 2014;20:347-9. Crossref
19. Hon KL, Ching GK, Hung EC, Leung TF. Serum lead levels in childhood eczema. Clin Exp Dermatol 2009;34:e508-9. Crossref
20. Lee WL, Jia J, Bao Y. Identifying the gaps in practice for combating lead in drinking water in Hong Kong. Int J Environ Res Public Health 2016;13.pii:E970. Crossref
21. Ossiander EM. A systematic review of screening questionnaires for childhood lead poisoning. J Public Health Manag Pract 2013;19:E21-9. Crossref
22. Burns MS, Shah LH, Marquez ER, et al. Efforts to identify at-risk children for blood lead screening in pediatric clinics—Clark County, Nevada. Clin Pediatr (Phila) 2012;51:1048-55. Crossref
23. Council on Environmental Health. Prevention of childhood lead toxicity. Pediatrics 2016;138.pii:e20161493.
24. Preventing lead poisoning in young children. A statement by the Center for Disease Control. J Pediatr 1978;93:709-20. Crossref
25. Rolnick SJ, Nordin J, Cherney LM. A comparison of costs of universal versus targeted lead screening for young children. Environ Res 1999;80:84-91. Crossref
26. Vorvolakos T, Arseniou S, Samakouri M. There is no safe threshold for lead exposure: a literature review. Psychiatriki 2016;27:204-14.
27. EFSA Panel on Contaminants in the Food Chain (CONTAM). Scientific opinion on lead in food. EFSA J 2010;8:1570. Crossref
28. Budtz-Jorgensen E, Bellinger D, Lanphear B, Grandjean P; International Pooled Lead Study Investigators. An international pooled analysis for obtaining a benchmark dose for environmental lead exposure in children. Risk Anal 2013;33:450-61. Crossref
29. Grandjean P. Even low-dose lead exposure is hazardous. Lancet 2010;376:855-6. Crossref
30. Abadin H, Ashizawa A, Stevens YW, et al. Toxicological profile for lead. Atlanta (GA): Agency for Toxic Substances and Disease Registry (US); 2007 Aug.
31. Allen KA. Is prenatal lead exposure a concern in infancy? What is the evidence? Adv Neonatal Care 2015;15:416-20. Crossref
32. Evens A, Hryhorczuk D, Lanphear BP, et al. The impact of low-level lead toxicity on school performance among children in the Chicago Public Schools: a population-based retrospective cohort study. Environ Health 2015;14:21. Crossref
33. Leung AK, Hon KL. Attention-deficit/hyperactivity disorder. Adv Pediatr 2016;63:255-80. Crossref
34. Magzamen S, Imm P, Amato MS, et al. Moderate lead exposure and elementary school end-of-grade examination performance. Ann Epidemiol 2013;23:700-7. Crossref
35. Marcus DK, Fulton JJ, Clarke EJ. Lead and conduct problems: a meta-analysis. J Clin Child Adolesc Psychol 2010;39:234-41. Crossref
36. Chen A, Cai B, Dietrich KN, Radcliffe J, Rogan WJ. Lead exposure, IQ, and behavior in urban 5- to 7-year-olds: does lead affect behavior only by lowering IQ? Pediatrics 2007;119:e650-8. Crossref
37. Mohammed AA, Mohamed FY, El-Okda el-S, Ahmed AB. Blood lead levels and childhood asthma. Indian Pediatr 2015;52:303-6. Crossref
38. Kennedy DA, Woodland C, Koren G. Lead exposure, gestational hypertension and pre-eclampsia: a systematic review of cause and effect. J Obstet Gynaecol 2012;32:512-7. Crossref
39. Shevell M, Ashwal S, Donley D, et al. Practice parameter: evaluation of the child with global developmental delay: report of the Quality Standards Subcommittee of the American Academy of Neurology and The Practice Committee of the Child Neurology Society. Neurology 2003;60:367-80. Crossref
40. Wengrovitz AM, Brown MJ; Advisory Committee on Childhood Lead Poisoning, Division of Environmental and Emergency Health Services, National Center for Environmental Health; Centers for Disease Control and Prevention. Recommendations for blood lead screening of Medicaid-eligible children aged 1-5 years: an updated approach to targeting a group at high risk. MMWR Recomm Rep 2009;58(RR-9):1-11.
41. Care plan for residents of public estates with elevated lead level in drinking water. Available from: http://www.chp.gov.hk/files/pdf/care_plan_for_raised_bll.pdf. Accessed 1 Aug 2017.
42. Dapul H, Laraque D. Lead poisoning in children. Adv Pediatr 2014;61:313-33. Crossref
43. Woolf AD, Goldman R, Bellinger DC. Update on the clinical management of childhood lead poisoning. Pediatr Clin North Am 2007;54:271-94, viii. Crossref
44. Advisory Committee on Childhood Lead Poisoning Prevention (ACCLPP). Recommendations for blood lead screening of young children enrolled in medicaid: targeting a group at high risk. MMWR Recomm Rep 2000;49(RR-14):1-13.
45. Binns HJ, Campbell C, Brown MJ; Centers for Disease Control and Prevention Advisory Committee on Childhood Lead Poisoning Prevention. Interpreting and managing blood lead levels of less than 10 microg/dL in children and reducing childhood exposure to lead: recommendations of the Centers for Disease Control and Prevention Advisory Committee on Childhood Lead Poisoning Prevention. Pediatrics 2007;120:e1285-98. Crossref
46. Centers for Disease Control and Prevention (CDC) Advisory Committee on Childhood Lead Poisoning Prevention. Interpreting and managing blood lead levels <10 microg/dL in children and reducing childhood exposures to lead: recommendations of CDC’s Advisory Committee on Childhood Lead Poisoning Prevention. MMWR Recomm Rep 2007;56(RR-8):1-16.
47. Lowry JA. Childhood lead poisoning: management. Available from: https://www.uptodate.com/contents/childhood-lead-poisoning-management. Accessed 2 Jan 2017.
48. Kathuria P. Lead toxicity. Prognosis. Available from: http://emedicine.medscape.com/article/1174752-overview#a6. Accessed 1 Aug 2017.
49. Lanphear BP, Dietrich K, Auinger P, Cox C. Cognitive deficits associated with blood lead concentrations <10 microg/dL in US children and adolescents. Public Health Rep 2000;115:521-9.
50. Canfield RL, Henderson CR Jr, Cory-Slechta DA, Cox C, Jusko TA, Lanphear BP. Intellectual impairment in children with blood lead concentrations below 10 microg per deciliter. N Engl J Med 2003;348:1517-26. Crossref
51. Jusko TA, Henderson CR, Lanphear BP, Cory-Slechta DA, Parsons PJ, Canfield RL. Blood lead concentrations <10 microg/dL and child intelligence at 6 years of age. Environ Health Perspect 2008;116:243-8. Crossref
52. Chiodo LM, Jacobson SW, Jacobson JL. Neurodevelopmental effects of postnatal lead exposure at very low levels. Neurotoxicol Teratol 2004;26:359-71. Crossref
53. Amato MS, Moore CF, Magzamen S, et al. Lead exposure and educational proficiency: moderate lead exposure and educational proficiency on end-of-grade examinations. Ann Epidemiol 2012;22:738-43. Crossref
54. Zhang N, Baker HW, Tufts M, Raymond RE, Salihu H, Elliott MR. Early childhood lead exposure and academic achievement: evidence from Detroit public schools, 2008-2010. Am J Public Health 2013;103:e72-7. Crossref

Cancer screening for older people: to screen or not to screen

Hong Kong Med J 2017 Oct;23(5):503–16 | Epub 1 Sep 2017
DOI: 10.12809/hkmj166154
© Hong Kong Academy of Medicine. CC BY-NC-ND 4.0
 
REVIEW ARTICLE
Cancer screening for older people: to screen or not to screen
Claudia KY Lai, PhD, RN1; Ayumi Igarashi, PhD, RN2; Natalie MY Lau, MN, BA1; Clare TK Yu, BSc1
1 School of Nursing, The Hong Kong Polytechnic University, Hunghom, Hong Kong
2 School of Health Sciences and Nursing, Graduate School of Medicine, The University of Tokyo, Tokyo, Japan
 
Corresponding author: Dr Claudia KY Lai (claudia.lai@polyu.edu.hk)
 
 
 Full paper in PDF
 
Abstract
In this scoping review, the evidence of the benefits of screening older people for the five most common types of cancer in Hong Kong, namely colorectal, lung, breast, liver, and prostate cancers, is discussed. Although cancer treatments can be extensive and a good prognosis is less likely if cancer is diagnosed at a late stage, screening programmes for older people in primary care remain a matter of contention. The general recommendation for the screening of older people is to adopt an individualised approach that takes account of not only age but also co-morbidity, life expectancy, harms and benefits, and patient’s preference.


Introduction
Cancer, a word that evokes fear in most people, is the second leading cause of death worldwide; 8.8 million of deaths due to cancer are estimated to have occurred in 2015.1 Globally, the most common types of cancer are lung, breast, bowel, and prostate.2 In Hong Kong, the five leading types of cancer (combining both males and females) are, in order of incidence, colorectal, lung, breast, liver, and prostate cancers.3 Because the incidence of cancer increases with age, early detection can help reduce the burden of treatment and is more likely to lead to a better outcome if the cancer is adequately treated. Although there are guidelines on the recommended ages at which to begin screening for different types of cancer, there is less guidance on the screening needs of older adults.4
 
Controversies over cancer screening for older people
Cancer screening for early detection is promoted globally because of the link between an ageing population and an increase in the prevalence of cancer worldwide, on the supposition that this will improve the prognosis of cancer patients and may therefore be beneficial for older people.5 Of note, 33 countries have joined the International Cancer Screening Network and are participating in active population-based screening programmes for breast, colorectal, cervical, and lung cancers.6 There are practice guidelines recommending the ages at which to start screening for various types of cancer, but there is less information about when to cease screening, specifically in older people. Epidemiological studies of cancer in people aged 70 years or older are rarely reported in the literature; even if there are such studies, only subgroup analyses are found.7 The efficacy of screening older people for cancer remains controversial. Even though cancer rates have increased with age, this does not imply that routine cancer screening is recommended or even appropriate for older people.8
 
The aims of this review were to examine the evidence regarding screening for cancer in older people and to present an overview of the current state of knowledge about controversies and recommendations with regard to screening for the top five most common kinds of cancer in older people in Hong Kong.
 
Methods
A scoping review was conducted to explicate current discussions of recommendations for screening older adults for cancer. A scoping review was deemed to be appropriate because it is often used to address broad topics, the literature on which may include studies with numerous designs. The approach described by Arksey and O’Malley was adopted.9
 
The databases of MEDLINE, EMBASE, the Web of Science, the Cochrane Library, CINAHL, and SCOPUS were searched using the following strategies:
• Strategy 1—(Elder*) and (Cancer screening or cancer prevention) and (Mortality or morbidity)
• Strategy 2—(Elder*) and (Cancer screening or cancer prevention) and (Effect or efficacy or effective*)
 
Searches were conducted for studies in which the population was restricted to those aged 65 years or above. The search fields included abstracts and titles, studies written in English, and studies published in the last 10 years only (January 2007 to April 2017). We included only studies that evaluated screening for five types of cancer (colorectal, lung, breast, liver, and prostate). Studies that employed retrospective data analysis, simulation modelling, and observational, experimental (randomised controlled trials [RCTs]) or uncontrolled clinical trials were included. Systematic reviews were also included, but discussion papers that did not describe the process by which the database searches were conducted were excluded. Articles that discussed knowledge or attitudes to cancer screening and surveillance monitoring were also excluded.
 
Three members of the team screened all of the titles of the papers that were retrieved; papers that were considered irrelevant were discarded. Next, irrelevant papers were also excluded after the abstract and/or the full paper had been reviewed. At least two members independently read the full text of all of the papers that were potentially relevant and selected those that met the criteria for inclusion. The final selection of papers was achieved through a series of virtual online discussions that continued until a consensus was reached.
 
Other reports relevant to the topic found or cited in text in the reviewed papers were also included. As a result, 13 papers were added to the 23 papers from the scoping search. A total of 36 papers were included for review, with 13, 3, 14, 1, and 10 papers that concerned the screening of colorectal, lung, breast, liver, and prostate cancers, respectively (Fig). Three of the papers examined the evidence of more than one type of cancer and have therefore been included in different sections for review purposes. Recommendations for screening guidelines from national institutes or professional associations have also been included in each section after discussion of the reviewed papers. In the papers being reviewed, ‘benefit’ in screening is defined as early detection, survival, or reduced risk in mortality or co-morbidity; ‘harm’ is defined as mortality (death due to the specific type of cancer under investigation), false-positive and false-negative test results, or overdiagnosis.
 

Figure. Study flow diagram
 
Colorectal cancer screening
The faecal occult blood test (FOBT), barium enema, sigmoidoscopy, and colonoscopy are used to screen for colorectal cancer.4 10 Quarini and Gosney11 reviewed all available articles on colorectal cancer screening in MEDLINE from 1990 to 2007. They found limited evidence relating to the screening of older people.11
 
In a recent population-based simulation study, Meester et al12 analysed the number of deaths from colorectal cancer that were attributable to non-screening in the US; most such deaths were attributable to non-screening. Similar findings have been reported in Germany where screening colonoscopy has been offered since 2002. Brenner et al13 14 used simulation modelling based on Germany’s national data and found that screening colonoscopies have great potential in the prevention and early detection of colorectal cancer, with a low risk of over-diagnosis. Moreover, the majority of prevented cases would have occurred at the age of 75 years or older.14 Rozen et al15 also reported that those aged 75 years or older, rather than younger individuals, could benefit from screening.
 
Using colorectal cancer–specific mortality data between 1991 and 2001 obtained from the National Center for Health Statistics database in the US, Maheshwari et al16 compared the impact of prematurely stopping screening with the maximal potential benefit expected from lifelong screening. A total of 80% of the maximal benefit from screening was achieved by screening up to the age of 82 years. Kahi et al17 examined the survival of older people after colonoscopy using a retrospective cohort analysis of those aged 75 years or above and followed up for a median of 5.95 years. The authors reported that colonoscopy was safe and yielded clinically significant findings in 15% of older patients.17
 
van Hees et al18 used a simulation model to determine up to what age colorectal cancer screening should be considered in unscreened older people with no, moderate, or severe co-morbidity. They concluded that if the physical condition of unscreened older people with different co-morbidity status permits them to undergo a colonoscopy, screening should be considered up to the ages of 86, 83, and 80 years for no, moderate, and severe co-morbidity, respectively. van Hees’ team also reported that fewer co-morbidities were associated with screening at older ages.19 Lansdorp-Vogelaar et al20 and Gross et al21 whose studies are included in this review, also arrived at a similar conclusion.
 
Not all studies found positive results for colorectal screening. A longitudinal study by Fillenbaum et al22 observed no significant association between cancer screening and population-level health-related outcomes (including mortality).
 
Over-diagnosis and complications from treatment are often concerns in the promotion of screening. Although colorectal polyps are detected more frequently in older people, especially those over the age of 80 years, the view is that to conduct a colonoscopy in older people is to introduce a higher risk for only a smaller gain in life expectancy (15%) than would be the case with younger people.23 Cancer screening in people older than 75 years remains controversial because they have not been included in RCTs on the efficacy of screening studies.10
 
The guidelines from the National Cancer Institute,24 the American Cancer Society,25 and the US Preventive Services Task Force (USPSTF)26 generally recommend that people who are at an average risk of developing colorectal cancer or who have a family history of colorectal cancer or colorectal polyps begin regular screening for colorectal cancer at the age of 50 years. Specifically, the USPSTF recommends against screening with colonoscopy beyond the age of 85 years.27 The Canadian Task Force on Preventive Health Care recommends against screening with colonoscopy at all ages, but it does support the use of FOBT or faecal immunochemical testing for screening every alternate year and with sigmoidoscopy every 10 years for those aged 50 to 74 years.27
 
In Hong Kong, the Department of Health launched a 3-year Colorectal Cancer Screening Pilot Programme in 2016 to provide subsidised screening for those born between 1946 and 1948. The Hong Kong Anti-Cancer Society recommends that individuals aged 50 to 75 years with an average risk of developing colorectal cancer should consider undergoing an annual FOBT and flexible sigmoidoscopy every 5 years or a colonoscopy every 10 years.28 Overall, the current literature suggests that colorectal cancer screening is beneficial, but that age as well as morbidity and life expectancy should be considered when determining the age at which screening should stop. Screening colonoscopy in very elderly patients (aged ≥80 years) should be performed only after carefully considering the potential benefits and risks, and the preferences of the patient. A summary of the literature review of screening for colorectal cancer is shown in Table 1.11 12 13 14 15 16 17 18 19 20 21 22 27
 

Table 1. Screening for colorectal cancer: summary of literature review11 12 13 14 15 16 17 18 19 20 21 22 27
 
Lung cancer screening
Chest X-rays, sputum cytology, and low-dose computed tomography (CT) have been used to screen for lung cancer.29 Although chest X-rays or sputum cytology have been used to check for signs of lung cancer, there is less evidence from RCTs to show that using them can lead to a reduction in the number of associated deaths.29 There is, however, some evidence from large-scale RCTs that low-dose CT screening can reduce lung cancer deaths.30
 
Oken et al31 compared annual chest radiographic screening with the usual care in the Prostrate, Lung, Colorectal, and Ovarian (PLCO) cancer screening trial. The participants were aged 55 to 74 years and were heavy smokers. Radiographic screening did not reduce lung cancer mortality when compared with the usual care. Aberle et al’s National Lung Screening Trial32 in the US examined the effects of lung cancer screening by low-dose CT for participants aged 55 to 74 years who were either current or former (within the past 15 years) heavy smokers (at least 30 packs of cigarettes/year). An annual low-dose CT for 3 years reduced 20% of deaths from lung cancer when compared with chest radiography.
 
Using simulation modelling, McMahon et al33 examined the potential benefits (life years saved or lung cancer deaths avoided) of 576 lung cancer screening programmes that included a variety of screening criteria in terms of age, smoking history, and the number and frequency of CT screenings. They concluded that it would be more efficient (measured in terms of the number of cancer deaths compared with no screening) if screening were extended to the age of 80 or 85 years. The potential harm of low-dose CT, however, should also be noted, such as false-positive and false-negative results, overdiagnosis, exposure to radiation, and an emotional toll on the individual concerned.
 
Based on the National Lung Screening Trial,32 a systematic evidence review30 and modelling studies, the USPSTF has updated their guidelines. They now recommend that people aged 55 to 80 years who currently smoke or who have quit smoking within the past 15 years should undergo annual screening with low-dose CT.34 The USPSTF also recommends that screening be discontinued for those who have quit smoking for 15 years or who have developed a health problem that substantially limits their life expectancy or their ability or willingness to undergo curative lung surgery.30 The Hong Kong Anti-Cancer Society does not recommend any routine screening for the general population. Considering both life expectancy and co-morbidity status would help physicians to decide the necessity of screening in different individuals.35 A summary of the literature review of screening for lung cancer is shown in Table 2.31 32 33
 

Table 2. Screening for lung cancer: summary of literature review31 32 33
 
Breast cancer screening
Clinical breast examinations and breast self-examinations, mammograms, ultrasound, and magnetic resonance imaging, are all measures to screen for breast cancer, with the mammogram being the most widely used test.
 
A systematic review by Galit et al36 suggested that with a reasonable life expectancy and without severe co-morbidities, women aged 75 years or above are likely to benefit from mammography. Mo et al37 found that mammography screening alone for Chinese women over the age of 70 years with positive clinical breast examination results would save on the cost of ultrasonography without any loss in the effectiveness of screening. When co-morbidity and screening are considered, Lansdorp-Vogelaar et al20 showed that the benefits of a biennial mammography existed until the median ages of 76, 74, 72, and 66 years for older women with no, mild, moderate, or severe co-morbidity, respectively.
 
The EUROSCREEN Working Group reviewed observational studies and reported that the reduction of the breast cancer mortality rate was 38% to 48% for women who had actually been screened, with the rate of over-diagnosis of only 6.5%.38 39 They argued that the current controversy is related to the use of inappropriate methods that are incapable of revealing the true effect of screening, and that population-based mammography screening is of greater benefit than harm.
 
Using simulation modelling, Tejada et al40 evaluated seven screening policies to determine which combination of upper age limit and screening interval could maximise screening benefits for older women. Annual screening with an upper age limit of 80 years was found to be most effective in increasing the survival rate.40 Similarly, Sanderson et al41 found a significant reduction in the breast cancer mortality rate of older women who underwent an annual mammography compared with those who underwent a biennial or irregular mammography.
 
Some researchers have nonetheless taken a contrary view. Fillenbaum et al22 found no significant association between breast cancer screening and health-related outcomes such as self-rated health and mortality. Similarly, the benefits of screening were found to be limited due to a huge number of cases of over-diagnosis in the older population.5 Mandelblatt et al42 evaluated the effectiveness of 20 different mammography screening programmes using six established models of cancer incidence and mortality trends in the US. They reported that if the age of cessation was set at after 69 years, the reduction in mortality would be slight.
 
A Cochrane review examined the effect of mammography screening in terms of mortality and morbidity in a total sample of 600 000 women.43 Screening led to a 15% reduction in mortality but the over-diagnosis and over-treatment rate was 30%. The authors suggested that screening might not be doing more good than harm.43 Of note, only one trial in this Cochrane review included women up to the age of 69 years. In their retrospective cohort study, Parvinen et al44 found that a mammography screening programme for women up to the age of 74 years effectively reduced mortality rates in the older population, but that the reduction in rate was only 20%. Their conclusion was that the gain in benefits may not justify the harm from screening.
 
Mammography screening is unlikely to benefit those with a life expectancy of less than 5 years as reported in Tazkarji et al’s study.27 Braithwaite et al45 found that the benefits of screening decrease with increasing age and co-morbidity. Their sample of women aged 65 years or above without severe co-morbidity showed only a slight improvement in life expectancy. They, too, argued that the magnitude of the benefit may not justify screening given the potential harm. Citing the Canadian National Breast Screening Study with 25 years of follow-up, the National Cancer Institute in the US concluded that the benefits of mammography screening are uncertain.46
 
In summary, the overall effect of breast cancer screening in older women remains a controversial topic. Currently, the American Cancer Society suggests that women who are at an ‘average risk’ of developing breast cancer have an annual mammogram starting at the age of 40 years, with no specific age mentioned as the marker for discontinuation, while the USPSTF now suggests that regular screening should start from the age of 50 years and end at the age of 74 years. The Hong Kong Breast Cancer Foundation recommends that women over the age of 40 years consider undergoing a mammography every 2 years.47 A summary of the literature review of screening for breast cancer is shown in Table 3.5 20 22 27 36 37 38 39 40 41 42 43 44 45
 

Table 3. Screening for breast cancer: summary of literature review5 20 22 27 36 37 38 39 40 41 42 43 44 45
 
Liver cancer screening
There are no widely recommended tests to screen for liver cancer among the general public except for those who are at a high risk of developing the disease. Alpha-fetoprotein (AFP) and abdominal ultrasound are the two most common tests in use. Nonetheless the sensitivity and specificity levels of AFP are unsatisfactory.48 This protein has also been shown to be unreliable in detecting small liver cancer.
 
There is hardly any evidence of the benefits of screening older people for liver cancer. Huang et al49 conducted a two-stage community screening programme (first with blood tests and then by ultrasonogram for identified high-risk cases) on a sample of 1002 people with a mean age of 68.3 years for women and men in an area where the hepatitis C virus is endemic. They observed that older patients who had early-stage hepatocellular carcinoma and who were being treated had a good prognosis for survival.
 
Currently, the American Cancer Society offers no recommendations for liver cancer screening in the general population. Cancer Research UK recommends a liver screening test only for high-risk individuals.50 Similarly, the Hong Kong Department of Health does not recommend routine cancer screening for people at ‘average risk’—only for those at high risk, such as carriers of the hepatitis B and/or C viruses and those with cirrhosis.51 In summary, screening tests for liver cancer should not be performed in a routine manner but should be recommended only for people who are at a high risk of developing the disease. A summary of the literature review of screening for liver cancer is shown in Table 4.49
 

Table 4. Screening for liver cancer: summary of literature review49
 
Prostate cancer screening
Prostate-specific antigen (PSA) testing, digital rectal examination, and prostate biopsy are the three main approaches usually used in combination with screening prostate cancer.4 There is no single effective and reliable test to screen for early prostate cancer in healthy men.50 It is not uncommon for men to have some cancer cells in their prostate by the age of 80 years although only one in 25 will actually die from prostate cancer.50 To date, the debate over PSA screening remains heated even though screening was first introduced in the late 1980s.
 
Konety et al52 reported the work of a 30-member panel of US experts who recommended that the initiation of screening for prostate cancer in men older than 75 years should be undertaken only after careful consideration, and that age-normed PSA values should be used to determine ‘normal’ levels.
 
Using mathematical modelling, Etzioni et al53 found that by 2000, 45% to 70% of the observed decline in prostate cancer mortality could be plausibly attributed to screening. They concluded that PSA screening might account for much of the observed drop in prostate cancer mortality. Etzioni et al54 also studied the link between PSA screening and the decline in the incidence of late-stage prostate cancer. Their tested model showed that screening explained about 80% of the observed decline in the incidence of distant-stage (as opposed to locoregional stage) prostate cancer. Nonetheless the team suggested that other factors such as awareness and advances in treatment might also play certain roles.
 
Telesca et al55 used data derived from the Surveillance, Epidemiology, and End Results (SEER) registry of the National Cancer Institute in the US to examine the increase and subsequent decline in the incidence of prostate cancer after the adoption of PSA screening, and arrived at the opposite conclusion. They maintained that the disease would not have continued to increase in incidence in the absence of PSA screening. Also using the SEER data, Welch and Albertsen56 used age-specific population estimates from the US Census data to determine the excess or deficit in the number of men diagnosed and treated each year after 1986. Since 1986, an estimated additional 1.3 million men were diagnosed and more than 1 million of them were treated. They concluded that most of the excess incidence must be the result of over-diagnosis.
 
Two large-scale RCTs published in 2009—the European Randomized Study of Screening for Prostate Cancer57 and the US PLCO cancer screening trial58—produced conflicting results on screening for prostate cancer with PSA testing, providing fuel for further debate.
 
Jemal et al59 conducted an interesting study that examined changes in the incidence of stage-specific prostate cancer and PSA screening rates for the period 2005 to 2012 using the US National Cancer Institute database. Both the incidence of early-stage prostate cancer and rates of PSA screening had declined, coinciding with the 2012 USPSTF recommendation to omit PSA screening from routine primary care. Nonetheless, the authors also recommended a longer follow-up period to ascertain whether these decreases were indeed associated with mortality trends. Thus, whether reduced screening would lead to reductions in over-diagnoses or to missed opportunities for early detection remains an open question.
 
The American Cancer Society states that a screening test should not be offered to men who do not have any symptoms of prostate cancer and who have a life expectancy of about 10 more years or less, because of its slow-growing prognosis. The USPSTF and the American Academy of Family Physicians do not recommend the use of the PSA test to screen for prostate cancer, as there is little evidence to show that the benefits outweigh the harm. They argue against screening for men 75 years of age and older because of a lack of evidence to support screening.
 
In brief, views about the desirability of prostate cancer screening are polarised, and much confusion over the issue remains.60 Observational evidence to date has not always supported the efficacy of PSA screening in reducing mortality; rather, a growing body of observational evidence points to the overdiagnosis and over-treatment of prostate cancer triggered by PSA testing.61 Randomised trials have produced conflicting results. Thus, the efficacy of prostate cancer screening for old men remains a point of contention. A summary of the literature review of screening for prostate cancer is shown in Table 5.20 27 52 53 54 55 56 57 58 59
 

Table 5. Screening for prostate cancer: summary of literature review20 27 52 53 54 55 56 57 58 59
 
To screen or not to screen older people
To screen or not to screen older people for common types of cancer remains controversial, especially for people over the age of 75 years. Screening may reduce the risk that individuals will develop a condition or its complications, but it may not guarantee protection. Most of the papers and guidelines suggested that screening has to be individualised for this particular age-group. Even though the risk of cancer increases with age, it should not be the only factor taken into account when making decisions about screening. Routine cancer screening does not benefit those with a limited life expectancy.62 Estimating life expectancy will help guide decision-making for preventive screening and treatment plans.27 Because life expectancy varies in relation to co-morbidity status, taking co-morbidity–adjusted life expectancy into consideration may be helpful to physicians.35
 
In any screening programme, there is an irreducible minimum of false-positive and false-negative results.23 The feelings and overall health status of the patient also need to be considered. It may be appropriate to screen patients with a life expectancy sufficiently long to experience the potential benefits of screening. Personalised consideration might benefit older people if the positive impacts can outweigh the negative, even for the oldest-old.
 
Conclusion
Cancer is common in the older population and, for them, the benefits of screening for common types of cancer remain controversial. The evidence is strongest for the efficacy of colorectal cancer screening, even for older people aged 75 years and beyond. Low-dose CT for screening for lung cancer has benefits for heavy smokers. Liver cancer screening is recommended only for those at high risk of developing the disease. The evidence for screening older people for breast cancer is conflicting; as is the evidence for the effectiveness of PSA tests for screening for prostate cancer. Although some screening tests can bring certain benefits, other factors related to advancing age may be present, such as co-morbidities that may cause harm and would eventually outweigh the benefits of cancer screening. More research is indeed needed to understand the relationship between cancer and ageing, and also the risks and benefits of cancer screening for older people, to ultimately promote good health and functional longevity.
 
References
1. World Health Organization. Cancer fact sheet. February 2017. Available from: http://www.who.int/mediacentre/factsheets/fs297/en/. Accessed 15 Jun 2017.
2. Ferlay J, Soerjomataram I, Dikshit R, et al. Cancer incidence and mortality worldwide: sources, methods and major patterns in GLOBOCAN 2012. Int J Cancer 2015;136:E359-86. Crossref
3. Ngan KC. Overview of Hong Kong cancer statistics of 2014. November 2016. Available from: http://www3.ha.org.hk/cancereg/pdf/overview/Summary%20of%20CanStat%202014.pdf. Accessed 15 Jun 2017.
4. Albert RH, Clark MM. Cancer screening in the older patient. Am Fam Physician 2008;78:1369-74.
5. de Glas NA, de Craen AJ, Bastiaannet E, et al. Effect of implementation of the mass breast cancer screening programme in older women in the Netherlands: population based study. BMJ 2014;349:g5410. Crossref
6. National Cancer Institute. International cancer screening network. 2014. Available from: http://appliedresearch.cancer.gov/icsn/. Accessed 2 Oct 2016.
7. Turkoz FP, Tokluoglu S, Durnali AG, et al. Cancer evaluation in geriatric population: a single institution experience. Int J Hematol Oncol 2013;23:28-33. Crossref
8. Craft M. Cancer screening in the older adult: issues and concerns. Nurs Clin North Am 2014;49:251-61. Crossref
9. Arksey H, O’Malley L. Scoping studies: towards a methodological framework. Int J Soc Res Methodol 2005;8:19-32. Crossref
10. Wilson JA. Colon cancer screening in the elderly: when do we stop? Trans Am Clin Climatol Assoc 2010;121:94-103.
11. Quarini C, Gosney M. Review of the evidence for a colorectal cancer screening programme in elderly people. Age Ageing 2009;38:503-8. Crossref
12. Meester RG, Doubeni CA, Lansdorp-Vogelaar I, et al. Colorectal cancer deaths attributable to nonuse of screening in the United States. Ann Epidemiol 2015;25:208-13. Crossref
13. Brenner H, Altenhofen L, Stock C, Hoffmeister M. Expected long-term impact of the German screening colonoscopy programme on colorectal cancer prevention: analyses based on 4,407,971 screening colonoscopies. Eur J Cancer 2015;51:1346-53. Crossref
14. Brenner H, Altenhofen L, Stock C, Hoffmeister M. Prevention, early detection, and overdiagnosis of colorectal cancer within 10 years of screening colonoscopy in Germany. Clin Gastroenterol Hepatol 2015;13:717-23. Crossref
15. Rozen P, Shabtai EI, Liphshitz I, Barchana M. Risk for colorectal cancer in elderly persons and possible methodologies for their screening. Eur J Gastroenterol Hepatol 2011;23:431-7. Crossref
16. Maheshwari S, Patel T, Patel P. Screening for colorectal cancer in elderly persons: who should we screen and when can we stop? J Aging Health 2008;20:126-39. Crossref
17. Kahi CJ, Azzouz F, Juliar BE, Imperiale TF. Survival of elderly persons undergoing colonoscopy: implications for colorectal cancer screening and surveillance. Gastrointest Endosc 2007;66:544-50. Crossref
18. van Hees F, Habbema JD, Meester RG, Lansdorp-Vogelaar I, Van Ballegooijen M, Zauber AG. Should colorectal cancer screening be considered in elderly persons without previous screening? A cost-effectiveness analysis. Ann Intern Med 2014;160:750-9. Crossref
19. van Hees F, Saini SD, Lansdorp-Vogelaar I, et al. Personalizing colonoscopy screening for elderly individuals based on screening history, cancer risk, and comorbidity status could increase cost effectiveness. Gastroenterology 2015;149:1425-37. Crossref
20. Lansdorp-Vogelaar I, Gulati R, Mariotto AB, et al. Personalizing age of cancer screening cessation based on comorbid conditions: model estimates of harms and benefits. Ann Intern Med 2014;161:104-12. Crossref
21. Gross CP, Soulos PR, Ross JS, et al. Assessing the impact of screening colonoscopy on mortality in the medicare population. J Gen Intern Med 2011;26:1441-9. Crossref
22. Fillenbaum GG, Burchett BM, Kuchibhatla MN, Cohen HJ, Blazer DG. Effect of cancer screening and desirable health behaviors on functional status, self-rated health, health service use and mortality. J Am Geriatr Soc 2007;55:66-74. Crossref
23. Pasetto LM, Monfardini S. Colorectal cancer screening in elderly patients: when should be more useful? Cancer Treat Rev 2007;33:528-32. Crossref
24. National Cancer Institute. Tests to detect colorectal cancer and polyps. 2016. Available from: http://www.cancer.gov/types/colorectal/screening-fact-sheet. Accessed 2 Oct 2016.
25. American Cancer Society. Guidelines for the early detection of cancer. 2016. Available from: http://www.cancer.org/healthy/findcancerearly/cancerscreeningguidelines/american-cancer-society-guidelines-for-the-early-detection-of-cancer. Accessed 2 Oct 2016.
26. US Preventive Services Task Force. Colorectal cancer: screening. 2016. Available from: http://www.uspreventiveservicestaskforce.org/Page/Document/UpdateSummaryFinal/colorectal-cancer-screening2? ds=1&s=Colorectal%20Cancer:%20Screening. Accessed 2 Oct 2016.
27. Tazkarji B, Lam R, Lee S, Meiyappan S. Approach to preventive care in the elderly. Can Fam Physician 2016;62:717-21.
28. Hong Kong Anti-Cancer Society. Cancer screening, early detection and prevention guidelines for health professionals. 2011. Available from: https://www.hkacs.org.hk/ufiles/CancerScreeningprofessionals_2ndedition_1.pdf. Accessed 2 Oct 2016.
29. Detterbeck FC, Mazzone PJ, Naidich DP, Bach PB. Screening for lung cancer: Diagnosis and management of lung cancer, 3rd ed: American College of Chest Physicians evidence-based clinical practice guidelines. Chest 2013;143(5 Suppl): e78S-92S.
30. Humphrey LL, Deffebach M, Pappas M, et al. Screening for lung cancer with low-dose computed tomography: a systematic review to update the US Preventive Services Task Force recommendation. Ann Intern Med 2013;159:411-20. Crossref
31. Oken MM, Hocking WG, Kvale PA, et al. Screening by chest radiograph and lung cancer mortality: the Prostate, Lung, Colorectal, and Ovarian (PLCO) randomized trial. JAMA 2011;306:1865-73. Crossref
32. National Lung Screening Trial Research Team; Aberle DR, Adams AM, Berg CD, et al. Reduced lung-cancer mortality with low-dose computed tomographic screening. N Engl J Med 2011;365:395-409. Crossref
33. McMahon PM, Meza R, Plevritis SK, et al. Comparing benefits from many possible computed tomography lung cancer screening programs: extrapolating from the national lung screening trial using comparative modeling. PLoS One 2014;9:e99978. Crossref
34. Moyer VA, US Preventive Services Task Force. Screening for lung cancer: U.S. Preventive Services Task Force recommendation statement. Ann Intern Med 2014;160:330-8. Crossref
35. Cho H, Klabunde CN, Yabroff KR, et al. Comorbidity-adjusted life expectancy: a new tool to inform recommendations for optimal screening strategies. Ann Intern Med 2013;159:667-76. Crossref
36. Galit W, Green MS, Lital KB. Routine screening mammography in women older than 74 years: a review of the available data. Maturitas 2007;57:109-19. Crossref
37. Mo M, Liu GY, Zheng Y, et al. Performance of breast cancer screening methods and modality among Chinese women: a report from a society-based breast screening program (SBSP) in Shanghai. Springerplus 2013;2:276. Crossref
38. Broeders M, Moss S, Nyström L, et al. The impact of mammographic screening on breast cancer mortality in Europe: a review of observational studies. J Med Screen 2012;19 Suppl 1:14-25. Crossref
39. Paci E; EUROSCREEN Working Group. Summary of the evidence of breast cancer service screening outcomes in Europe and first estimate of the benefit and harm balance sheet. J Med Screen 2012;19 Suppl 1:5-13. Crossref
40. Tejada JJ, Ivy JS, Wilson JR, Ballan MJ, Diehl KM, Yankaskas BC. Combined DES/SD model of breast cancer screening for older women, I: natural-history simulation. IIE Trans 2015;47:600-19. Crossref
41. Sanderson M, Levine RS, Fadden MK, et al. Mammography screening among the elderly: a research challenge. Am J Med 2015;128:1362.e7-14. Crossref
42. Mandelblatt JS, Cronin KA, Bailey S, et al. Effects of mammography screening under different screening schedules: model estimates of potential benefits and harms. Ann Intern Med 2009;151:738-47. Crossref
43. Gøtzsche PC, Nielsen M. Screening for breast cancer with mammography. Cochrane Database Syst Rev 2011;(1):CD001877. Crossref
44. Parvinen I, Heinävaara S, Anttila A, Helenius H, Klemi P, Pylkkänen L. Mammography screening in three Finnish residential areas: comprehensive population-based study of breast cancer incidence and incidence-based mortality 1976-2009. Br J Cancer 2015;112:918-24. Crossref
45. Braithwaite D, Walter LC, Izano M, Kerlikowske K. Benefits and harms of screening mammography by comorbidity and age: a qualitative synthesis of observational studies and decision analyses. J Gen Intern Med 2016;31:561-72. Crossref
46. National Cancer Institute. Breast cancer screening (PDQ)—health professional version. June 2017. Available from: https://www.cancer.gov/types/breast/hp/breast-screening-pdq/. Accessed 21 Jun 2017.
47. Hong Kong Breast Cancer Foundation. Breast self-examination. Available from: https://www.hkbcf.org/content.php?cid=20&tid=3&lang=eng. Accessed 29 Aug 2017.
48. Zhao YJ, Ju Q, Li GC. Tumor markers for hepatocellular carcinoma. Mol Clin Oncol 2013;1:593-8. Crossref
49. Huang YC, Huang CF, Chang KC, et al. Community-based screening for hepatocellular carcinoma in elderly residents in a hepatitis B- and C-endemic area. J Gastroenterol Hepatol 2011;26:129-34. Crossref
50. Cancer Research UK. Liver cancer. 2016. Available from: http://www.cancerresearchuk.org/about-cancer/liver-cancer/getting-diagnosed/screening. Accessed 15 Jun 2017.
51. Department of Health. Liver cancer: prevention and screening. Available from: http://www.chp.gov.hk/files/pdf/7_liver_cancer_prevention_and_screening_eng.pdf. Accessed 29 Aug 2017.
52. Konety BR, Sharp VJ, Raut H, Williams RD. Screening and management of prostate cancer in elderly men: the Iowa Prostate Cancer Consensus. Urology 2008;71:511-4. Crossref
53. Etzioni R, Tsodikov A, Mariotto A, et al. Quantifying the role of PSA screening in the US prostate cancer mortality decline. Cancer Causes Control 2008;19:175-81. Crossref
54. Etzioni R, Gulati R, Falcon S, Penson DF. Impact of PSA screening on the incidence of advanced stage prostate cancer in the United States: a surveillance modeling approach. Med Decis Making 2008;28:323-31. Crossref
55. Telesca D, Etzioni R, Gulati R. Estimating lead time and overdiagnosis associated with PSA screening from prostate cancer incidence trends. Biometrics 2008;64:10-9. Crossref
56. Welch HG, Albertsen PC. Prostate cancer diagnosis and treatment after the introduction of prostate-specific antigen screening: 1986-2005. J Natl Cancer Inst 2009;101:1325-9. Crossref
57. Schröder FH, Hugosson J, Roobol MJ, et al. Screening and prostate-cancer mortality in a randomized European study. N Engl J Med 2009;360:1320-8. Crossref
58. Andriole GL, Crawford ED, Grubb RL 3rd, et al. Mortality results from a randomized prostate-cancer screening trial. N Engl J Med 2009;360:1310-9. Crossref
59. Jemal A, Fedewa SA, Ma J, et al. Prostate cancer incidence and PSA testing patterns in relation to USPSTF screening recommendations. JAMA 2015;314:2054-61. Crossref
60. Stricker PD, Frydenberg M, Kneebone A, Chopra S. Informed prostate cancer risk-adjusted testing: a new paradigm. BJU Int 2012;110 Suppl 4:30-4. Crossref
61. Croswell JM, Kramer BS, Crawford ED. Screening for prostate cancer with PSA testing: current status and future directions. Oncology (Williston Park) 2011;25:452-60,463.
62. Royce TJ, Hendrix LH, Stokes WA, Allen IM, Chen RC. Cancer screening rates in individuals with different life expectancies. JAMA Intern Med 2014;174:1558-65. Crossref

Pages