Willingness for deceased organ donation under different legislative systems in Hong Kong: population-based cross-sectional survey
Hong Kong Med J 2018;24:Epub 10 Apr 2018
DOI: 10.12809/hkmj176831
ORIGINAL ARTICLE
Willingness for deceased organ donation under different
legislative systems in Hong Kong: population-based cross-sectional survey
TK Cheung, BSc; TC Cheng, BSc; LY Wong, BSN, MPH,
PhD
The Jockey Club School of Public Health and
Primary Care, The Chinese University of Hong Kong, Prince of Wales
Hospital, Shatin, Hong Kong
Corresponding author: Prof LY Wong (lywong@cuhk.edu.hk)
 Full
paper in PDF
Full
paper in PDF
Abstract
Introduction: Under the current
opt-in system, the deceased organ donation rate remains low in Hong
Kong. An opt-out system and an opt-in system combined with organ
allocation priority (ie, priority to donors as transplant recipients)
have been proposed to encourage willingness among the general population
towards deceased organ donation. This study aimed to compare
willingness, and its determinants, across these three legislative
systems.
Methods: A random telephone
survey of Hong Kong permanent residents aged ≥18 years was conducted
between August and October 2016 using an anonymous questionnaire.
Willingness towards deceased organ donation was compared between the
legislative systems with McNemar’s test. Determinants of willingness
were tested by logistic regression.
Results: The proportion of those
willing to consider deceased organ donation under the current opt-in
system would significantly increase after combining it with allocation
priority (64.5% vs 73.4%; P=0.018). “Fairness or reciprocity” was the
major reported reason underlying the increase. In contrast,
willingness would decrease after introducing the opt-out
system (60.1%), although not significantly (P=0.336). The reduction
might be attributable to a “belief of being forced to donate”. Under the
allocation priority system, reduced willingness to donate was associated
with advanced age, lower educational attainment, and lower monthly
household income. Under the opt-out system, reduced willingness was
associated with being married, having a lower household income, and
distrust of local government.
Conclusions: An opt-in system
with allocation priority could induce willingness to donate, whereas an
opt-out system may reduce willingness. The findings have implications
for policy-making and promotion of organ donation.
New knowledge added by this study
- Introducing organ allocation priority to the current opt-in system is expected to significantly increase willingness of the Hong Kong general population for deceased organ donation.
- Replacing the opt-in system by an opt-out system may cause a reduction in willingness to donate. A portion of registered donors (15.8%) and of the general population who were willing to donate organs under the current opt-in system (28.2%) said they were reluctant to stay in the donor pool under the proposed opt-out system.
- The present study can help health care policymakers anticipate public attitude towards implementing an opt-out system and its potential effectiveness.
- The findings support alternative legislative systems of deceased organ donation other than the opt-out system, such as an opt-in allocation priority system.
- Apart from modification of the legislative system for organ donation, the government should consider policies designed to motivate registering behaviour.
Introduction
Organ transplantation offers the best clinical
management for patients with end-stage organ failure. Since the first
successful kidney transplant in 1954,1
a number of studies have confirmed that organ transplantation provides the
best outcomes for survival,2
quality of life,3 and
cost-effectiveness.4 With advances
in surgical techniques and immunosuppressive drugs, organ donation has
also progressively improved over the decades. However, the low rate of
deceased organ donation is a universal problem. Different countries have
adopted different policy schemes to encourage deceased organ donation but
the donation rates vary.
Currently, Hong Kong adopts an opt-in legislative
system of organ donation, where an individual who is willing to donate
their organs after death is required to carry a signed donor card or
register online at the Central Organ Donation Register.5 However, the registration rate among the general
population is low and was about 11% in 2015.6
The actual number of deceased donors in the same year was only 5.8 per
million population, which is much lower than in other developed areas: for
example, Spain has a deceased donor rate of 34 per million population,
which is the world’s highest.7 As a
result, organ demand consistently outweighs supply, leading to a long
waiting list.8
The World Health Organization is urging every
country to advance their organ procurement programme.9 Two legislative systems have been proposed to increase
the donation rate: an opt-out system and an opt-in system with organ
allocation priority (allocation priority system).10
An opt-out system presumes an individual is a potential deceased donor
unless refusal has been expressed by ‘opting out’ of the donor pool. This
system can simplify registration procedures and is convenient for those
willing to donate organs. An opt-out system, however, does not
specifically indicate willingness.11
On the basis of empirical evidence from several European countries,
implementing an opt-out system can successfully raise awareness and
willingness for deceased organ donation12
and actual donation rates.11 13 14 15
An opt-in system with allocation priority is
another policy approach, in which individuals who have registered as a
deceased donor will gain priority points on the transplant waiting list. A
priority point is a reward for those who are willing to donate an organ
and who in turn gain preferential status for receiving a donor organ if
required.16 This system can
motivate the public to register as donors by providing them with a higher
chance of extending their own lives and address the perceived unfairness
of ‘free-riders’ who are willing to receive an organ but unwilling to
donate. Israel adopted this policy approach in the Organ Transplant Act of
2008 and illustrated its effectiveness by the number of signed donor cards
and actual donation rates.10 16 17
In light of the low deceased organ donation rate in
Hong Kong, the government is currently reviewing its donation policy and
is considering replacing the current opt-in system by an opt-out system.
However, introducing an opt-out system without public support may actually
reduce the donation rate,18 as it
did in Brazil and Singapore.6
Similarly, ethical issues of the allocation priority system may fuel
public opposition. On the one hand, it promotes a fair concept of
reciprocity.16 19 On the other hand, there is a perception that organ
allocation should be based not on an individual’s willingness to donate,
but solely on their medical needs.16
19 It is difficult to predict the
effectiveness of proposed legislative systems in Hong Kong on the basis of
experience elsewhere, and local analysis of these systems is limited. Only
one local study has examined the willingness to donate a kidney under an
opt-out system but the feasibility of allocation priority was not
included.20 In addition,
socio-economic and demographic determinants may influence willingness
towards deceased organ donation. A Malaysian study suggested that such
determinants may differ under different legislative systems.21 Interestingly, political viewpoint is also correlated
with willingness when a new legislative system is imposed.12 22 It is
thus important to explore these determinants when considering an opt-out
system or allocation priority system.
Study aims
This study aimed to explore whether a proposed
opt-out system or opt-in allocation priority system would increase public
willingness in Hong Kong towards deceased organ donation, and to examine
the association of socio-economic, demographic, and political determinants
with the willingness of deceased organ donation under different proposed
policies.
Methods
A cross-sectional telephone survey with a
structured questionnaire was conducted. The target population was Hong
Kong permanent residents who were aged ≥18 years, able to register as a
deceased organ donor, and able to speak Cantonese. On the basis of the
‘10k rule of thumb’,23 the minimum
sample size required to test the association between the willingness of
organ donation and the seven socio-demographic variables in this study was
about 200. Assuming a 0.05 type 1 error, the sample size would be able to
detect 15% and 20% significant differences in the proportions of persons
shifting from ‘unwilling’ to ‘willing’ to donate after proposing the
allocation priority system and opt-out system, respectively, both with at
least 80% power. With the assumption that 12% of landline telephone
numbers are valid and there would be a 30% response rate, a sample of
about 5600 telephone numbers was needed. A computerised random list of
5800 eight-digit residential telephone numbers (starting with ‘2’ and ‘3’,
the current telephone number system in Hong Kong) was generated.
Telephone interviews were held from 18:00 to 20:30
on every weekday and from 11:00 to 18:00 on every weekend to ensure
coverage of different demographics. The actual proportions of calls made
on weekdays and at weekends were 41.3% and 58.7%, respectively. Interviews
were conducted by the first two authors and each took about 5 to 7
minutes, including an introduction explaining the interview and obtaining
verbal consent. A maximum of three calls was made at different times on
different days before a telephone number was considered invalid. If more
than one family member in a household was eligible, the person whose next
birthday was closest to the interview date was invited to participate.
The questionnaire was developed from a literature
review and comprised 14 items in four sections: (1) current opt-in system;
(2) proposed opt-out system; (3) proposed opt-in allocation priority
system; (4) background information: socio-economic and demographic
characteristics and political views. Reasons underlying the willingness
under each legislative system were explored with open-ended questions. On
the basis of a pilot study of the questionnaire’s feasibility and wording,
involving 10 members of the general public, descriptions of the two
proposed systems were refined. Double-entry of data and data cleaning were
conducted by the authors. Ethics approval was granted by the Survey and
Behavioural Research Ethics Committee of The Chinese University of Hong
Kong.
All statistical analyses were performed with IBM
SPSS Statistics 24 (IBM Corp, Armonk [NY], USA). A descriptive summary of
characteristics of respondents compared with those of the targeted general
population24 was prepared.
Two-sided McNemar’s tests were used to compare willingness rates between
the current opt-in system and the opt-out system, as well as between the
current opt-in system and the allocation priority system. Univariate
logistic regression analyses were performed to explore associations
between each independent variable (demographics, socio-economic level, and
political view) and the dependent variable (willingness of deceased organ
donation) under the proposed opt-out and allocation priority systems,
separately. Significant independent variables were further tested by
multiple logistic regression analysis using the forced entry method.
P<0.05 was considered statistically significant. A qualitative content
analysis was also conducted by the first author to identify meaningful
units emerging from the open-ended questions for underlying reasons for
willingness to donate. The units were coded into categories based on the
findings and suggested by the literature review,6
16 17
25 and were checked independently
by the second author.
Results
Telephone interview response rate
Telephone interviews took place between 2 August
and 18 October 2016 in Hong Kong. A total of 5800 households were
contacted and 203 respondents completed the questionnaire (response rate,
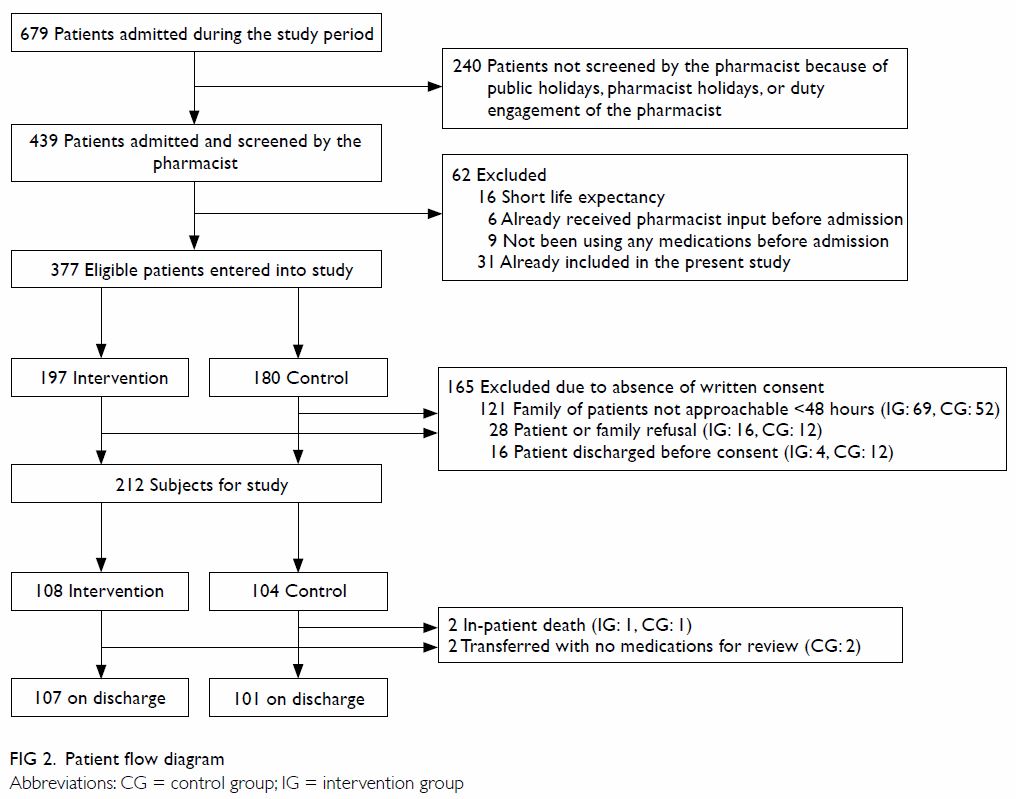
19.7%) (Fig).
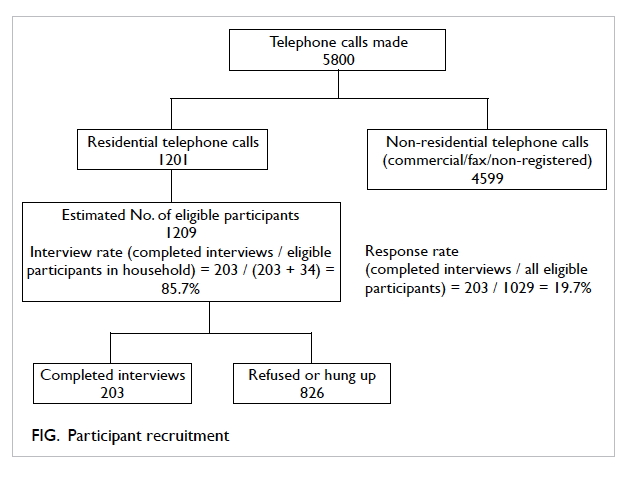
Figure. Participant recruitment
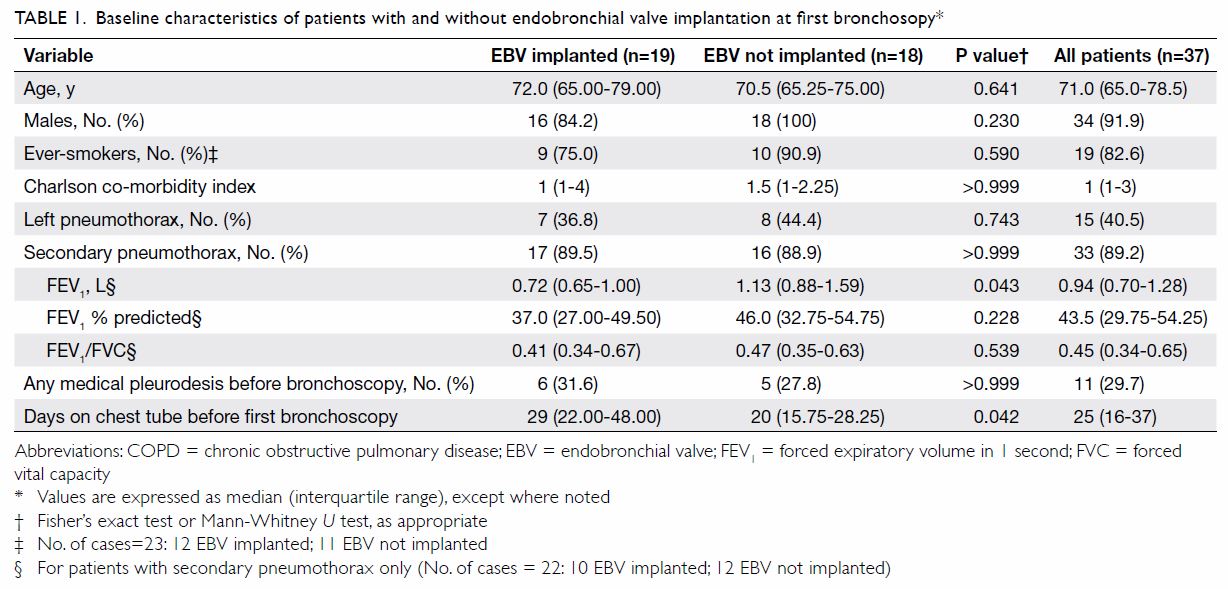
Characteristics of respondents
The majority of the respondents were female (60.9%
of 202), were aged 18 to 30 years (43.2% of 199), had a post-secondary
education (41.0% of 200), were employed (54.0% of 202), were never married
(52.3% of 197), and had a monthly household income of more than HK$40 000
(37.6% of 189). Compared with the general population, our study sample
contained smaller proportions who were male, older than 40 years, educated
to secondary level, or married, or who had a household income of <HK$20
000. (Table 1).
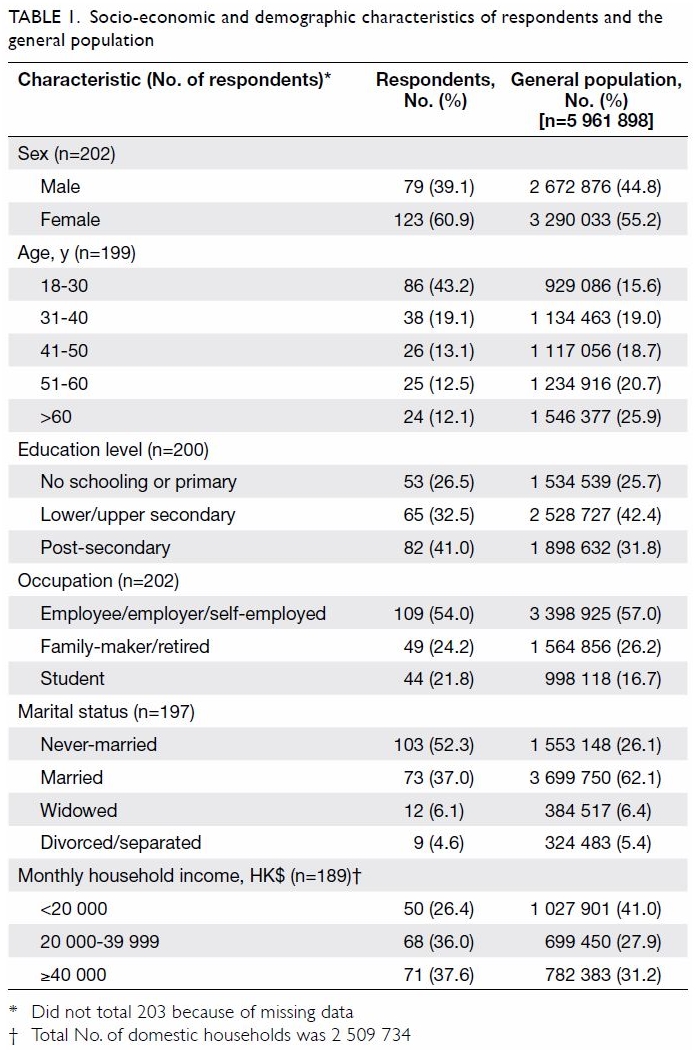
Table 1. Socio-economic and demographic characteristics of respondents and the general population
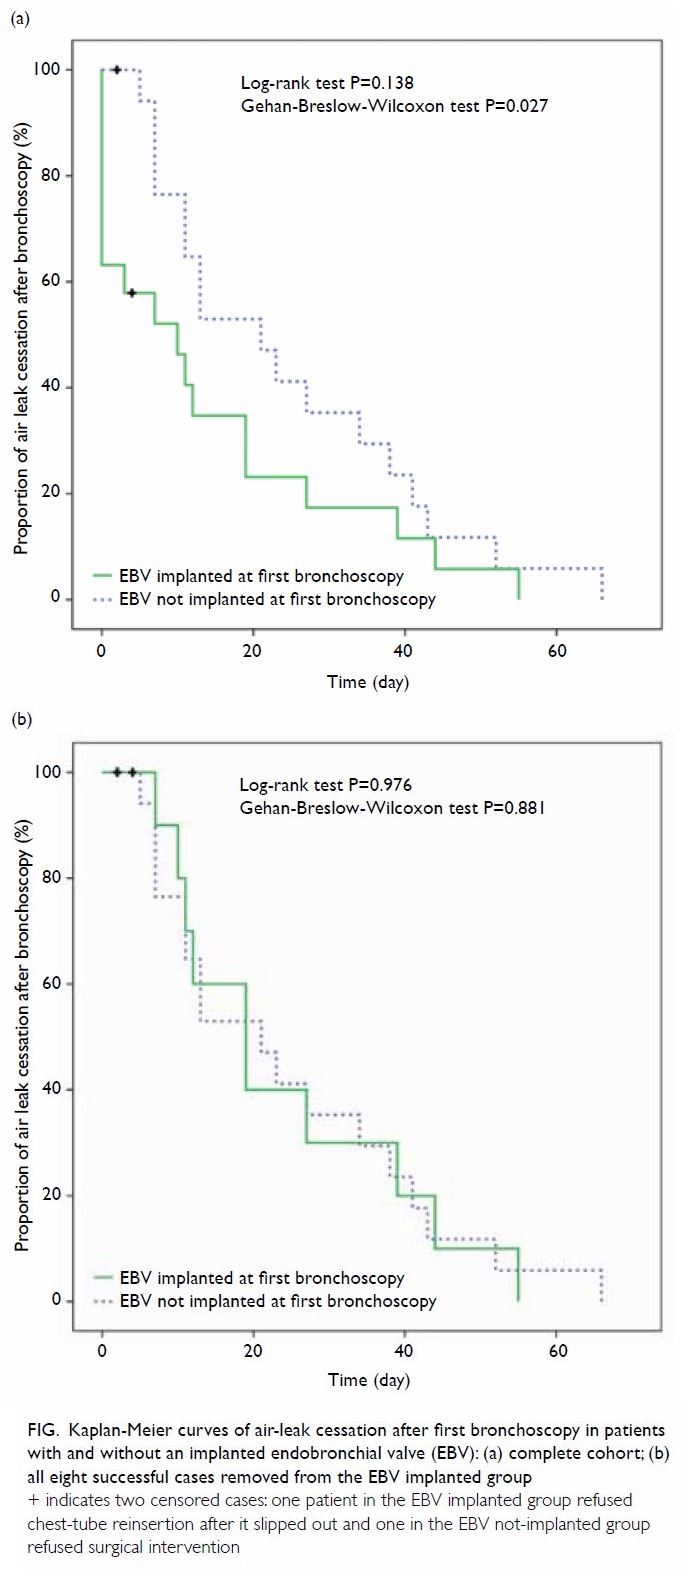
Willingness towards deceased organ donation
Under the current opt-in system, a majority of
respondents were willing to donate organs after death (64.5%), whereas
some were unwilling (11.8%) and others were unsure (23.6%) [Table
2]. Among those willing to donate, only 29.0% had registered as
deceased donors.
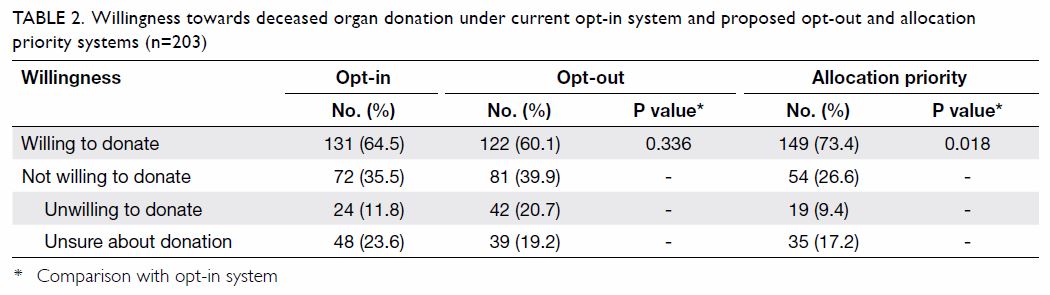
Table 2. Willingness towards deceased organ donation under current opt-in system and proposed opt-out and allocation priority systems (n=203)
After the opt-out system was proposed, 37.0% of
respondents who were unsure about donation or had been unwilling to donate
previously, reported a willingness to stay in the donor pool. However,
15.8% of registered donors and 28.2% of respondents who had originally
expressed a willingness to donate were reluctant to stay in the donor
pool. Overall, the willingness rate decreased from 64.5% under the current
opt-in system to 60.1% under the proposed opt-out system, although the
reduction was not statistically significant. In contrast, combining the
opt-in system with allocation priority motivated 64.8% of respondents
originally unwilling to donate to instead express a willingness. Only
11.4% of those originally willing to donate were demotivated. This
resulted in a statistically significant increase in the overall
willingness rate, from 64.5% under the current opt-in system to 73.4%
under the proposed allocation priority system (P=0.018) [Table
2].
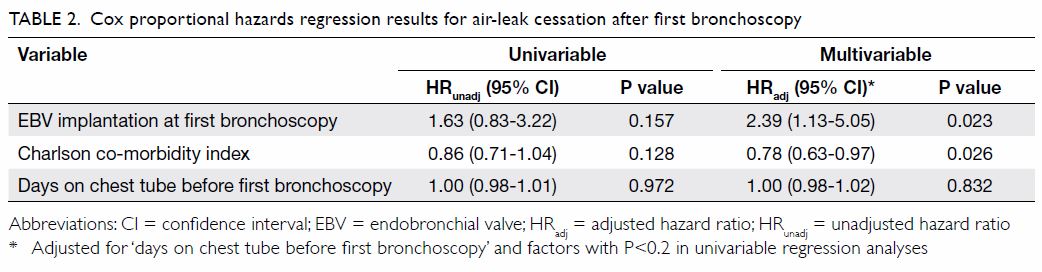
Under the allocation priority system, respondents
who changed their stance from unwilling to willing to donate (n=35) did so
largely because they perceived the system as a “fair or reciprocal” method
of organ allocation (57.1%). They believed they “had a greater chance of
receiving an organ transplant if registered” (54.3%). At the same time,
some respondents who had originally expressed a willingness to donate were
reluctant to do so under the priority system (n=17). They felt that the
preferential status was useless, as “the waiting list would be still very
long” (52.9%). Some also mentioned that it was “unethical” if criteria
other than medical condition were used for organ allocation (47.1%) [Table
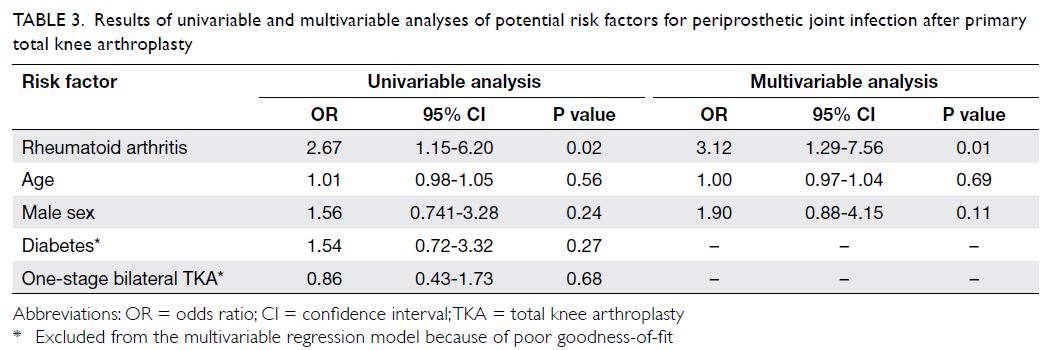
3].
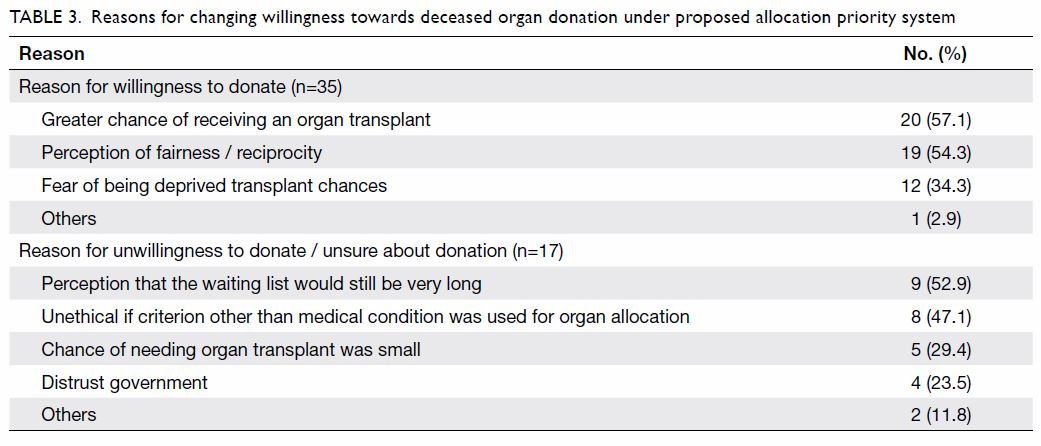
Table 3. Reasons for changing willingness towards deceased organ donation under proposed allocation priority system
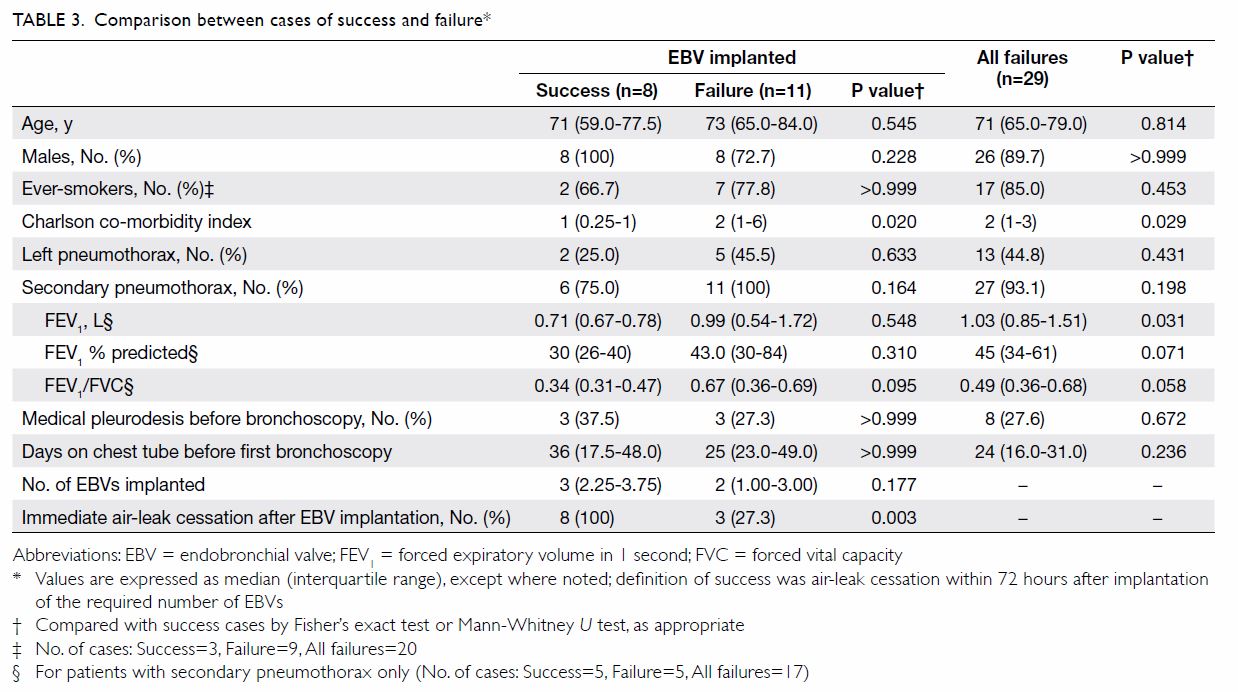
After the opt-out system was explained, those who
had been unsure about donor registration or unwilling to donate under the
opt-in system (n=30) were willing to stay in the donor pool because the
opt-out system offered them “convenience for indicating willingness”
(23.3%). Moreover, some believed that remaining in the donor pool was a
“civic duty” (20.0%). Conversely, many respondents who had been willing to
donate under the opt-in system chose to opt out (n=39), as they perceived
that under the system they were “forced to donate” (69.2%). “Distrust of
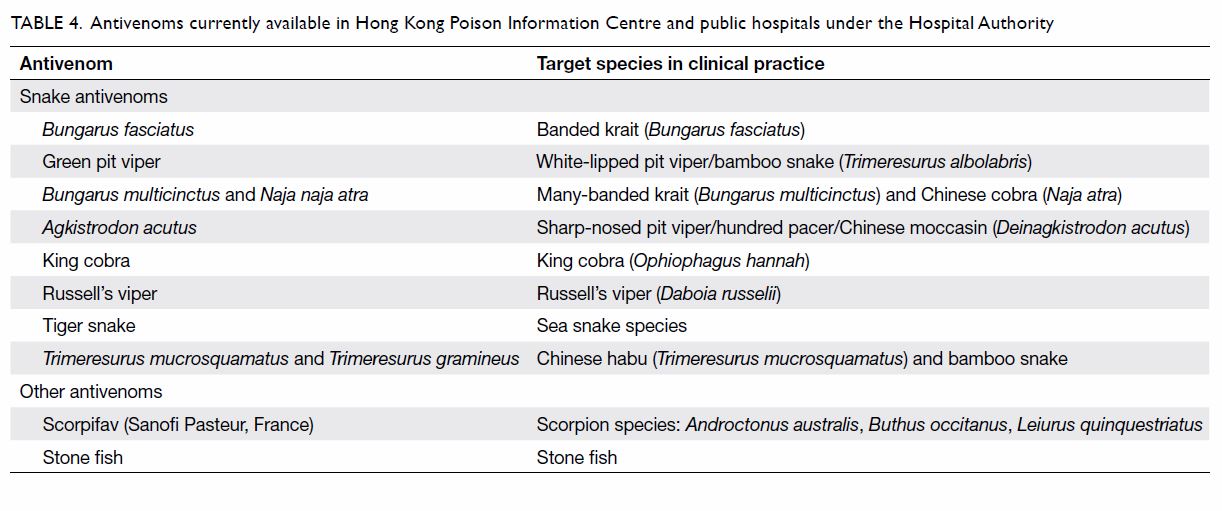
local government” was another reason (30.8%) [Table 4].
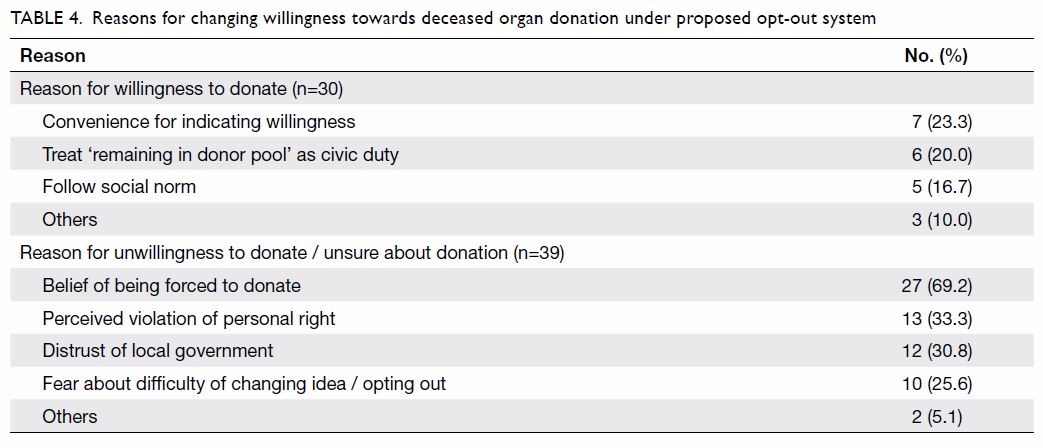
Table 4. Reasons for changing willingness towards deceased organ donation under proposed opt-out system
Determinants of willingness for deceased organ donation
Associations between variables and willingness were
first tested by univariate logistic regression for each legislative system
(Table 5). Under the opt-out system, age, educational
attainment, monthly household income, marital status, and political view
were significantly associated with willingness. Under the allocation
priority system, age, educational attainment, monthly household income,
and marital status were the significant predictors. Sex and occupation
were not significantly associated with a willingness to donate under
either system.
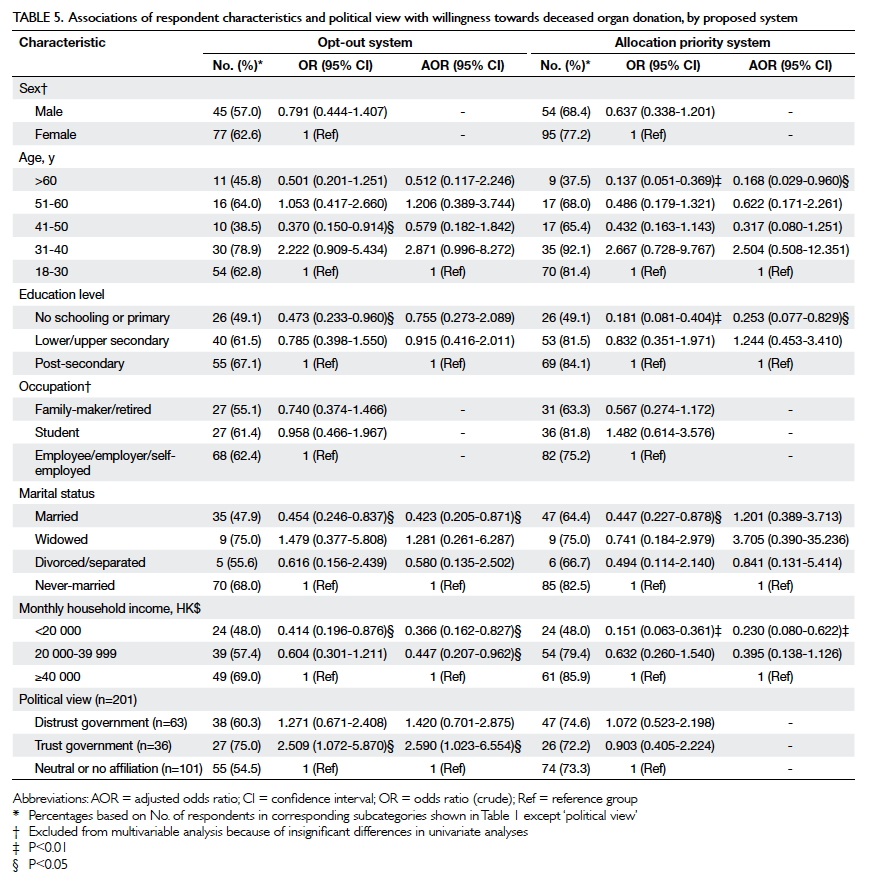
Table 5. Associations of respondent characteristics and political view with willingness towards deceased organ donation, by proposed system
These significant predictors were further analysed
by multiple logistic regression. Under an opt-out system, respondents who
were married (adjusted odds ratio [AOR]=0.423, 95% confidence interval
[CI]=0.205-0.871) or earned a monthly household income of <HK$20 000
(AOR=0.366, 95% CI=0.162-0.827) or HK$20 000-39 999 (AOR=0.447, 95%
CI=0.207-0.962) had a lower willingness to donate, whereas those who
trusted local government had a higher willingness (AOR=2.590, 95%
CI=1.023-6.554). Under an allocation priority system, lower willingness to
donate was associated with age over 60 years (AOR=0.168, 95%
CI=0.029-0.960), primary education level or no schooling (AOR=0.253, 95%
CI=0.077-0.829), and monthly household income of <HK$20 000 (AOR=0.230,
95% CI=0.080-0.622).
Discussion
Main findings
This study provides the first analysis of attitudes
towards different policies for deceased organ donation and related
determinants. We found that an allocation priority system would
significantly motivate respondents to donate their organs, similar to the
findings of an Israeli public telephone survey.17
The major underlying reason of “fairness or reciprocity” is aligned with
the concept of justice,19 as
organs are a scarce societal resource with a demand that heavily outweighs
the supply. The positive effect of a proposed priority incentive on
respondents’ willingness to donate may be related to possible organ
scarcity in the market with the extremely low donation rates in both
Israel and Hong Kong.7 In addition,
the concept of reciprocity might be derived from a moral duty of mutual
aid.26 Similar to many countries
that adopt the priority system, especially Singapore, Hong Kong treats
moral duty as a legislative foundation. Respondents might have agreed that
those who refuse to donate their organs (free-riders) should not receive
organs ahead of those who are willing to donate.17
Furthermore, respondents ,may also have been motivated by priority
incentives, providing them with a potential chance to extend their life.
This outcome is unsurprising, as it is the key feature of this allocation
priority system.16
With the increasing demand for organ
transplantation, the Hong Kong government has explored the feasibility of
an opt-out system. It is worth noting that a proposed opt-out system
caused a reduction in the willingness for deceased organ donation,
although not to a significant degree. This finding contradicts that
suggested by a recent Hong Kong study on kidney donation,20 which claimed that the willingness to donate would
rise significantly under an opt-out system. This inconsistency may be
attributable to an assumption made by that study, that those willing to
donate organs under the current opt-in system would remain willing under
an opt-out system. Yet, our study found that a large number of respondents
who were originally willing to donate changed to being unwilling to stay
in the donor pool. The switch was because many initially willing
respondents perceived that under an opt-out system, they were “being
forced” to donate. Nonetheless, the opt-out system has successfully
induced a willingness to donate in many European countries12 that also advocate personal liberties. According to a
European study, a societal environment was a prerequisite for the
government to justify an opt-out system that would limit citizens’
liberties.27 First, the opt-out
system can be imposed only when there are no less restrictive
alternatives. Yet, alternatives do exist, such as the allocation priority
system. Second, as in the present study, government popularity seems to be
another prerequisite condition that was lacking. Distrust of the local
government led some respondents to opt out.
Moreover, our study identifies determinants
associated with a willingness towards deceased organ donation. Respondents
with a lower education level and older age were less likely than others to
donate organs under an allocation priority system. These significant
factors might arise from a stronger traditional belief among the elderly
population of keeping a body intact after death,21
as well as a lower awareness of organ donation among those with less
education.28 The present study
also reveals that those who were married were more reluctant than
never-married people to donate under the opt-out system, because a married
person might need a partner’s consent before making a decision about
donating organs. Echoed by Malaysian and European studies, a trust in
government was associated with a higher willingness towards deceased organ
donation under the opt-out system.12
22
Lower monthly household income was associated with
lower willingness to donate organs under both systems. This association
may be because those with a higher income are more likely to promote a
supportive attitude towards organ donation.29
Although the significance of each determinant varied between the opt-out
system and the allocation priority system, strengths and directions of the
associations were similar across both. More importantly, these significant
determinants were also significant under the current opt-in system.30 Thus, regardless of the legislative system imposed,
determinants associated with willingness to donate appear the same.
Implications of findings
Policy-making
This study provides preliminary evidence of the
potential effectiveness of different legislative systems. In particular,
the study responds to the recent public controversy over the possible
introduction of an opt-out system in Hong Kong,31
and may help policymakers anticipate public opposition to such a system.
The government should first create a supportive societal environment and
gain public trust before its implementation.
At the same time, this study provides evidence to
support adding allocation priority to the current opt-in system in Hong
Kong. The findings offer policymakers new insight into alternative
legislative systems other than the opt-out system. Further evaluation of
the priority incentive or other policy instruments is suggested so that
policymakers can identify the best alternative.
The design of an administrative procedure to
motivate and facilitate registering behaviour should also be considered.
Similar to other local studies,6 30 this study found that the rate
of registration to donate was quite low among those currently willing. The
main reasons may be laziness and lack of knowledge about the registration
procedure.6 Thus, an individual’s
attitude towards donation is not necessarily aligned with registering
behaviour.12 32 In other words, combining the opt-in system with
allocation priority may not necessarily result in a higher registration
and donation rate in practice. Policymakers should consider measures that
will simplify the registration procedure. For example, in the United
States and the United Kingdom, driving license applicants are invited to
register as deceased organ donors.33
Education
Another recommendation stemming from this study is
the development of targeted promotion strategies when a new legislative
system is introduced. With an understanding of determinants of willingness
to donate, the Organ Donation Promotion Charter can target those who are
less willing to donate. By increasing knowledge and alleviating concerns
about procedures involved under the new legislative system, public
willingness is expected to increase.12
Promotional campaigns should also help build public trust in the
government for a smooth implementation of the new system.
Strengths and weaknesses
The strength of this study is the use of random
sampling for respondent recruitment. A random-digit dialling method was
used such that unlisted numbers were also contacted. Each residential
telephone number, therefore, had an equal selection probability. With a
95% residential fixed-line penetration rate,34
the sampling frame included most of the Hong Kong general population.
This study has several limitations. There may have
been selection bias (selective timing of telephone calls) and
self-selection bias (non-response after receiving phone calls). Our study
is not representative of the general population, as it has fewer
respondents who were male, of older age, educated to secondary level, of
lower socio-economic status, and married. In addition, without
standardised protocols, information bias may have arisen from recording
and classifying responses from the open-ended questions that asked for
underlying reasons for change in willingness. Examination of determinants
of the willingness to donate was also limited by the small sample size.
Subsequent surveys with a larger sample are recommended to investigate
socio-demographic variables as well as other possible factors, such as
chronic illness requiring an organ transplant in respondents and their
relatives or friends.
Conclusion
This study examined the impact of a proposed opt-in
system with organ allocation priority and an opt-out system on willingness
towards deceased organ donation among the Hong Kong general population. An
allocation priority system could induce willingness to donate. At the same
time, the study provides discouraging evidence for the effectiveness of an
opt-out system. These findings have implications for policy-making and
targeted education. More research is needed to study alternative
legislative systems to solve the crisis of organ shortage in Hong Kong.
Acknowledgement
We thank Ms Yuen-Fan Tong for her support and
experience in the development of the questionnaire.
Declaration
The authors have no conflicts of interest to
disclose.
References
1. Matesanz R, Dominguez-Gil B. Strategies
to optimize deceased organ donation. Transplant Rev 2007;21:177-88. CrossRef
2. Wolfe RA, Ashby VB, Milford EL, et al.
Comparison of mortality in all patients on dialysis, patients on dialysis
awaiting transplantation, and recipients of a first cadaveric transplant.
N Engl J Med 1999;341:1725-30. CrossRef
3. Keown P. Improving quality of life—the
new target for transplantation. Transplantation 2001;72(12 Suppl):S67-74.
4. Winkelmayer WC, Weinstein MC, Mittleman
MA, Glynn RJ, Pliskin JS. Health economic evaluations: the special case of
end-stage renal disease treatment. Med Decis Making 2002;22:417-30.
5. Department of Health, Hong Kong SAR
Government. Know more about centralised organ donation register. 2013.
Available from: https://www.organdonation.gov.hk/eng/knowmore.html.
Accessed 2 Nov 2016.
6. Hong Kong Ides Centre. A preliminary
study on deceased organ donation in Hong Kong. 2015. Available from:
http://www.ideascentre.hk/wordpress/wp-content/uploads/2009/02/Final-Report-for-Organ-Donation-TC.pdf.
Accessed 2 Nov 2016.
7. International Registry in Organ Donation
and Transplantation. 2015. Available from: http://www.irodat.org/.
Accessed 2 Nov 2016.
8. Department of Health, Hong Kong SAR
Government. Statistics (milestones of Hong Kong organ transplantation).
2016. Available from:
https://www.organdonation.gov.hk/eng/statistics.html. Accessed 2 Nov 2016.
9. Rodriguez-Arias D, Wright L, Paredes D.
Success factors and ethical challenges of the Spanish Model of organ
donation. Lancet 2010;376:1109-12. CrossRef
10. Zúñiga-Fajuri A. Increasing organ
donation by presumed consent and allocation priority: Chile. Bull World
Health Organ 2015;93:199-202. CrossRef
11. Johnson EJ, Goldstein D. Medicine. Do
defaults save lives? Science 2003;302:1338-9. CrossRef
12. Mossialos E, Costa-Font J, Rudisill C.
Does organ donation legislation affect individuals’ willingness to donate
their own or their relative’s organs? Evidence from European Union survey
data. BMC Health Serv Res 2008;8:48. CrossRef
13. Rithalia A, McDaid C, Suekarran S,
Myers L, Sowden A. Impact of presumed consent for organ donation on
donation rates: a systematic review. BMJ 2009;338:a3162. CrossRef
14. Abadie A, Gay S. The impact of
presumed consent legislation on cadaveric organ donation: a cross-country
study. J Health Econ 2006;25:599-620. CrossRef
15. Gimbel RW, Strosberg MA, Lehrman SE,
Gefenas E, Taft F. Presumed consent and other predictors of cadaveric
organ donation in Europe. Prog Transplant 2003;13:17-23. CrossRef
16. Cronin AJ. Points mean prizes:
priority points, preferential status and directed organ donation in
Israel. Isr J Health Policy Res 2014;3:8. CrossRef
17. Siegal G. Making the case for directed
organ donation to registered donors in Israel. Isr J Health Policy Res
2014;3:1. CrossRef
18. Institute of Medicine. Presumed
consent. In: Childress FJ, Liverman TC, editors. Organ Donation:
Opportunities for Action. Washington, DC: The National Academies Press;
2006: 214.
19. Chandler JA. Priority systems in the
allocation of organs for transplant: should we reward those who have
previously agreed to donate. Health Law J 2005;13:99-138.
20. Chan TK, Cowling BJ, Tipoe GL. A
public opinion survey: is presumed consent the answer to kidney shortage
in Hong Kong? BMJ Open 2013;3.pii:e002013. CrossRef
21. Tumin M, Tafran K, Mutalib MA, et al.
Demographic and socioeconomic factors influencing public attitudes toward
a presumed consent system for organ donation without and with a priority
allocation scheme. Medicine (Baltimore) 2015;94:e1713. CrossRef
22. Tumin M, Noh A, Jajri I, Chong CS,
Manikam R, Abdullah N. Factors that hinder organ donation:
religio-cultural or lack of information and trust. Exp Clin Transplant
2013;11:207-10. CrossRef
23. Troutt MD. Regression, 10k rule of
thumb for. In: Kotz S, Campbell RB, Balakrishnan N, Vidakovic B, Johnson
NL, editors. Encyclopedia of Statistical Sciences. John Wiley & Sons,
Inc; 2004:7098.
24. Census and Statistics Department, Hong
Kong SAR Government. By-census results. 2016. Available from:
http://www.bycensus2016.gov.hk/en/bc-index.html. Accessed 2 Nov 2016.
25. Lavee J, Brock DW. Prioritizing
registered donors in organ allocation: an ethical appraisal of the Israeli
organ transplant law. Curr Opin Crit Care 2012;18:707-11. CrossRef
26. Peters DA. A Unified approach to organ
donor recruitment, organ procurement, and distribution. J Law Health
1988-1989;3:157-87.
27. Verheijde JL, Rady MY, McGregor JL,
Friederich-Murray C. Enforcement of presumed-consent policy and
willingness to donate organs as identified in the European Union Survey:
the role of legislation in reinforcing ideology in pluralistic societies.
Health Policy 2009;90:26-31. CrossRef
28. Riyanti S, Hatta M, Norhafizah S, et
al. Organ donation by sociodemographic characteristics in Malaysia. Asian
Soc Sci 2014;10:265-72.
29. Wong LP. Knowledge, attitudes,
practices and behaviors regarding deceased organ donation and
transplantation in Malaysia’s multi-ethnic society: a baseline study. Clin
Transplant 2011;25:E22-31. CrossRef
30. Surveillance and Epidemiology Branch,
Centre for Health Protection, Department of Health, Hong Kong SAR
Government. Behavioural risk factor survey (April 2011): main report.
2012. Available from: http://www.chp.gov.hk/files/pdf/brfs_2011apr_en.pdf.
Accessed 2 Nov 2016.
31. Tsang E. Hong Kong to discuss organ
donation opt-out scheme following death of girl awaiting double lung
transplant. South China Morning Post. 2015 Oct 9.
32. Ugur ZB. Does presumed consent save
lives? Evidence from Europe. Health Econ 2015;24:1560-72. CrossRef
33. Buckley TA. The shortage of solid
organs for transplantation in Hong Kong: part of a worldwide problem. Hong
Kong Med J 2000;6:399-408.
34. Office of the Communications
Authority, Hong Kong SAR Government. Key communications statistics. 2016.
Available from:
http://www.ofca.gov.hk/en/media_focus/data_statistics/key_stat/. Accessed
2 Nov 2016.