Mesh-related complications from reconstructive surgery for pelvic organ prolapse in Chinese patients in Hong Kong
Hong
Kong Med J 2018 Aug;24(4):369–77 | Epub 31 Jul 2018
DOI: 10.12809/hkmj177173
© Hong Kong Academy of Medicine. CC BY-NC-ND 4.0
ORIGINAL ARTICLE
Mesh-related complications from reconstructive surgery
for pelvic organ prolapse in Chinese patients in Hong Kong
Osanna YK Wan, MRCOG, FHKAM (Obstetrics and
Gynaecology); Symphorosa SC Chan, MD, FHKAM (Obstetrics and Gynaecology);
Rachel YK Cheung, FHKAM (Obstetrics and Gynaecology), FHKCOG; Tony KH
Chung, MD, FRCOG
Department of Obstetrics and Gynaecology, The
Chinese University of Hong Kong, Prince of Wales Hospital, Shatin, Hong
Kong
Corresponding author: Dr Osanna YK Wan (osannawan@cuhk.edu.hk)
 Full
paper in PDF
Full
paper in PDF
Abstract
Introduction: Mesh-related
complications from reconstructive surgery for pelvic organ prolapse are
of international concern. The present study aimed to review the
incidence, management, and surgical outcomes of mesh-related
complications in a Chinese population compared with existing studies
involving Western populations.
Methods: This was an analysis of
a prospectively collected cohort. Laparoscopic sacrocolpopexy,
laparoscopic hystercolposacropexy, or transvaginal mesh surgery were
offered with or without concomitant vaginal hysterectomy or continence
surgery. Patients were followed up and mesh-related complications were
noted.
Results: Overall, 276 Chinese
women who received mesh surgery were included for data analysis. There
were 22 mesh-related complications found during a mean follow-up period
of 40 months. Mesh exposure accounted for 20 these complications;
significantly more occurred after transvaginal than after abdominal mesh
surgery (16 vs 4; P=0.01). Median duration from primary operation to the
time of mesh exposure detection was 12 months (interquartile
range=4.8-32.8 months). Ten patients required surgical excisions of
exposed mesh. The re-operation rate after mesh complications was 6.7%
(9/134) for transvaginal mesh surgery and 1.4% (2/142) for laparoscopic
sacrocolpopexy (P=0.03). All excisions were performed transvaginally and
95% remained well after surgery. Occurrence of mesh exposure was higher
in transvaginal mesh surgery (adjusted odds ratio=6.1; P=0.008), in
sexually active patients (adjusted odds ratio=5.4; P=0.002), and in
obese patients (adjusted odds ratio=3.7; P=0.046). Over 90% were
satisfied with the outcome, regardless of mesh complications.
Conclusions: The rates of mesh
exposure and re-operation were consistent with those reported in the
literature, suggesting no significant differences in outcome between
Chinese and Western patients for this type of surgery.
New knowledge added by this study
- This is among the first studies to report the intermediate incidence and management outcomes of mesh-related complications in the Chinese population in Hong Kong.
- Transvaginal mesh surgery, coital activity, and obesity were associated with a higher rate of mesh exposure and subsequent need of re-operation.
- Vaginal excisions of exposed mesh were usually successful; this can be done as an out-patient procedure with satisfactory outcome.
- A high satisfaction rate (97%) was noted.
- Dyspareunia and pelvic pain were rare complaints among Chinese women after mesh surgery, despite being common in Western populations.
- The rates of mesh exposure and re-operation for mesh-related complications tended to be lower for abdominal mesh surgery than for transvaginal mesh surgery, although the latter is less invasive and has a shorter operating time.
- Careful selection of patients, ie, patients with advanced stage of pelvic organ prolapse, older than 65 years, and sexually inactive, would benefit more from selecting transvaginal mesh surgery.
- Weight optimisation before operation may reduce mesh-related complications due to obesity.
Introduction
Traditional repair of pelvic organ prolapse has a
high recurrence risk of up to 30%, leading to development of mesh that
decreases anatomical recurrence.1 2 3
However, there has been recent public interest and media reports on
adverse events experienced by women after mesh reconstructive surgery,
especially in Western populations.4
5
Sacrocolpopexy was formerly the gold standard
treatment for apical compartment or vaginal vault prolapse and had
adequate evidence and support.3 6 However, sacrocolpopexy has a
longer learning curve and operating time than vaginal surgery.3 7 Transvaginal
mesh surgery was promoted as a good alterative option in terms of
anatomical correction and shorter operative time.3
7 8
A previous report on transvaginal mesh surgery for pelvic organ prolapse
showed a high rate of patient satisfaction and success in the Chinese
population in Hong Kong.9 The
incidence of mesh exposure has been reported to be 2% to 12% in
sacrocolpopexy,1 2 10 11 and 2.7% to 24% in transvaginal mesh surgery.12 13 14 15 Most
reports, including those from the United States Food and Drug
Administration4 and the New Zealand
Accident Compensation Corporation,5
have involved patients from Western countries and have advised caution
regarding the use of transvaginal mesh. There is limited information on
transvaginal mesh surgery in Asian populations. Ethnic differences have
been suggested as a significant factor for explaining differences in
prevalence of pelvic organ prolapse and in pelvic organ mobility.16 17 Possible
differences in response and complications from mesh surgery in different
populations may exist.
Some studies have reported that mesh exposure
usually occurs in the first few months after surgery13 14 18 19 but
studies with a longer follow-up are required to confirm this. Most studies
reporting mesh complications have focused on the time interval between
insertion of mesh and excision of the exposed mesh instead of detection of
mesh exposure.20 21 The exact location and size of the mesh exposure are
sometimes inadequately reported.14
20
Many studies have investigated mesh-related
complications from mesh reconstructive surgery for pelvic organ prolapse.
However, there is limited information on such complications in Asian
populations. The aim of the present study was to evaluate the incidence,
management, and surgical outcomes of mesh-related complications from mesh
reconstructive surgery for pelvic organ prolapse in a tertiary centre in a
Chinese population in Hong Kong.
Methods
The present study was an observational cohort study
conducted at the urogynaecology training centre at the Prince of Wales
Hospital, Hong Kong. All patients receiving mesh reconstructive surgery
for pelvic organ prolapse between 2005 and 2016 in the study centre were
recruited. Those who did not return for any postoperative follow-up were
excluded from the data analysis.
Laparoscopic sacrocolpopexy was offered to patients
with vaginal vault prolapse. In patients with stage III/IV uterine
prolapse, medically fit and sexually active, the option of concomitant
vaginal hysterectomy with laparoscopic sacrocolpopexy was offered.
Laparoscopic hystercolposacropexy was performed if patients requested
uterine preservation. Transvaginal mesh surgery, either anterior,
posterior, or total vaginal mesh, was available to patients with anterior
and posterior compartment prolapse, at least stage III or above, who were
aged ≥65 years, were more likely sexually inactive, or had recurrence of
pelvic organ prolapse after previous sacrocolpopexy/hystercolposacropexy.
Transvaginal mesh surgery was also offered with concomitant vaginal
hysterectomy or with uterine preservation. Insertion of vaginal mesh in
the posterior compartment was not performed after January 2013, after
evidence was published that showed no improvement from posterior vaginal
mesh compared with native tissue repair alone.22
23 Concomitant continence surgery
in terms of mid-urethral sling or laparoscopic colposuspension was
performed if patients had urodynamically confirmed stress incontinence.
All operations were performed by urogynaecologists or by urogynaecology
subspecialty trainees under direct supervision by urogynaecologists. All
demographic data, intra-operative findings, and immediate postoperative
events were documented in the patients’ medical records.
Patients were followed up at 2 to 4 months and 12
months after surgery, then annually after that. Earlier follow-up was
offered if the patient requested. During the follow-up consultation, the
attending gynaecologist asked patients about vaginal bleeding, pain,
dyspareunia, and the severity of any present symptoms. Vaginal examination
was performed to determine whether there was recurrence of pelvic organ
prolapse or mesh exposure, as recommended by International Continence
Society (ICS) and the International Urogynecological Association (IUGA).24 25
Patients were asked to subjectively assess the treatment outcome during
every postoperative clinic visit. Patients rated the outcome as “worse,
same, or better” compared with their preoperative condition. Location,
size, and area of mesh exposure were documented. Complications related
directly to the insertion of mesh were classified according to the joint
project of the IUGA and the ICS during the analysis of the database.24 Vaginal oestrogen cream was offered to patients with
mesh exposure if not contra-indicated.26
The option of conservative management or surgical excision of exposed mesh
was discussed with patients, depending on the severity, symptoms, and
their wishes. Treatment outcome with or without mesh-related complications
was also studied. All patients underwent the same study protocol and had
the same postoperative assessment on mesh complications according to a
standardised datasheet. The postoperative assessment was carried out by
urogynaecologists or trained gynaecologists.
Different variables were studied to investigate any
association with mesh complications. Patients were evaluated according to
whether they received abdominal or transvaginal mesh surgery.
Statistical analyses
Data were analysed using the SPSS Windows version
22.0 (IBM Corp, Armonk [NY], United States). Descriptive analysis was used
to study the demographics and incidence of mesh complications. Fisher’s
exact test, Chi squared test, student’s t test, and Mann-Whitney U
test were used for statistical comparisons between different study groups.
A P value of <0.05 was considered statistically significant. Multiple
logistic regression was performed for variables found to be statistically
significant in univariate analysis; odds ratio (OR) and 95% confidence
interval (CI) were also studied.
Results
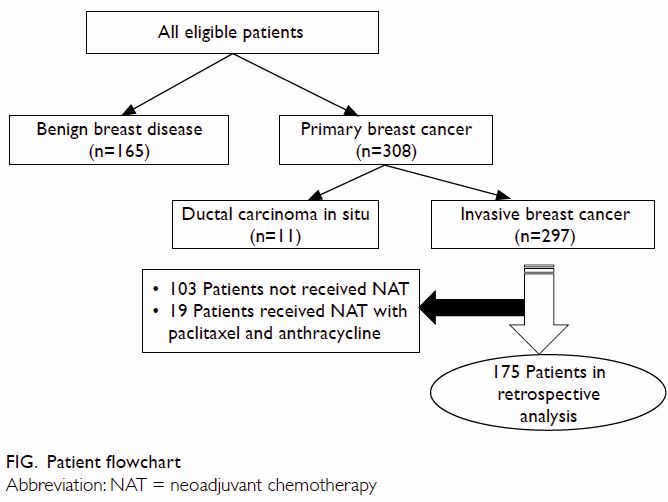
A total of 280 Chinese women received mesh
reconstructive surgery from March 2005 to December 2016. Four patients
were lost to follow-up. Therefore, 276 (98.6%) patients were included for
data analysis (Fig).
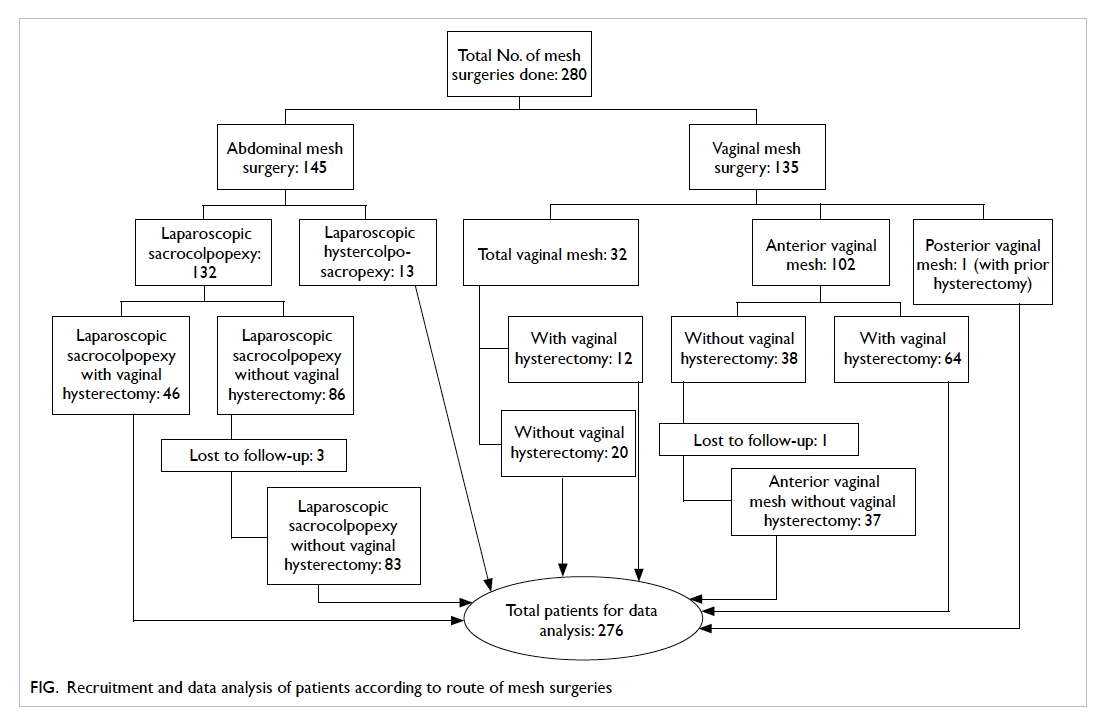
Figure. Recruitment and data analysis of patients according to route of mesh surgeries
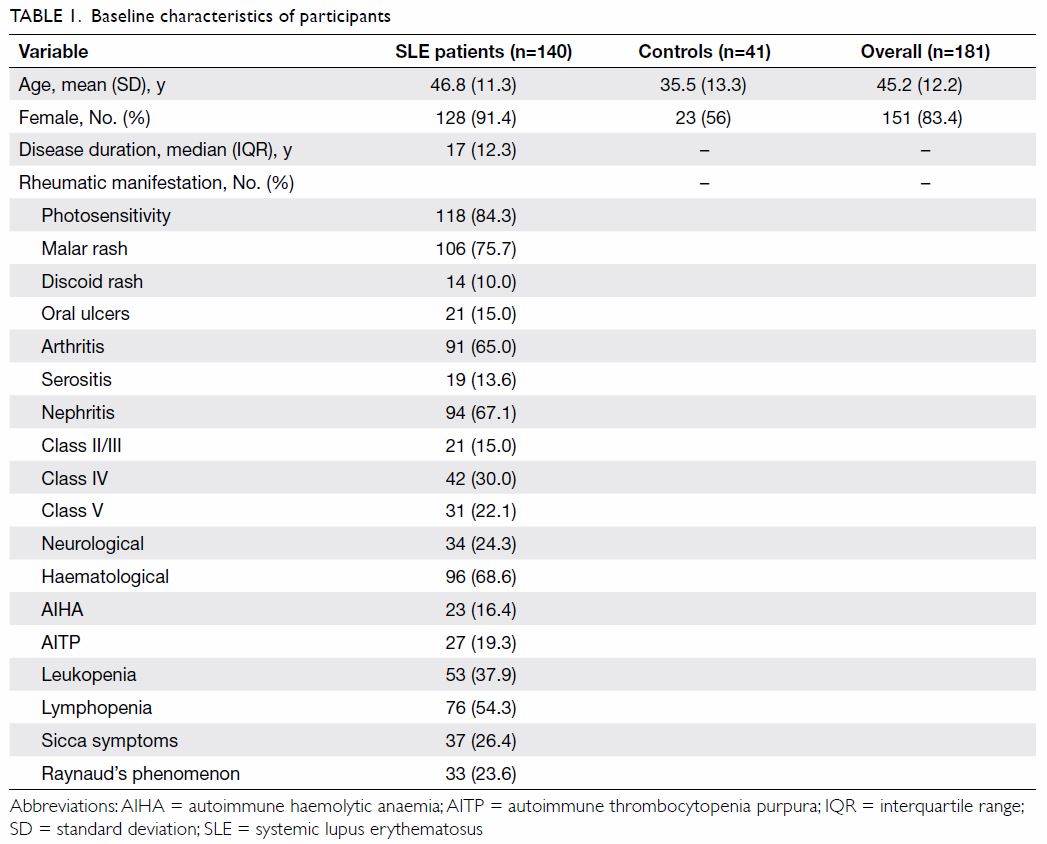
The demographics and background data of the study
population are presented in Table 1. Abdominal mesh surgery and transvaginal
mesh surgery, all with concomitant pelvic floor repair, were performed in
142 and 134 patients, respectively. Concomitant continence operation was
performed in 81 (29.3%) patients. Mean follow-up duration was 40 ± 1.47
months (range, 1-131 months).
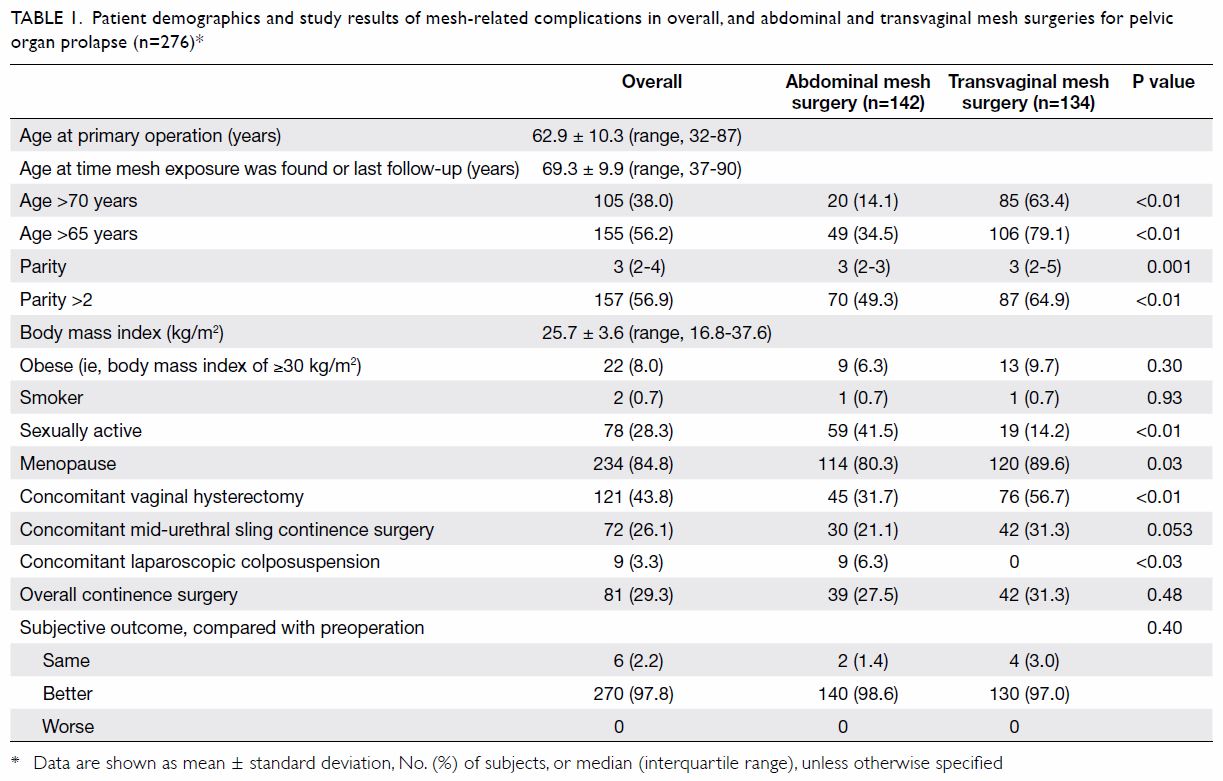
Table 1. Patient demographics and study results of mesh-related complications in overall, and abdominal and transvaginal mesh surgeries for pelvic organ prolapse (n=276)*
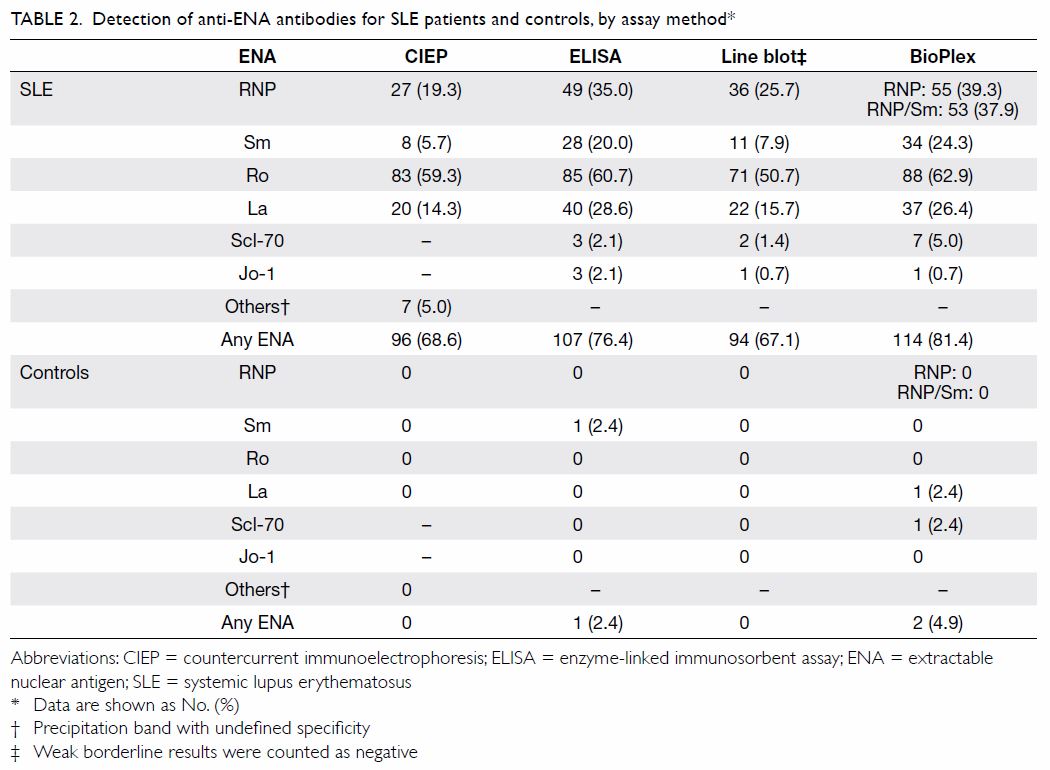
Mesh-related complications were identified in 22
(8.0%) patients, including vaginal mesh exposure in 20 (7.2%) patients and
intra-operative and perioperative complications in one (0.4%) patient each
(Table 2).
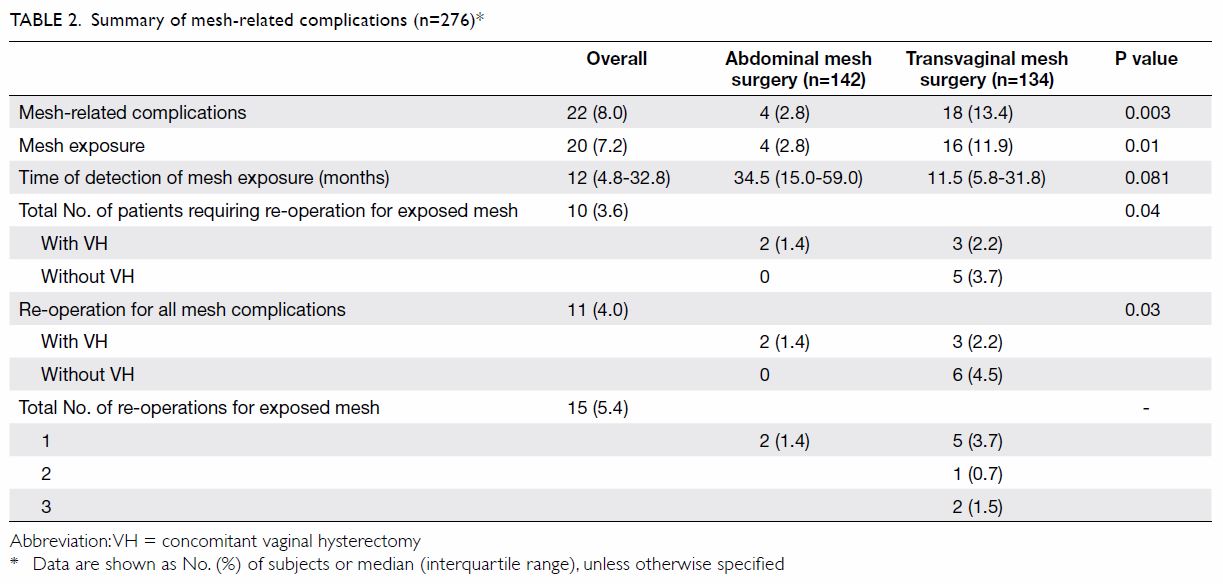
Table 2. Summary of mesh-related complications (n=276)
Intra-operatively, there was one bladder injury
during insertion of inferior trocar of the anterior vaginal mesh. The
involved trocar was immediately removed and re-inserted in another correct
surgical plane. Cystoscopy showed a small site of bladder perforation
without active bleeding nor urine leakage. No repair was necessary. No
mesh material was seen inside bladder. The patient recovered uneventfully
without other mesh-related complications in subsequent follow-up.
Perioperatively, one patient had mesh infection
after anterior vaginal mesh repair with abscess formation in the vulva,
requiring mesh removal 18 days after the primary operation. The infection
subsided with antibiotics and drainage, but the patient passed away at 7
weeks postoperatively due to other medical morbidities.
The incidence of mesh exposure was 2.8% in
abdominal and 11.9% in transvaginal mesh surgery (Table 2). Mesh exposure was most commonly found in
posterior vaginal wall (33.3%) followed by anterior vaginal wall (27.8%),
middle part of vaginal vault (22.2%), left and right vaginal vault
(16.7%). The mean ± standard deviation size of the exposed mesh was 1.2 ±
0.6 cm (range, 0.3-2 cm). Median duration from primary operation to the
time of first detection of mesh exposure was 12 months (interquartile
range [IQR]=4.8-32.8 months); the longest duration was 63 months. Median
time of detection was 11.5 months (IQR=5.8-31.8 months) in transvaginal
mesh surgery and 34.5 months (IQR=15.0-59.0 months) in abdominal mesh
surgery (P=0.081; Table 2). All patients with mesh exposure presented
with intermittent vaginal spotting and all involved only the vaginal
epithelium. None complained of dyspareunia, or vaginal or pelvic pain,
although half of them were sexually active.
Vaginal oestrogen cream was given to all 20
patients with mesh exposure; this treatment was successful in eight (40%)
patients. Two others were asymptomatic and opted for conservative
management. The remaining 10 required surgical excision of the exposed
mesh. The main indication for re-operation was vaginal spotting; no
re-operations were related to pelvic pain or dyspareunia. All surgical
excisions of exposed mesh were performed vaginally under local anaesthesia
on the same day, except for one patient who opted for general anaesthesia.
The median time between primary operation to first surgical excision of
exposed mesh was 14 months (IQR=8.8-37.3 months); the longest was 66
months. Mean ± standard deviation operating time for the surgical
excisions of exposed mesh was short, around 20 ± 6 minutes (range, 10-30
minutes) with estimated blood loss of 2 to 10 mL. Three patients required
repeated excisions with operating times of 22 ± 2 minutes (range, 20-23
minutes) and estimated blood loss of 7 to 12 mL. Another three, in whom
mesh exposure remained after first excision, opted not to have a second
excision because they were asymptomatic. Most (95%) patients were well at
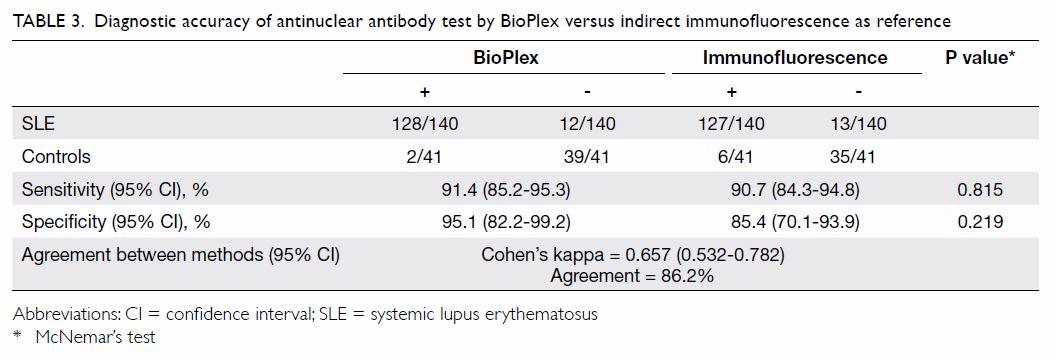
their latest follow-up. Clinical details of all the mesh-related
complications are listed with IUGA/ICS codes24
in Table 3.
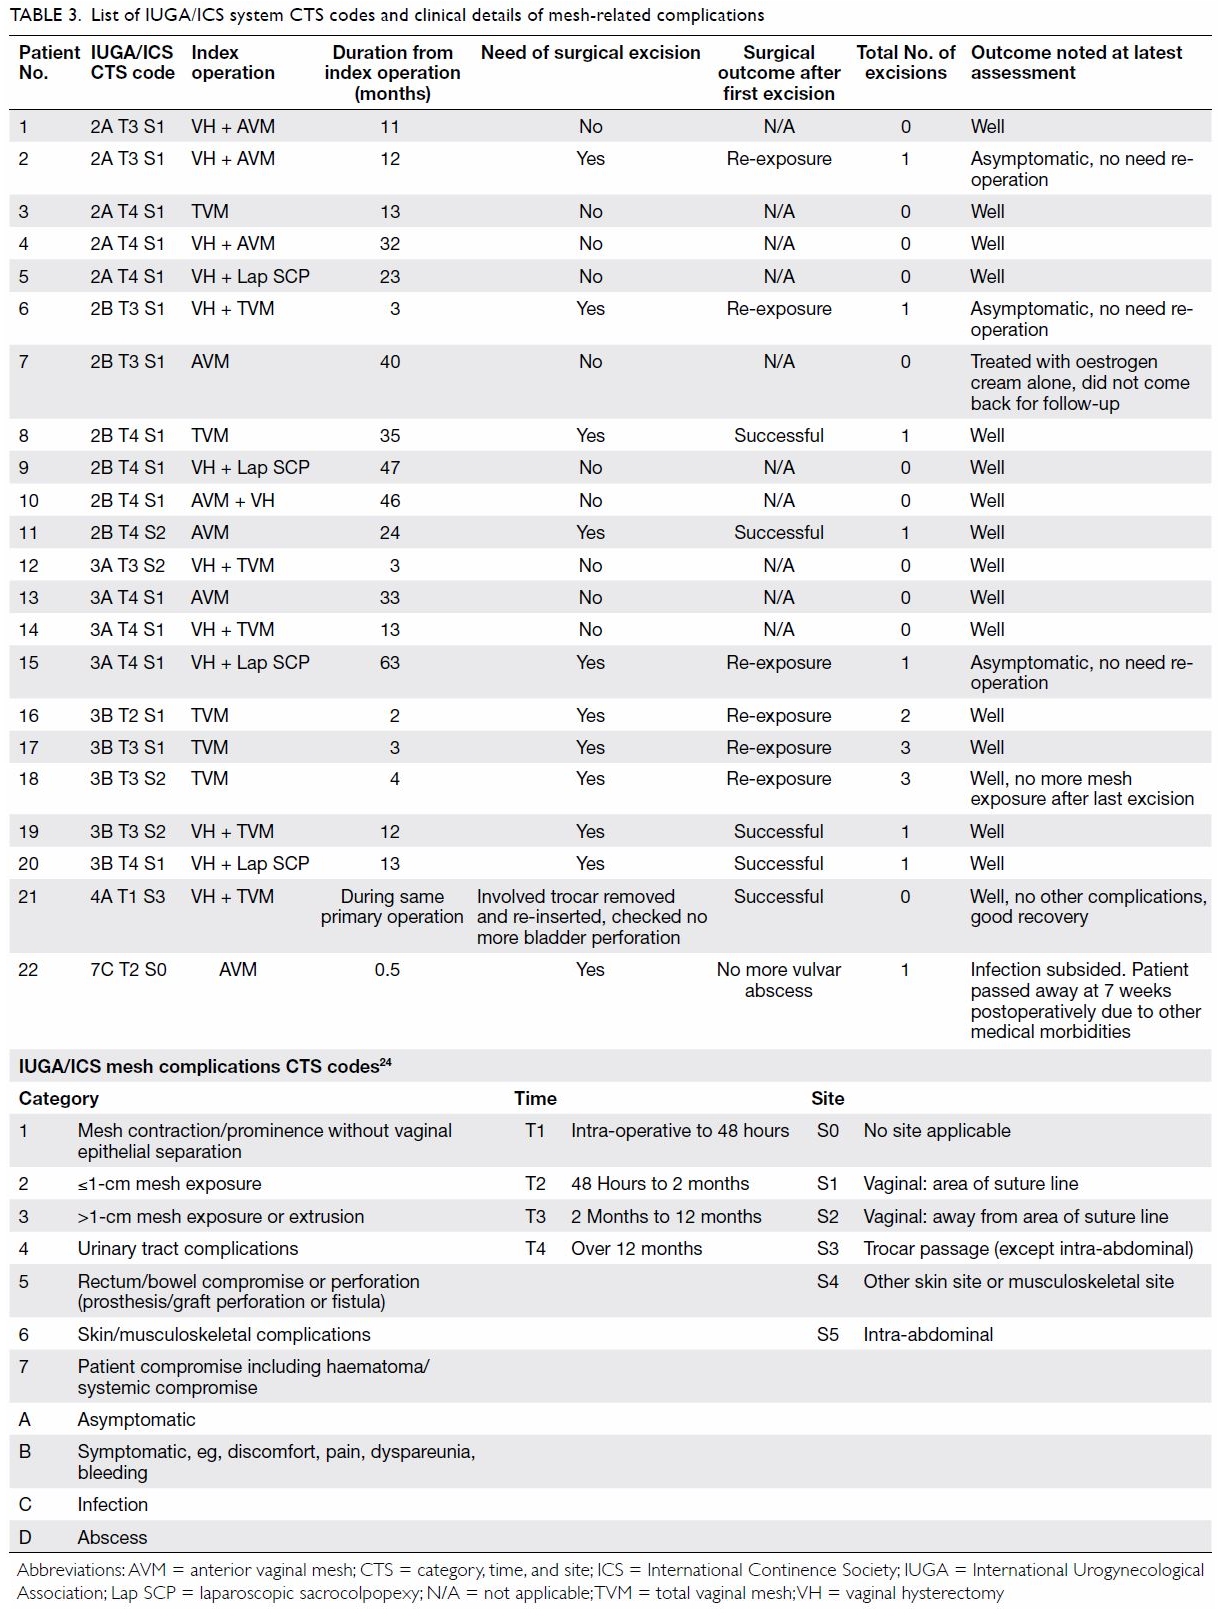
Table 3. List of IUGA/ICS system CTS codes and clinical details of mesh-related complications
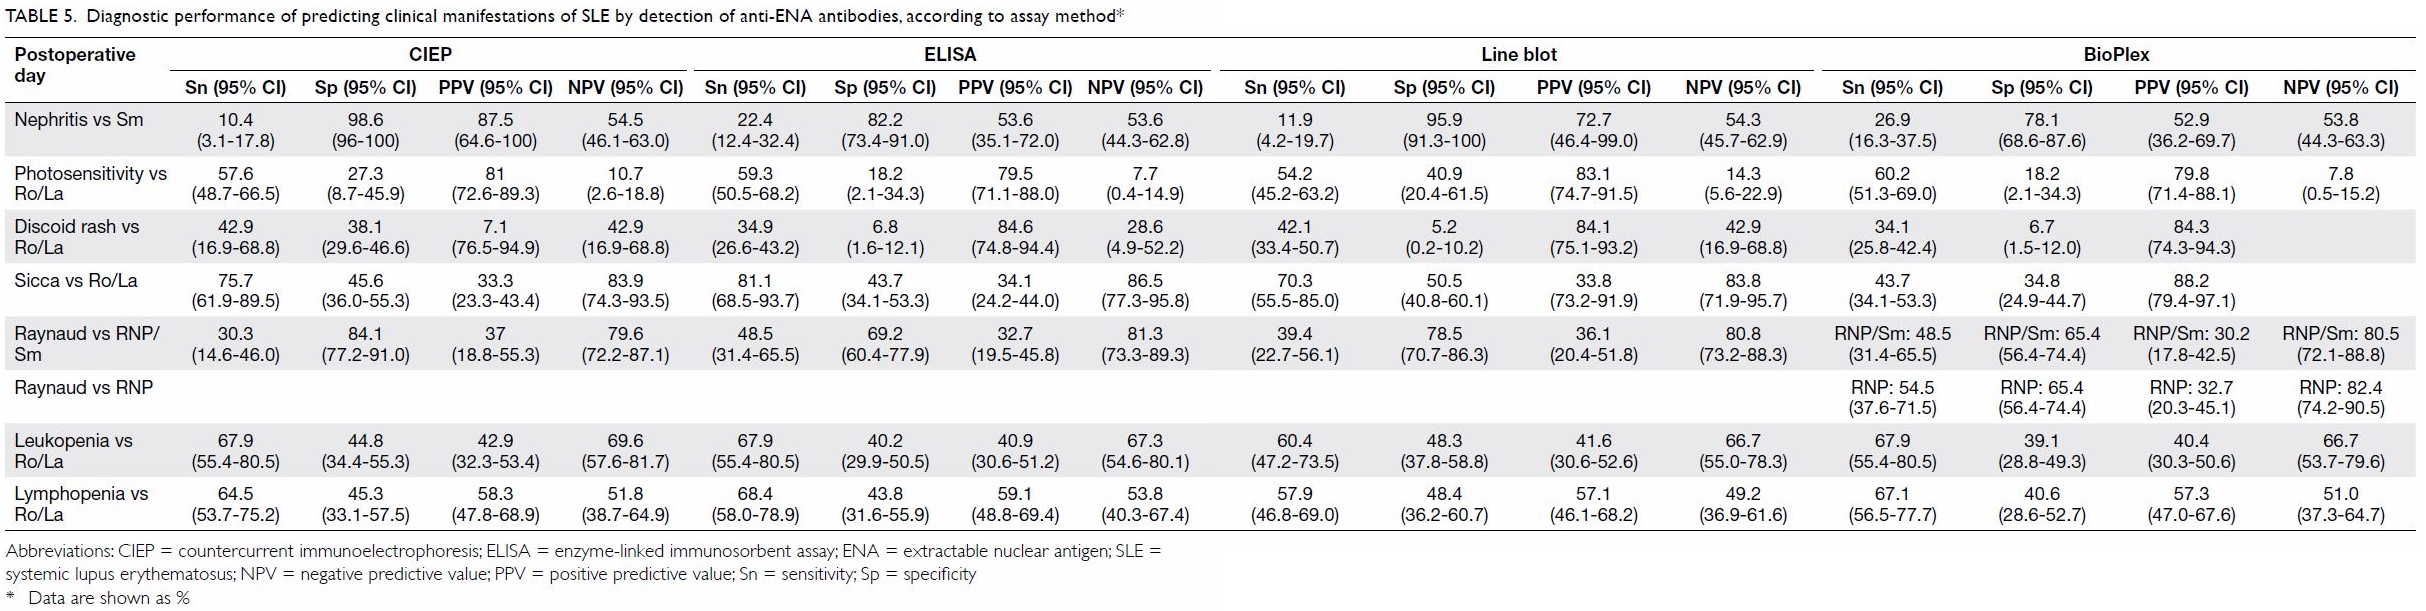
The relationships between various factors and mesh
exposure were explored (Table 4). Mesh exposure was more common in
transvaginal than in abdominal mesh surgery (OR=4.7; 95% CI=1.5-14.3;
P=0.007). Transvaginal mesh with posterior insertion was found to be
associated with increased risks of mesh-related complications (OR=4.3; 95%
CI=1.6-11.5; P=0.002). Total vaginal mesh surgery was also found to be a
significant factor (OR=5.0; 95% CI=1.8-13.6; P=0.002). Coital activity
(OR=2.8; 95% CI=1.1-6.9; P=0.03) and obesity (OR=4.7; 95% CI=1.5-14.4;
P=0.007) were also found to be associated with mesh exposure. No other
factors studied were associated with mesh exposure (Table 4).
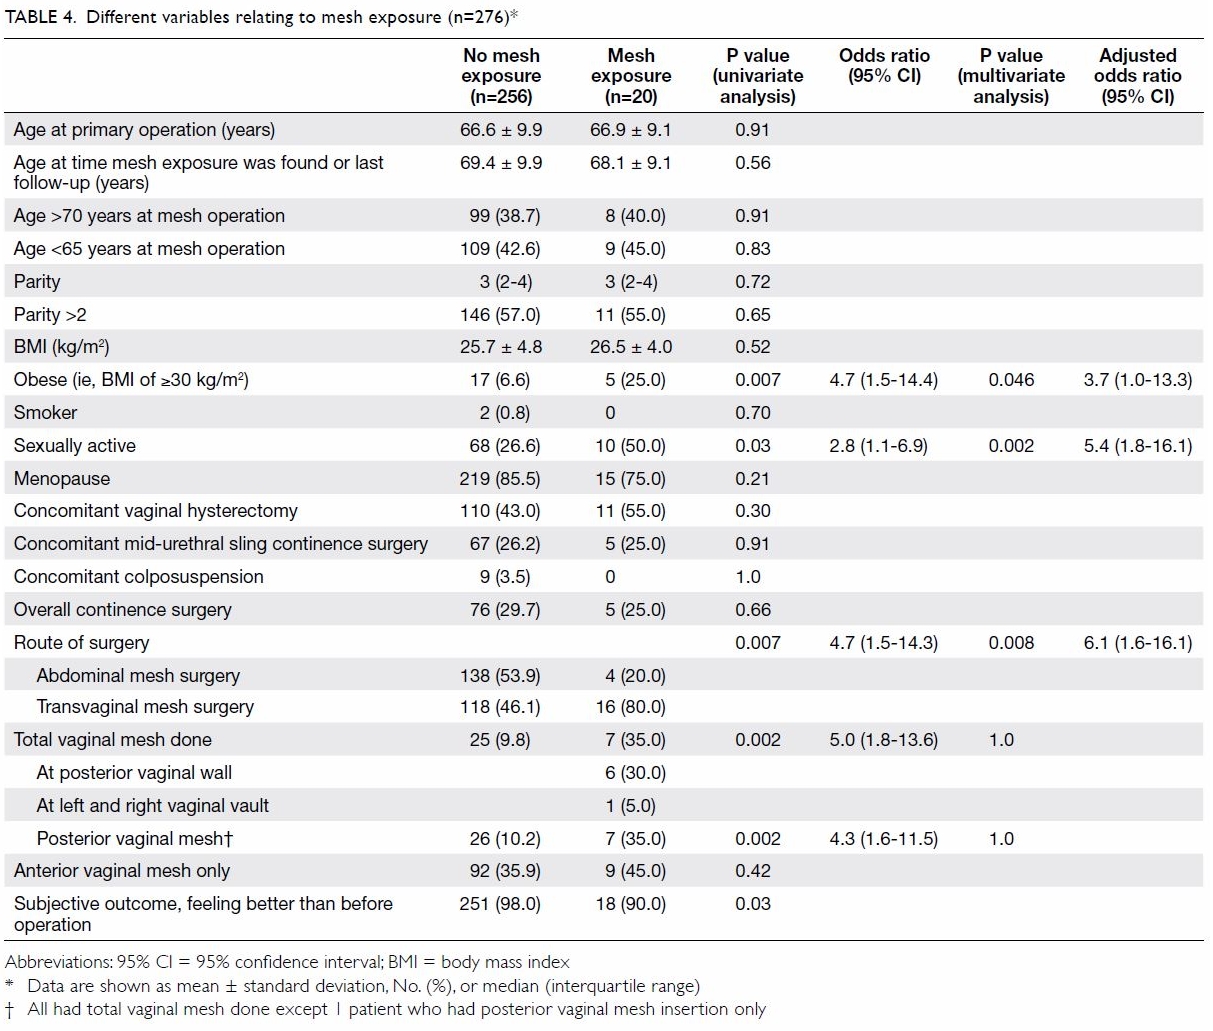
Table 4. Different variables relating to mesh exposure (n=276)
Multiple logistic regression was performed on these
significant variables. This revealed that transvaginal mesh surgery
(adjusted OR=6.1; 95% CI=1.6-16.1), coital activity (adjusted OR=5.4; 95%
CI=1.8-16.1), and obesity (adjusted OR=3.7; 95% CI=1.0-13.3) remained the
significant factors associated with mesh exposure (Table 4).
Discussion
Our study aimed to evaluate the incidence of
mesh-related complications from mesh reconstructive surgery for pelvic
organ prolapse and associated surgical outcomes in a tertiary unit over
the past 11 years. This objective was fulfilled with the study carried out
according to its initial design.
The main mesh-related complication reported was
vaginal mesh exposure, which is consistent with previous studies on
mesh-related complications.2 4 20 The
findings in this study concur with other reports that the most important
risk factor of mesh exposure is route of surgery.11
20 Total vaginal mesh repair was
associated with a higher rate of mesh exposure than was anterior vaginal
mesh insertion, in agreement with a previous study.13 The posterior vagina was the most common site of mesh
exposure in the present study; therefore, avoiding posterior vaginal mesh
repair might reduce the incidence of mesh exposure. A lower rate of mesh
exposure from transvaginal mesh surgery is expected in future if insertion
of posterior vaginal mesh is stopped; studies will be required to confirm
this.
The rates of mesh exposure in transvaginal mesh
surgery and in laparoscopic sacrocolpopexy in the present study were
within the range of rates reported in the literature. The re-operation
rates for mesh-related complication were similar to those reported in
other studies: 2% to 13.2% for transvaginal14
20 and 1.3% to 5% for abdominal
mesh surgery.1 20 26 All mesh
surgeries in the present study were performed by or with trained
urogynaecologists, but that might not be the case in other hospitals.14 20 21
Coital activity was associated with higher risks of
mesh exposure, in agreement with other study populations.12 18 20 Obesity is known to have many implications for
health, including as an independent risk factor for perioperative surgical
site infection in vaginal surgery,27
although this is not mentioned specifically in other studies on
mesh-related complications. Patients ought to be counselled to attempt
weight reduction before a prolapse operation because weight loss might
lower the risk of mesh-related complications, in addition to the general
benefits of maintaining a body mass index in the normal range.
Dyspareunia, pelvic, or vaginal pain are among the
most common distressing symptoms reported in the literature4 11 20 21 but these
were not reported in this study cohort. This might be explained by
differences in the interpretation of ‘discomfort’ from mesh-related
complications between Chinese and Western populations.
The median time between surgery and detection of
mesh exposure in the present study was within the range reported in other
studies.12 13 17 18 Mesh exposure tended to be found earlier in
transvaginal than abdominal mesh surgery, but this difference was not
significant. Patients should be informed about the possible symptoms of
mesh exposure and advised to seek medical advice should they experience
them.
There was one mesh infection with abscess formation
and one mild bladder injury over the 11 years of study. Otherwise there
were no serious mesh-related complications, such as mesh exposure to the
bladder or bowel, or spondylodiscitis.15
19 21
Demographic differences were found between the two
groups of patients receiving abdominal and transvaginal mesh surgery due
to the different selection criteria, as anticipated from the beginning of
the study design. Younger patients tend to have higher risks of
re-interventions from mesh surgery.28
29 Thus, younger patients are more
often offered abdominal instead of vaginal mesh surgery.
Concomitant vaginal hysterectomy and concomitant
continence surgery were not associated with mesh complications in this
study, consistent with one review on abdominal sacrocolpopexy10 but in contrast to another.11
Smoking has been found to be associated with mesh exposure.12 However, the prevalence of smoking was low in this
cohort and this association was not detected. Different ages have been
found to be associated with higher risk of mesh exposure in other studies,20 26
but this was not confirmed in the present study population.
Strengths
The objective was clearly defined and fulfilled.
The loss to follow-up rate was low (only 1.4%) and data collection was
complete without missing data, reducing possible bias in results analysis.
The high follow-up rate could be due to the low medical cost for follow-up
and geographical convenience in Hong Kong. A search of the literature
suggests that the present study is among the first with a low
loss-to-follow-up rate investigating the incidence of mesh-related
complications from mesh reconstructive surgery in a Chinese population.
Limitations
The 11-year duration of the present study, although
long, could be too short for all complications or recurrences of mesh
exposure to become apparent. No power calculation was used, because
patients only with an advanced stage of pelvic organ prolapse are be
offered mesh surgeries, and not all women with advanced pelvic organ
prolapse opt for mesh surgery, knowing the possible risks. This study
might be underpowered to detect other possible factors associated with
mesh complications. However, this study can provide important information
on the complications associated with mesh surgeries from a population that
has not been well investigated.
This was a single-centre study with specific
selection criteria for different routes of mesh surgery. All types of mesh
surgery for pelvic organ prolapse were performed by the urogynaecology
team; this might limit the generalisability of the results to other
centres in which operations are performed by non-urogynaecologists.14 20 21 However, it is common practice in other study centres
in Hong Kong for urogynaecologists or gynaecologists experiences in
vaginal surgery to perform mesh surgery for pelvic organ prolapse.
The IUGA/ICS coding24
for mesh-related complications was performed retrospectively during
database analysis. However, all data needed for the coding were available.
Finally, the follow-up assessment was performed by the same team of
surgeons; this might lead to potential reporting bias (on the part of the
patient and the clinician). However, the reporting of mesh exposure or
complication was an objective clinical decision, with the use of a
standardised datasheet and would not be largely affected.
Conclusions
Careful selection of patients and intensive
training for surgeons would help to reduce the incidence of mesh-related
complications from reconstructive surgery for pelvic organ prolapse. The
present study found that the incidence of mesh-related complications and
the re-operation rate after mesh surgery in Chinese women were consistent
with those reported in the Western populations. The incidence of
mesh-related complications tended to be lower after abdominal than after
transvaginal mesh surgery. Pelvic pain and dyspareunia were rare
complaints independent of the occurrence of mesh complications. Surgical
outcomes after mesh surgery were satisfactory despite some cases of mesh
exposure. Longer-term studies with more patients are needed before
definitive conclusions can be drawn.
Author contributions
Concept or design: OYK Wan, SSC Chan, RYK Cheung.
Acquisition of data: OYK Wan, SSC Chan.
Analysis or interpretation of data: OYK Wan.
Drafting of the article: OYK Wan.
Critical revision for important intellectual content: SSC Chan, RYK Cheung, TKH Chung.
Acquisition of data: OYK Wan, SSC Chan.
Analysis or interpretation of data: OYK Wan.
Drafting of the article: OYK Wan.
Critical revision for important intellectual content: SSC Chan, RYK Cheung, TKH Chung.
Funding/support
This research received no specific grant from any
funding agency in the public, commercial, or not-for-profit sectors.
Declaration
The authors have no conflicts of interest to
disclose. All authors had full access to the data, contributed to the
study, approved the final version for publication, and take responsibility
for its accuracy and integrity. Part of this study was presented as a
poster at the International Continence Society 47th Annual Meeting in
Florence, Italy, 12-15 September 2017.
Ethical approval
Ethical approval was obtained from local institute
(The Joint Chinese University of Hong Kong–New Territories East Cluster
Clinical Research Ethics Committee) [CREC 2015.125].
References
1. Olsen AL, Smith VJ, Bergstrom JO,
Colling JC, Clark AL. Epidemiology of surgically managed pelvic organ
prolapse and urinary incontinence. Obstet Gynecol 1997;89:501-6. Crossref
2. Morling JR, McAllister DA, Agur W, et
al. Adverse events after first, single, mesh and non-mesh surgical
procedures for stress urinary incontinence and pelvic organ prolapse in
Scotland, 1997-2016: a population-based cohort study. Lancet
2017;389:629-40. Crossref
3. Maher C, Baessler K, Glazener CM, Adams
EJ, Hagen S. Surgical management of the pelvic organ prolapse in women: a
short version Cochrane review. Neurourol Urodyn 2008;27:3-12. Crossref
4. Food Drug Administration. Urogynecologic
surgical mesh: update on serious complications associated with
transvaginal placement of surgical mesh for pelvic organ prolapse. Jul
2011. Available from:
https://www.fda.gov/downloads/medicaldevices/safety/alertsandnotices/ucm262760.pdf.
Accessed 14 Nov 2017.
5. Accident Compensation Corporation, New
Zealand Government. Treatment injury claims, surgical meshrelated claim
data, from 1 July 2005 to 30 June 2017. Available from:
https://www.acc.co.nz/assets/provider/surgical-mesh-data-2005-2017.pdf.
Accessed 17 Nov 2017.
6. National Institute for Health and Care
Excellence. Sacrocolpopexy using mesh to repair vaginal vault prolapse.
Interventional procedures guidance. Available from:
https://www.nice.org.uk/guidance/ipg583. Accessed 4 Nov 2017.
7. Maher CF, Feiner B, DeCuyper EM, Nichlos
CJ, Hickey KV, O’Rourke P. Laparoscopic sacral colpopexy versus total
vaginal mesh for vaginal vault prolapse: a randomized trial. Am J Obstet
Gynecol 2011;204:360.e1-7. Crossref
8. Cao Q, Chen YS, Ding JX, et al.
Long-term treatment outcomes of transvaginal mesh surgery versus
anteriorposterior colporrhaphy for pelvic organ prolapse. Aust N Z J
Obstet Gynaecol 2013;53:79-85. Crossref
9. Fan HL, Chan SS, Cheung RY, Chung TK.
Tension-free vaginal mesh for the treatment of pelvic organ prolapse in
Chinese women. Hong Kong Med J 2013;19:511-7. Crossref
10. Nygaard IE, McCreery R, Brubaker L, et
al. Abdominal sacrocolpopexy: a comprehensive review. Obstet Gynecol
2004;104:805-23. Crossref
11. de Tayrac R, Sentilhes L.
Complications of pelvic organ prolapse surgery and methods of prevention.
Int Urogynecol J 2013;24:1859-72. Crossref
12. Mourtialon P, Letouzey V, Eglin G, de
Tayrac R, French Ugytex Study Group. Cystocele repair by vaginal route:
comparison of three different surgical techniques of mesh placement. Int
Urogynecol J 2012;23:699-706. Crossref
13. Withagen MI, Vierhout ME, Hendriks JC,
Kluivers KB, Milani AL. Risk factors for exposure, pain, and dyspareunia
after tension-free vaginal mesh procedure. Obstet Gynecol 2011;118:629-36.
Crossref
14. Quemener J, Joutel N, Lucot JP, et al.
Rate of re-interventions after transvaginal pelvic organ prolapse repair
using partially absorbable mesh: 20 months median follow-up outcomes. Eur
J Obstet Gynecol Reprod Biol 2014;175:194-8.Crossref
15. El-Khawand D, Wehbe SA, O’Hare PG 3rd,
Arunachalam D, Vakili B. Risk factors for vaginal mesh exposure after
mesh-augmented anterior repair: a retrospective cohort study. Female
Pelvic Med Reconstr Surg 2014;20:305-9. Crossref
16. Whitcomb EL, Rortveit G, Brown JS, et
al. Racial differences in pelvic organ prolapse. Obstet Gynecol
2009;114:1271-7. Crossref
17. Cheung RY, Shek KL, Chan SS, Chung TK,
Dietz HP. Pelvic floor muscle biometry and pelvic organ mobility in East
Asian and Caucasian nulliparae. Ultrasound Obstet Gynecol 2015;45:599-604.
Crossref
18. Chanelles O, Poncelet C. Late vaginal
mesh exposure after prolapse repair. J Gynecol Obstet Biol Reprod (Paris)
2010;39:672-4. Crossref
19. Miklos JR, Chinthakanan O, Moore RD,
et al. The IUGA/ICS classification of synthetic mesh complications in
female pelvic floor reconstructive surgery: a multicenter study. Int
Urogynecol J 2016;27:933-8. Crossref
20. Warembourg S, Labaki M, de Tayrac R,
Costa P, Fatton B. Reoperations for mesh-related complications after
pelvic organ prolapse repair: 8-year experience at a tertiary referral
center. Int Urogynecol J 2017;28:1139-51. Crossref
21. Chughtai B, Barber MD, Mao J, Forde
JC, Normand ST, Sedrakyan A. Association between the amount of vaginal
mesh used with mesh erosions and repeated surgery after repairing pelvic
organ prolapse and stress urinary incontinence. JAMA Surg 2017;152:257-63.
Crossref
22. Paraiso MF, Barber MD, Muir TW,
Walters MD. Rectocele repair: a randomized trial of three surgical
techniques including graft augmentation. Am J Obstet Gynecol
2006;195:1762-71. Crossref
23. Maher C, Feiner B, Baessler K, Schmid
C. Surgical management of pelvic organ prolapse in women. Cochrane
Database Syst Rev 2013;(4):CD004014. Crossref
24. Haylen BT, Freeman RM, Swift SE, et
al. An International Urogynecological Association (IUGA)/International
Continence Society (ICS) joint terminology and classification of the
complications related directly to the insertion of prostheses (meshes,
implants, tapes) & grafts in female pelvic floor surgery. Int
Urogynecol J 2011;22:3-15. Crossref
25. Toozs-Hobson P, Freeman R, Barber M,
et al. An International Urogynecological Association (IUGA)/International
Continence Society (ICS) joint report on the terminology for reporting
outcomes of surgical procedures for pelvic organ prolapse. Int Urogynecol
J 2012;23:527-35. Crossref
26. Committee opinion no. 694: Management
of mesh and graft complications in gynecologic surgery. Obstet Gynecol
2017;129:e102-8. Crossref
" target="_blank">CrossRef
27. Chen CC, Collins SA, Rodgers AK,
Paraiso MF, Walters MD, Barber MD. Perioperative complications in obese
women vs normal-weight women who undergo vaginal surgery. Am J Obstet
Gynecol 2007;197:98.e1-8. Crossref
28. Achtari C, Hiscock R, O’Reilly BA,
Schierlitz L, Dwyer PL. Risk factors for mesh erosion after transvaginal
surgery using polypropylene (Atrium) or composite
polypropylene/polyglactin 910 (Vypro II) mesh. Int Urogynecol J Pelvic
Floor Dysfunct 2005;16:389-94. Crossref
29. Chughtai B, Mao J, Buck J, Kaplan S,
Sedrakyan A. Use and risks of surgical mesh for pelvic organ prolapse
surgery in women in New York state: population based cohort study. BMJ
2015;350:h2685. Crossref