Treatment of cutaneous angiosarcoma of the scalp and face in Chinese patients: local experience at a regional hospital in Hong Kong
Hong
Kong Med J 2018 Feb;24(1):25–31 | Epub 12 Jan 2018
DOI: 10.12809/hkmj176813
© Hong Kong Academy of Medicine. CC BY-NC-ND 4.0
ORIGINAL ARTICLE
Treatment of cutaneous angiosarcoma of the scalp and
face in Chinese patients: local experience at a regional hospital in Hong
Kong
TL Chow, FRCS (Edin), FHKAM (Surgery)1;
Wilson WY Kwan, FRCS (Edin), FHKAM (Surgery)1; CK Kwan, FRCR,
FHKAM (Radiology)2
1 Head and Neck Division, Department of
Surgery, United Christian Hospital, Kwun Tong, Hong Kong
2 Department of Oncology, United
Christian Hospital, Kwun Tong, Hong Kong
Corresponding author: Dr TL Chow (chowtl@ha.org.hk)
 Full
paper in PDF
Full
paper in PDF
Abstract
Introduction: Angiosarcoma is a
rare aggressive sarcoma that occurs mostly in the skin of the head and
neck in the elderly population. The optimal management is dubious and
most studies are from Caucasian populations. We aimed to examine the
treatment and outcome of this disease in Chinese patients.
Methods: Data of patients with
histopathologically verified cutaneous angiosarcoma of the head and neck
during December 1997 to September 2016 were retrieved from our hospital
cancer registry. The demographic data, clinicopathological information,
modality of treatment, and outcomes were reviewed.
Results: During the study
period, 17 Chinese patients were treated. Their median age was 81 years.
The tumours were present in the scalp only (n=11), face only (n=4), or
both scalp and face (n=2). Only two patients had distant metastases. The
modalities of treatment were surgery (n=6), surgery and adjuvant
radiotherapy (n=1), palliative radiotherapy (n=5), or palliative
chemotherapy (n=3). The remaining two patients refused any treatment
initially. Of the seven patients treated surgically, there were four
local and two regional recurrences. The median time to relapse was 7.5
months. Overall, 16 patients had died; causes of death were
disease-related in 12 whereas four other patients died of inter-current
illnesses. One patient was still living with the disease. The median
overall survival was 11.1 months and the longest overall survival was 42
months.
Conclusion: The outcome of
angiosarcoma in our series is poor. A high index of suspicion is
mandatory for prompt diagnosis. Adjuvant radiotherapy is recommended
following surgery. The benefit and role of systemic treatment in various
combinations with surgery or radiotherapy require further study.
New knowledge added by this study
- Reports of angiosarcoma of the scalp and face in the Chinese population are limited. Patient survival in this local study was worse than that of other studies.
- Literature review in this study supports the use of adjuvant radiotherapy to improve angiosarcoma control.
- An aggressive but not too radical surgery for head and neck cutaneous lesions is advocated.
- Combination therapy (surgery, radiotherapy, and systemic treatment) in various combinations should be considered.
Introduction
Angiosarcoma is a rare form of sarcoma of vascular
origin. It is notorious for its aggressive and relentless progression with
frequent local recurrence and distant metastasis.1
Owing to its scarcity and innocuous appearance at an early stage mimicking
an ordinary bruise or benign haemangioma, correct diagnosis is often
delayed for several months. This problem is compounded further because
most patients with angiosarcoma are elderly with frailty and co-morbidity,
and prognosis after surgery as the definitive therapy is gloomy. The
5-year overall survival (OS) has been variously reported as 24% to 35%.1 2
When radiotherapy (RT) is given as the main treatment, median survival is
only 8 months.3
Almost half (43%) of angiosarcomas originate from
the skin of the head and neck.1 2 Compared with truncal and
extremity angiosarcoma, the prognosis of cutaneous angiosarcoma (CAS) of
the head and neck is even worse. Perez et al2
indicated a greater need for flap or graft reconstruction after tumour
extirpation for head and neck CAS (HNCAS), a positive resection margin in
50%, and 5-year OS of 21.5%. Surgery was conventionally regarded as the
mainstay of therapy for HNCAS. Because of the poor results and frequent
margin involvement (78%),4 a
multidisciplinary approach with adjuvant RT has been advocated.
To the best of our knowledge, most articles about
HNCAS derived from a Caucasian population. We are not aware of any
reported series from ethnic Chinese populations. We therefore conducted
this retrospective study of HNCAS in the Chinese patients managed in our
hospital over the past two decades. Demographic data, clinicopathological
information, modality of treatment, and outcomes were reviewed. The latest
approaches to the treatment of this devastating disease are also
discussed.
Methods
Records of patients with histopathologically
verified HNCAS from December 1997 to September 2016 were captured from the
head and neck cancer registry of our department. Only Chinese patients
were recruited. Patient data were prospectively collected and regularly
updated in the registry.
Tumours were classified as a unifocal/localised
versus multifocal/diffuse form. Unifocal/localised tumour was
characterised by a discrete lesion without macroscopic satellitosis; it
was considered operable and potentially curable. If gross satellite
lesions were present or the main tumour was too extensive to be removed
surgically, it was regarded as a multifocal/diffuse tumour that was
probably incurable. Superficial tumours were those confined to the skin
and subcutaneous tissue. Conversely, deep tumours were defined as
transgression beyond the subcutaneous layer, for example encroaching on
the underlying muscle or bone.
If the tumour was resectable, a wide excision with
at least a 3-cm margin was performed. The defects were reconstructed by
local scalp flap/ skin graft (scalp primary) or submental flap (face
primary).5 Neck dissection was
performed only in the presence of clinical or radiological evidence of
nodal spread. Adjuvant RT was not routinely administered. When disease was
deemed inoperable or the patient was unfit for surgery, palliative RT or
chemotherapy would be considered.
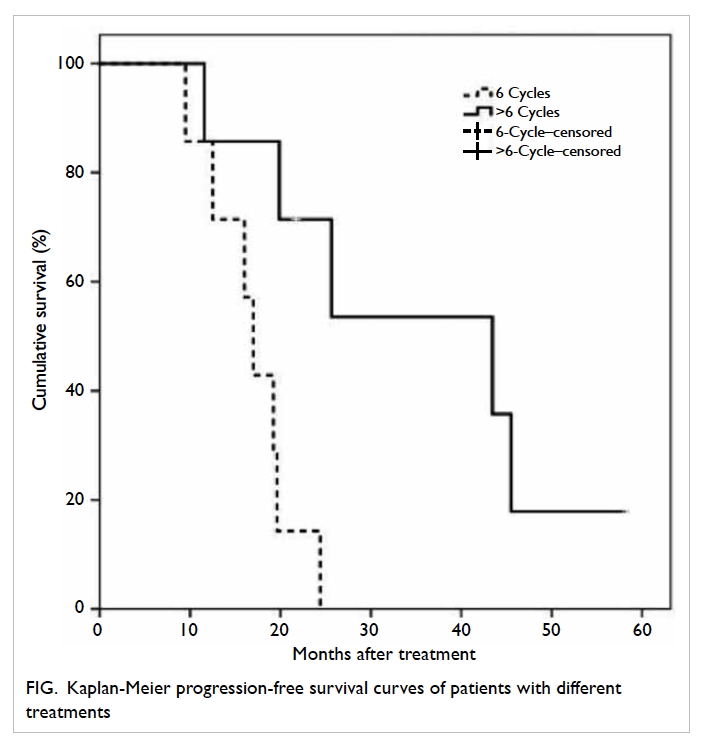
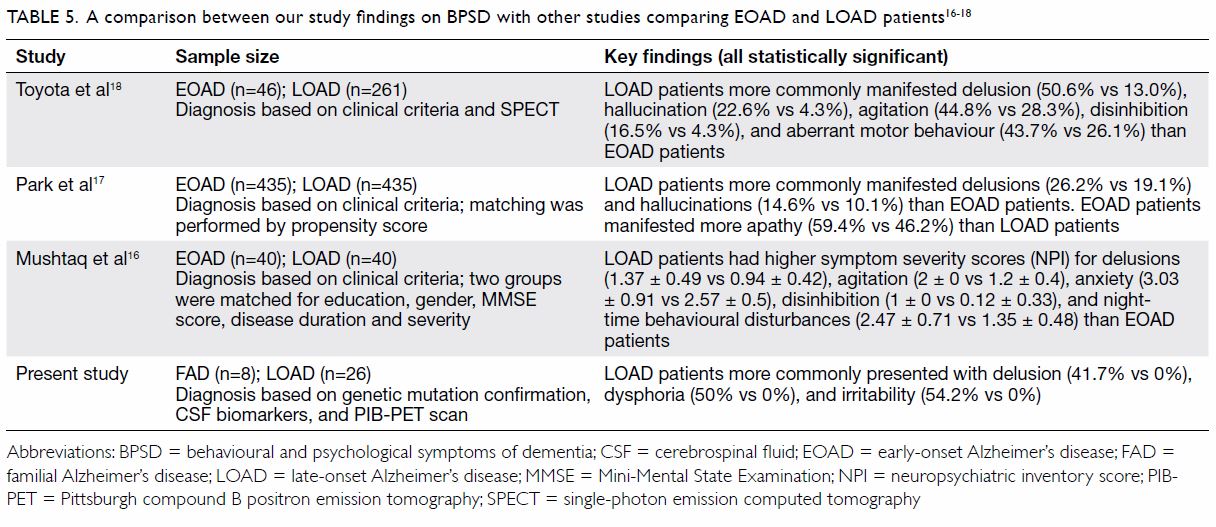
The OS was calculated from the date of diagnosis to
patient death or last follow-up, and is expressed in Kaplan-Meier curve.
The data were computed using the SPSS (Windows version 20.0; IBM Corp,
Armonk [NY], United States). The principles outlined in the 2013 version
of the Declaration of Helsinki have been followed.
Results
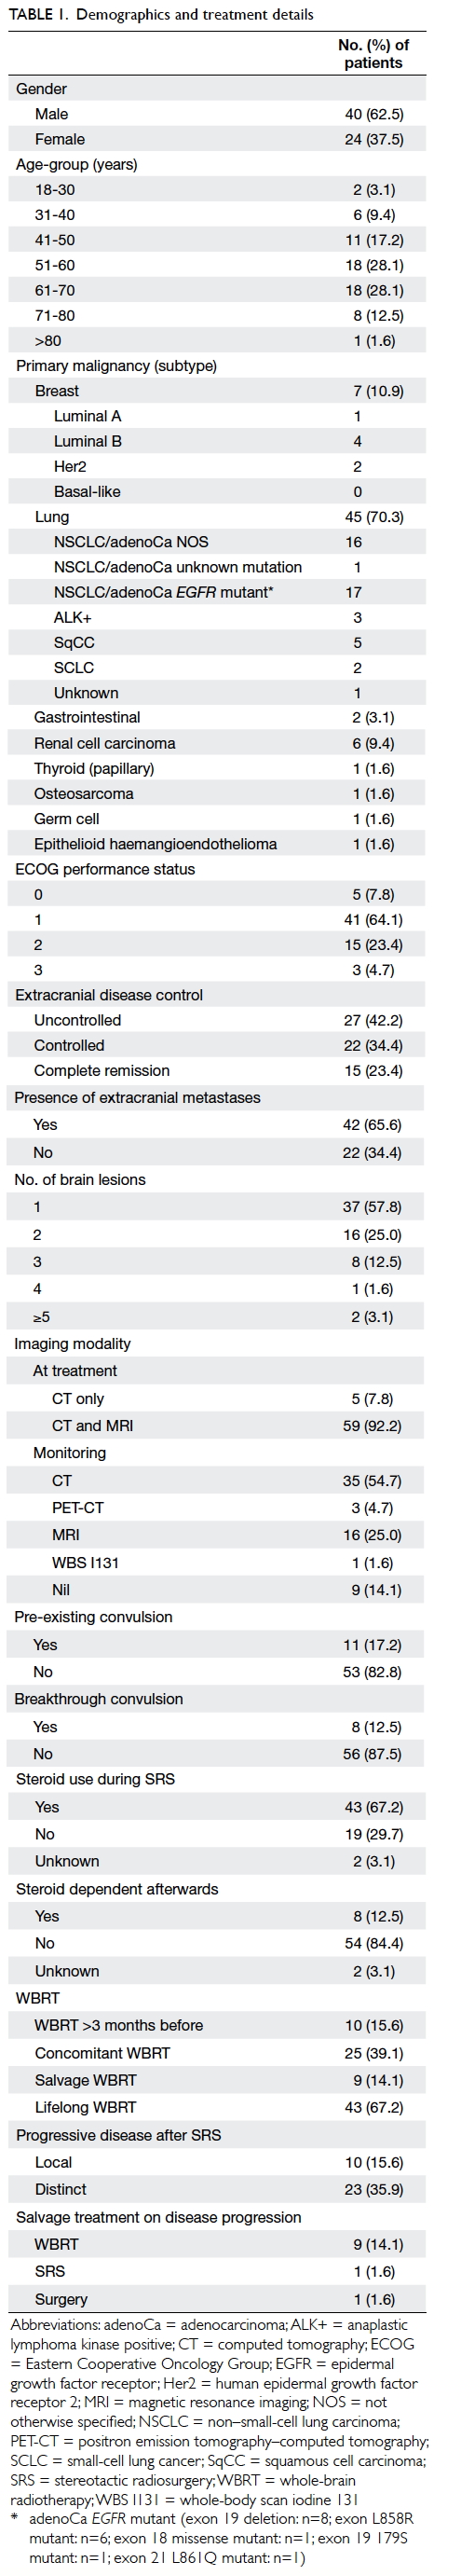
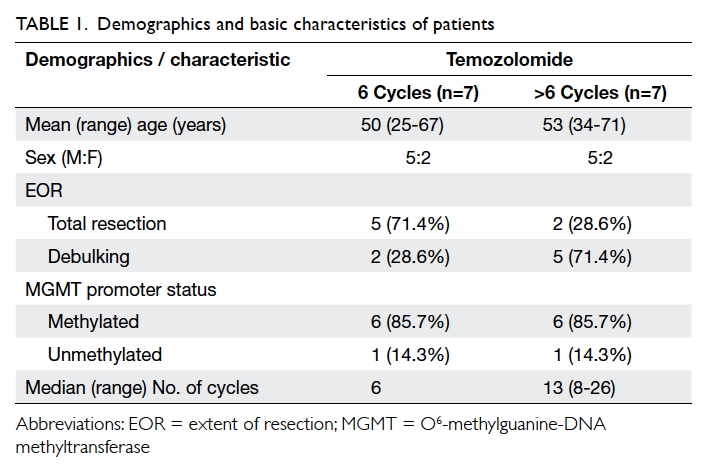
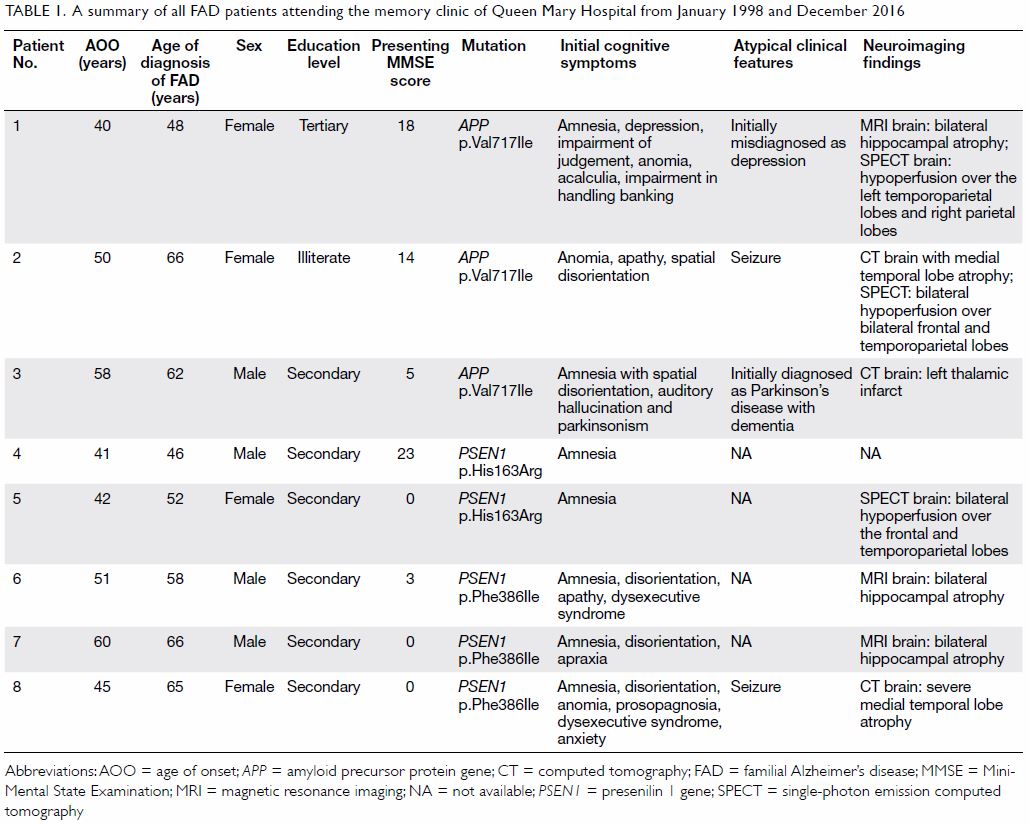
A total of 17 patients with HNCAS were identified
and managed in our institution from December 1997 to September 2016. Their
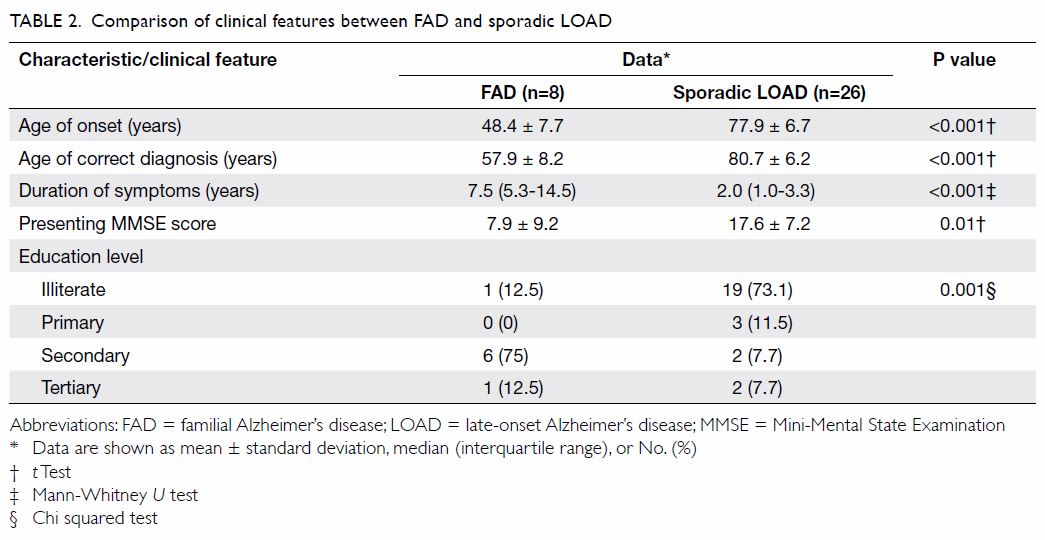
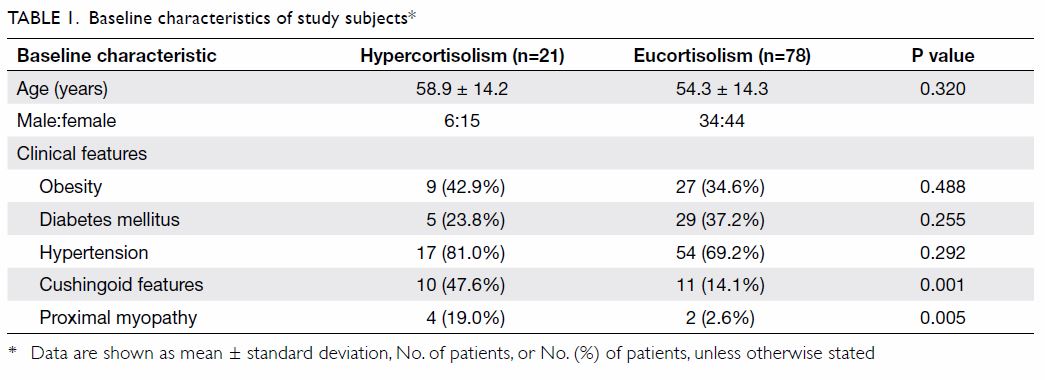
demographic and clinicopathological information are shown in Table
1. In brief, males predominated and there were only two female
patients. Their median age was 81 years (range, 67-92 years). Only one
patient had a history of whole-scalp RT for a lateral scalp angiosarcoma
more than 10 years ago in another institution. He had a new angiosarcoma
on the opposite side of his scalp that was treated in our centre as a
second primary angiosarcoma induced by past RT. The median duration from
onset of presentation to diagnosis was 4 months (range, 2-33 months).
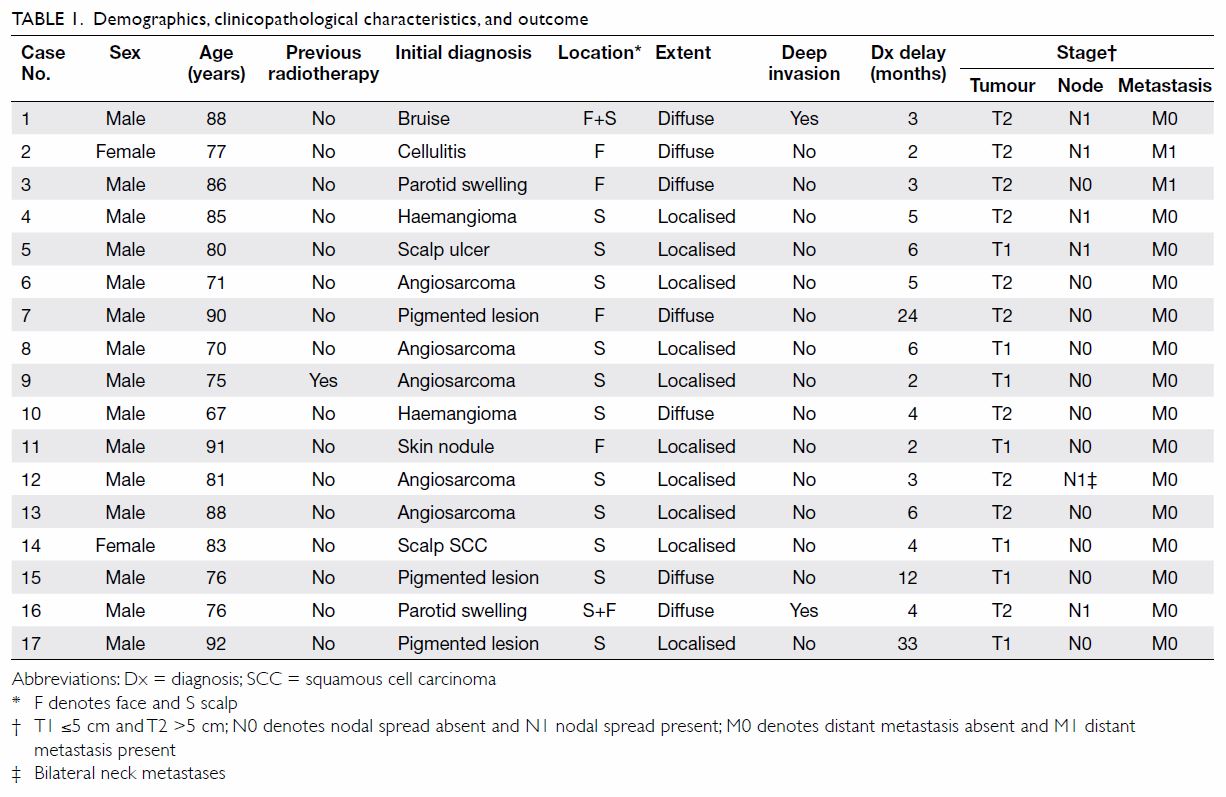
Table 1. Demographics, clinicopathological characteristics, and outcome
Patients presented with protean symptoms: bleeding
(n=7), pain (n=4), nodule (n=3), ulceration (n=2), pigmentation (n=2),
pruritus (n=1), and localised oedema (n=1). One patient presented with an
asymptomatic purplish macule but no other symptoms.
The tumours were present in the scalp only (n=11),
face only (n=4), or both scalp and face (n=2). No patient had neck CAS.
Ten patients had a localised/unifocal tumour. Seven patients were
inflicted by multiple/diffuse lesions that were considered inoperable and
treated with palliative intent in four. Of the three remaining patients
with multiple/diffuse lesions, the tumours were still amenable to
potentially curative surgery although two (cases 7 and 15) declined any
treatment initially. Deep invasion occurred in two patients. Of the 11
patients whose tumour dimension had been documented, the median diameter
was 4 cm (range, 3-13 cm). In the other six patients in whom dimensions
were not recorded, there was extensive involvement by the HNCAS.
At the time of diagnosis, the numbers of T1 (≤5 cm)
and T2 (>5 cm) diseases were seven and 10, respectively. Regional nodal
spread was present in six patients. Only two patients (cases 2 and 3) were
found to have distant metastases: lung in one patient, and lung and spine
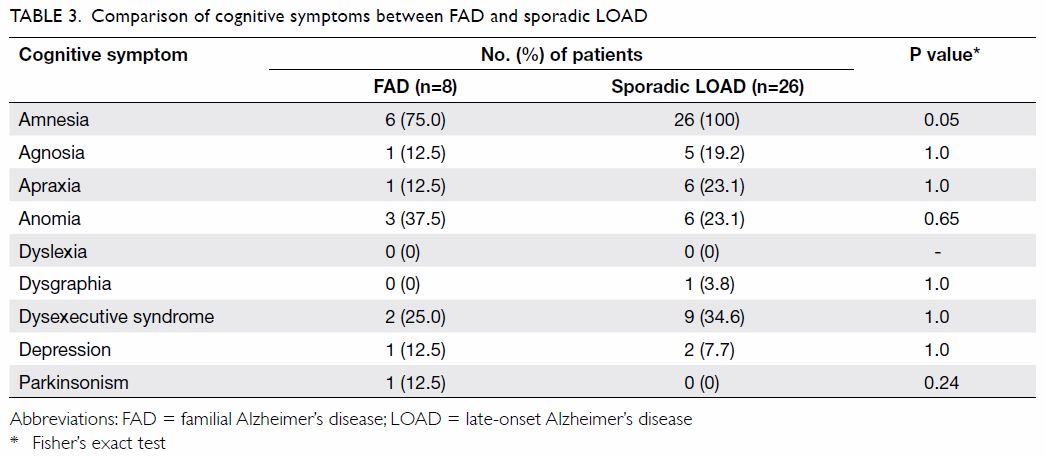
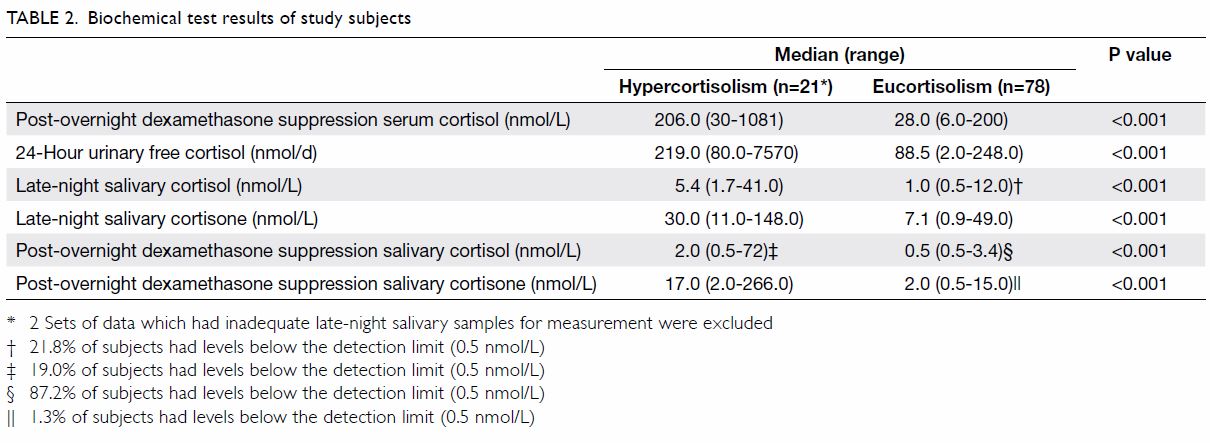
in the other (Table 1). The modalities of therapy were surgery
(n=6), surgery + adjuvant RT (n=1), palliative RT (n=5), and palliative
chemotherapy (n=3; two of them also received palliative RT following
chemotherapy). The remaining two patients (cases 7 and 15) refused any
form of treatment initially (Table 2). Incorporating subsequent therapy, surgery,
RT and chemotherapy were eventually offered to seven, 10, and five
patients, respectively.
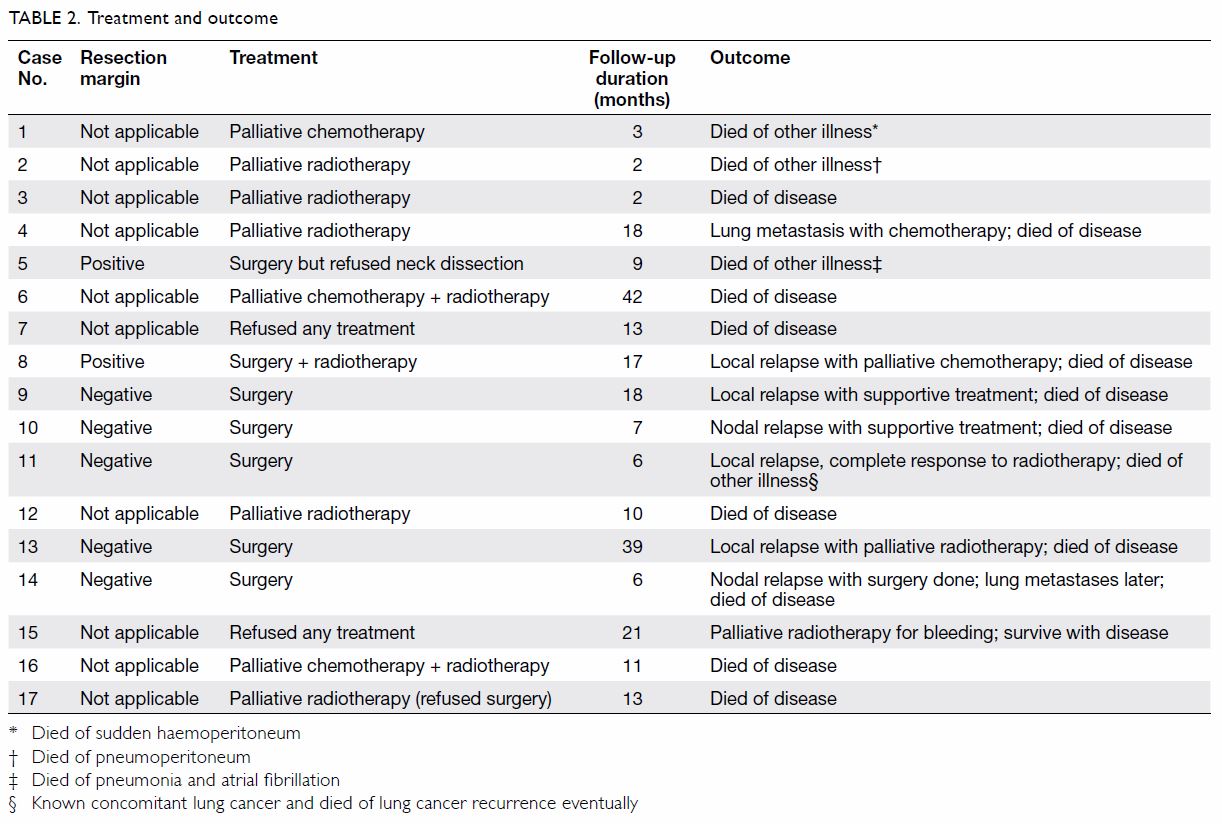
Table 2. Treatment and outcome
Of the seven patients treated surgically, the
resection margin was positive in two. Tumour recurred in six of them: four
local and two regional recurrences. The median time to relapse was 7.5
months (range, 2-32 months). Overall, 16 patients had died; the causes of
death were HNCAS in 12 and inter-current diseases in four (Table
2). One patient (case 15) was still living with the disease 21
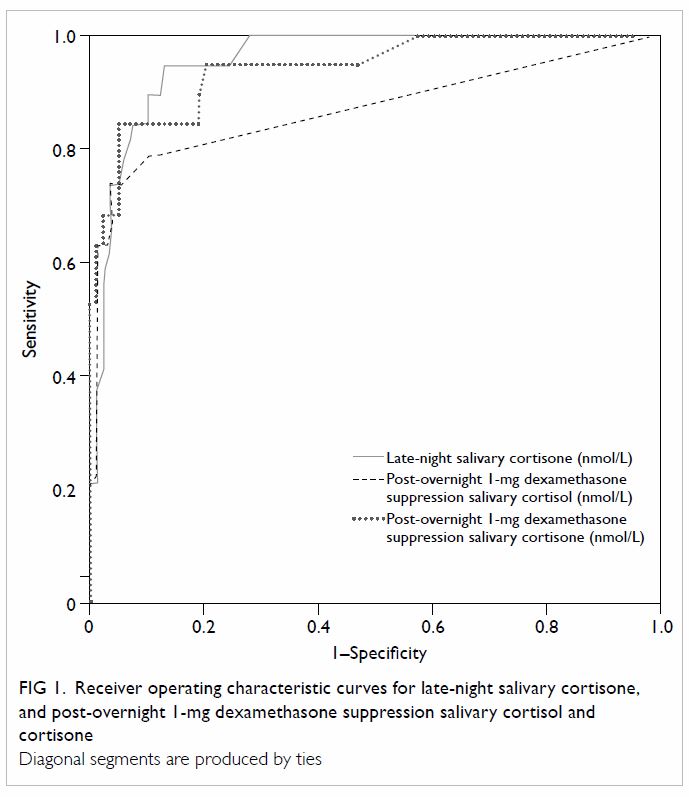
months after diagnosis. The median OS was 11.1 months and the longest OS
in our series was 42 months (case 6) [Fig 1].
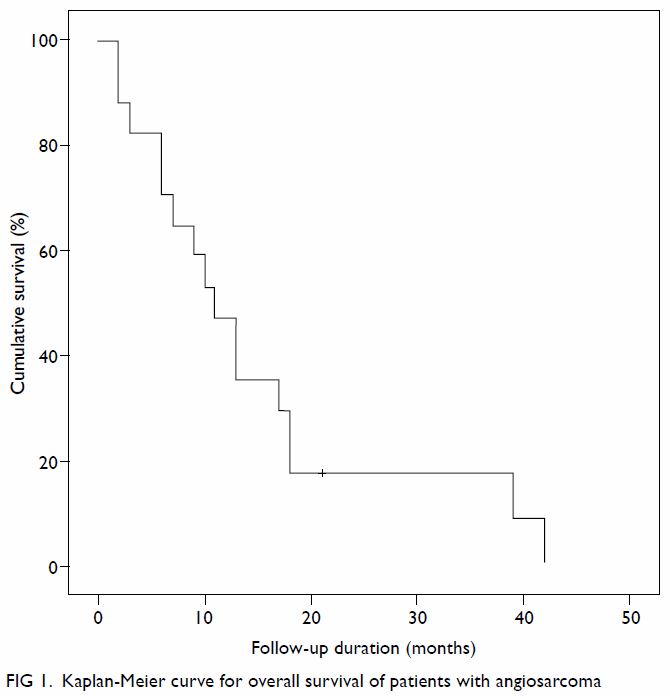
Figure 1. Kaplan-Meier curve for overall survival of patients with angiosarcoma
Discussion
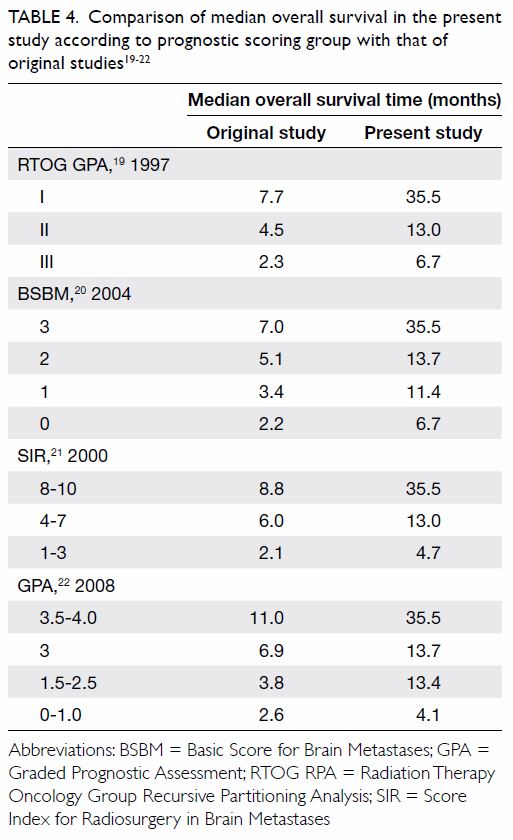
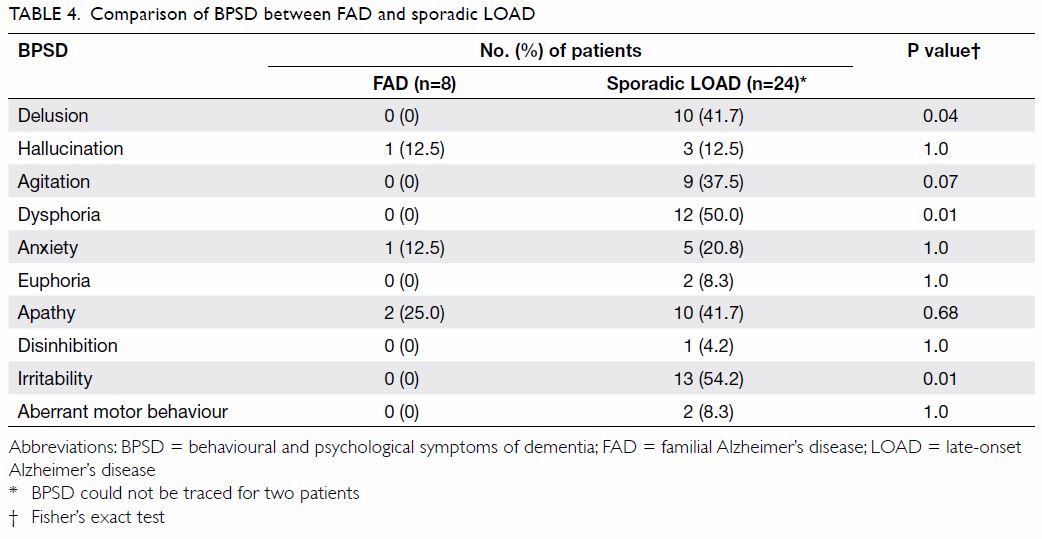
The oncological outcome of this study is obviously
far from satisfactory when compared with a reported median survival of
13.4 to 64 months as shown in Table 3,4 6 7
8 9
10 11
12 which summarises the postulated
prognosticators. Only those studies performed over the past two decades
and that focused on HNCAS with more than 10 cases were included. Patient
age, tumour size, tumour differentiation, deep invasion, and margin status
showed conflicting results. Of note, RT was the most promising and
consistent prognosticator; only one study showed an adverse effect on
survival.10 The disparity might
well be due to selection bias for RT in a retrospective study—more
advanced disease tends to receive adjuvant RT. The evidence lends credence
to adjuvant RT for HNCAS. The suboptimal outcome in our study is
multifactorial: detainment of diagnosis, inclusion of palliative cases for
survival evaluation, advanced age precluding curative treatment, and
unpopular adoption of RT or chemotherapy as multimodal therapy. In this
series, adjuvant RT was administered to only one patient after surgery,
either because others declined RT or wound complications precluded its
application.
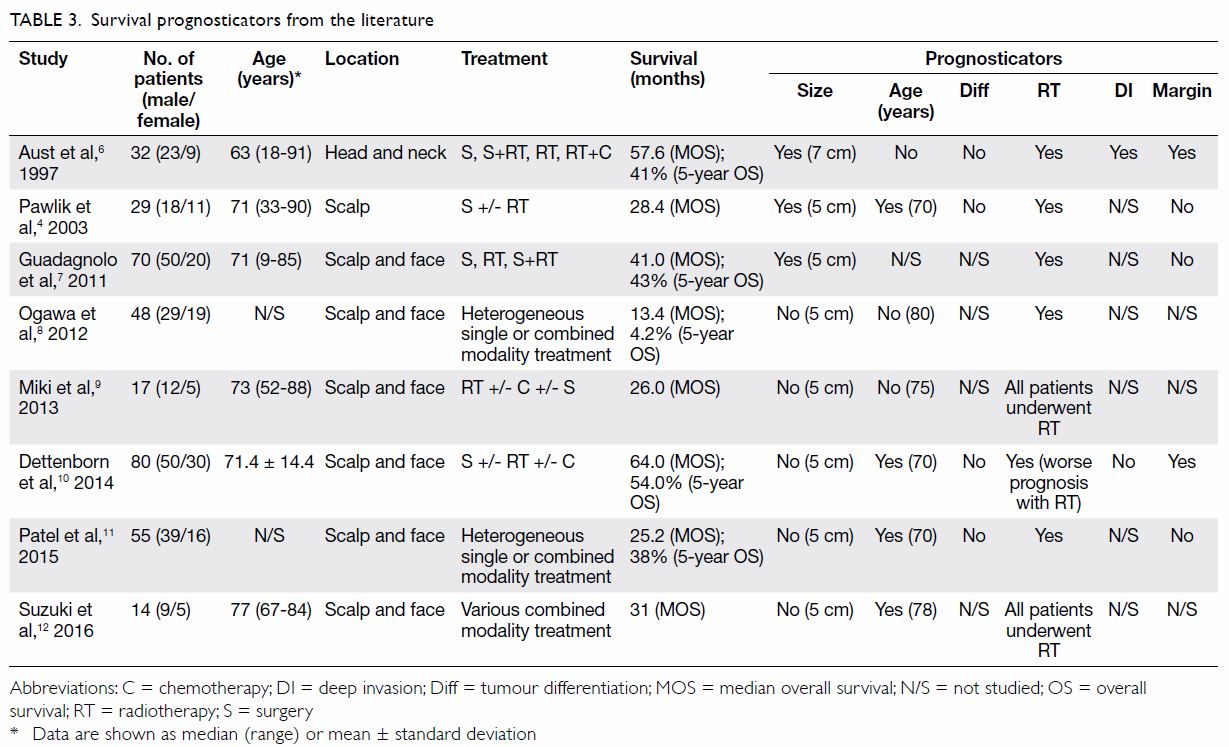
Table 3. Survival prognosticators from the literature
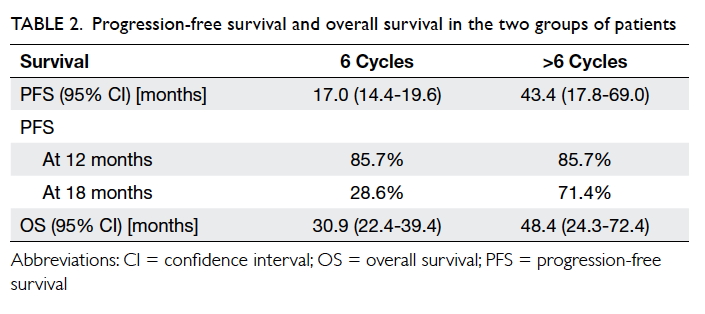
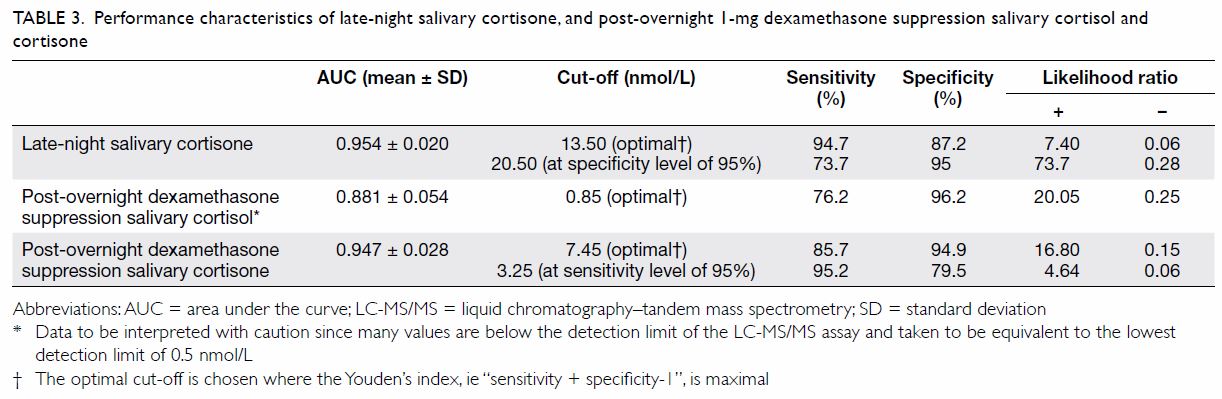
The diagnosis of HNCAS is often late as early
lesions can simulate innocent violaceous macules masquerading as benign
dermatological entities (Fig 2). From our experience, the median duration was
4 months prior to diagnostic confirmation with histopathological
examination. Three of our patients (cases 7, 15, and 17) had their
diagnosis made more than 12 months after onset of disease. The longest
delay was 33 months (case 17) and is absolutely not acceptable.
Interestingly, HNCAS manifested as pigmented lesions in two patients and
thereby misled clinicians in decision making. Increased awareness of this
rare disease by primary care clinicians is essential to expedite patient
referral. For specialists, a low threshold to biopsy of newly developed
purplish skin lesions in the elderly patients is pivotal to an early
diagnosis.
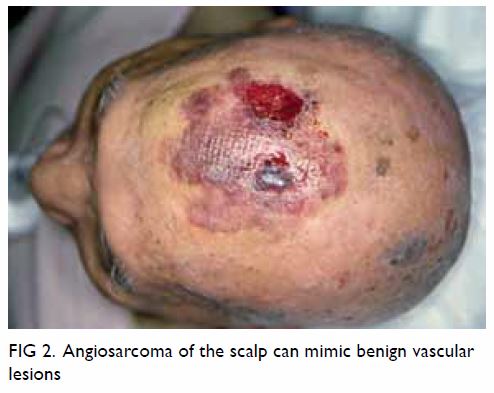
Figure 2. Angiosarcoma of the scalp can mimic benign vascular lesions
In our series, patients who underwent palliative
therapy were included in the OS calculation and this might have partially
contributed to our poor results. This was echoed by Buschmann et al13 who also included patients with palliative resection
in outcome evaluation; their longest survival reported was 36 months. This
is similar to our experience where longest survival was 42 months.
Conversely, Dettenborn et al10
reported 80 patients with HNCAS treated surgically (44 patients also
received postoperative RT) with curative intent and 5-year OS of 54% and
median OS of 64 months. Similarly, Suzuki et al12
described their experience of definitive RT as the principal curative
treatment for HNCAS; a median OS survival of 31 months was attained.
Nonetheless, the results of RT were compromised when palliative cases were
incorporated: only 12% of patients survived more than 5 years in one
study.14
Our patients were older (median age, 81 years) than
those reported in the literature (median age, 63-77 years) [Table
3]. The prognostic significance of age on the outcome of HNCAS is
controversial. Patel et al11
reported that patients younger than 70 years fared better with improved
locoregional control and relapse-free survival than older patients.
Although age is not a confirmed prognostic factor, advanced age often
precludes patients from curative therapy due to concomitant chronic
diseases or general debility. The elderly patients are also prone to dying
of other disease as encountered in this series; four patients died of
inter-current illnesses (Table 2). Nonetheless, effective systemic treatments
can be well tolerated by some elderly patients with HNCAS. With
taxane-based regimens, a response rate of 83% (10 out of 12 patients) was
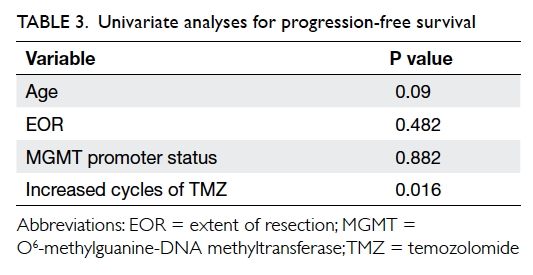
achieved and the progression-free survival was approximately 7 months.15
Surgery is historically the main treatment for
HNCAS. The latest approach to optimal management of HNCAS is combined
treatment encompassing surgery, RT, or chemotherapy. Adjuvant RT should be
liberally offered to maximise the oncological outcomes following surgery.
As shown in Table 3, five of six studies support the beneficial
role of RT.4 6 7 8 10 11 Guadagnolo et al7
advocated simple resection of the gross tumour to facilitate
non-complicated reconstruction and thus expedite RT. Two-staged surgery
was discouraged. The resection margin status was not critical to survival
if timely adjuvant RT was administered. From their experience, the 5-year
OS was 43% and 5-year disease-specific survival was 46%. In a review
article, Hwang et al16 also
concluded that positive margin was common (64%) but did not impair the
ultimate outcome. They recommended that surgeons should not be too
obsessive about removing each and every cancer cell if RT was to be
pursued.
Definitive treatment with RT and/or chemotherapy
has also been reported to be effective for HNCAS.9
Of 17 patients treated in that study, complete and partial responses were
accomplished in none and five patients, respectively. The median OS was 26
months. Multimodality treatment in various combinations with surgery, RT,
and chemotherapy has been asserted by Patel et al11
to be effective in improving locoregional control, relapse-free survival,
and OS. In another study, survival (37 months) following combined therapy
(RT and chemotherapy) was better than either modality alone: 23 months for
RT and 15 months for chemotherapy.16
Docetaxel is the preferred agent due to its antiangiogenic and
radio-sensitising effects.9 Other
agents have also been successfully used and include doxorubicin,
ifosfamide, bevacizumab, and interleukin-2. Systemic treatment may be used
in a neoadjuvant setting, adjuvant setting, and as concurrent treatment
with RT.8 17 18
Conversely, RT plus chemotherapy was not shown to have any prognostic
value in a meta-analysis by Shin et al.19
Further studies should be carried out to elucidate the benefit of combined
modality treatment.
Ip and Lee20
reported a smaller local series of CAS that was not confined to the head
and neck. A total of seven patients were enrolled from three clinics of
the Social Hygiene Service in Hong Kong. Only six patients had HNCAS.
Similarly, poor prognosis was demonstrated in these patients. Our bigger
series focusing on HNCAS provides a more updated and detailed strategy for
the management of this rare disease in ethnic Chinese.
Our study has some limitations. First, the sample
size was small as only 17 patients were included for evaluation.
Nevertheless it is the largest series reported in our locality. The study
spanned over 19 years (December 1997 to September 2016) and treatment has
evolved over this period. Moreover, like many retrospective series, recall
bias or selection bias are inherent limitations. Patient symptoms, signs,
presentation duration, and criteria for treatment might not be completely
accurate.
Conclusion
We present the first report of HNCAS in ethnic
Chinese. The oncological outcome is far from satisfactory. A high index of
suspicion is mandatory for prompt diagnosis of early disease. Adjuvant RT,
as supported by evidence from the literature, is recommended following
surgery that should aim at gross tumour extirpation to ensure uneventful
reconstruction as well as timely implementation of RT. The benefit and
role of systemic treatment in various combinations with surgery or RT
require further study.
Declaration
All authors have disclosed no conflicts of
interest.
References
1. Mark RJ, Poen JC, Tran LM, Fu YS,
Juillard GF. Angiosarcoma. A report of 67 patients and a review of the
literature. Cancer 1996;77:2400-6. Crossref
2. Perez MC, Padhya TA, Messina JL, et al.
Cutaneous angiosarcoma: a single-institution experience. Ann Surg Oncol
2013;20:3391-7. Crossref
3. Sasaki R, Soejima T, Kishi K, et al.
Angiosarcoma treated with radiotherapy: impact of tumor type and size on
outcome. Int J Radiat Oncol Biol Phys 2002;52:1032-40. Crossref
4. Pawlik TM, Paulino AF, Mcgini CJ, et al.
Cutaneous angiosarcoma of the scalp: a multidisciplinary approach. Cancer
2003;98:1716-26. Crossref
5. Chow TL, Chan TT, Chow TK, Fung SC, Lam
SH. Reconstruction with submental flap for aggressive orofacial cancer.
Plast Reconstr Surg 2007;120:431-6. Crossref
6. Aust MR, Olsen KD, Lewis JE, et al.
Angiosarcoma of the head and neck: clinical and pathologic
characteristics. Ann Otol Rhinol Laryngol 1997;106:943-51. Crossref
7. Guadagnolo BA, Zagars GK, Araujo D, Ravi
V, Shellenberger TD, Sturgis EM. Outcomes after definitive treatment for
cutaneous angiosarcoma of the face and scalp. Head Neck 2011;33:661-7. Crossref
8. Ogawa K, Takahashi K, Asato Y, et al.
Treatment and prognosis of angiosarcoma of the scalp and face: a
retrospective analysis of 48 patients. Br J Radiol 2012;85:e1127-33. Crossref
9. Miki Y, Tada T, Kamo R, et al. Single
institutional experience of the treatment of angiosarcoma of the face and
scalp. Br J Radiol 2013;86:20130439. Crossref
10. Dettenborn T, Wermker K, Schulze HJ,
Klein M, Schwipper V, Hallermann C. Prognostic features in angiosarcoma of
the head and neck: a retrospective monocenter study. J Craniomaxillofac
Surg 2014;42:1623-8. Crossref
11. Patel SH, Hayden RE, Hinni ML, et al.
Angiosarcoma of the scalp and face: the Mayo Clinic experience. JAMA
Otolaryngol Head Neck Surg 2015;141:335-40. Crossref
12. Suzuki G, Yamazaki H, Takenaka H, et
al. Definitive radiation therapy for angiosarcoma of the face and scalp.
In Vivo 2016;30:921-6.Crossref
13. Buschmann A, Lehnhardt M, Toman N,
Preiler P, Salakdeh MS, Muehlberger T. Surgical treatment of angiosarcoma
of the scalp: less is more. Ann Plast Surg 2008;61:399-403. Crossref
14. Holden CA, Spittle MF, Jones EW.
Angiosarcoma of the face and scalp, prognosis and treatment. Cancer
1987;59:1046-57. Crossref
15. Letsa I, Benson C, Al-Muderis O,
Judson I. Angiosarcoma of the face and scalp: effective systemic treatment
in the older population. J Geriatr Oncol 2014;5:276-80. Crossref
16. Hwang K, Kim MY, Lee SH.
Recommendations for therapeutic decisions of angiosarcoma of the scalp and
face. J Craniofac Surg 2015;26:e253-6. Crossref
17. Wollina U, Fuller J, Graefe T, Kaatz
M, Lopatta E. Angiosarcoma of the scalp: treatment with liposomal
doxorubicin and radiotherapy. J Cancer Res Clin Oncol 2001;127:396-9. Crossref
18. Yang P, Zhu Q, Jiang F. Combination
therapy for scalp angiosarcoma using bevacizumab and chemotherapy: a case
report and review literature. Chin J Cancer Res 2013;25:358-61.
19. Shin JY, Roh SG, Lee NH, Yang KM.
Predisposing factors for poor prognosis of angiosarcoma of the scalp and
face: systemic review and meta-analysis. Head neck 2017;39:380-6. Crossref
20. Ip FC, Lee CK. Cutaneous angiosarcoma:
a case series in Hong Kong. Hong Kong J Dermatol Venereol 2010;18:6-14.


 A video clip showing frameless
stereotactic radiosurgery for brain metastases is available at
A video clip showing frameless
stereotactic radiosurgery for brain metastases is available at