Obesity-driven thyroid cancer burden in middle-aged and older populations: temporal trends and projected trajectories based on the Global Burden of Disease study

Hong Kong Med J 2026 Apr;32(2):135–43 | Epub 16 Apr 2026
© Hong Kong Academy of Medicine. CC BY-NC-ND 4.0
 
ORIGINAL ARTICLE
Obesity-driven thyroid cancer burden in middle-aged and older populations: temporal trends and projected trajectories based on the Global Burden of Disease study
Bo Jiang, BMed1 #; Jing Li, MMed2 #; Xi Sun, PhD3 #; Jingyu Qu, BMed4 #; Jing Li, BMed5; Li Li, BMed6; Dong Cai, BMed6; Yanli Zhao, MCM7; Jia Tian, PhD8; Jie Lian, BMed9; Xuhua Liu, BMed10; Chunhuo Zhang, MSc11; Shuying Niu, BSc12; Ying Yu, BMed13; Jun Han, PhD14
1 Department of Clinical Medicine, The Fourth Affiliated Hospital, Harbin Medical University, Harbin, China
2 Department of Endocrinology and Metabolism, Heilongjiang Academy of Traditional Chinese Medicine, Harbin, China
3 Department of Research, The Fourth Affiliated Hospital, Harbin Medical University, Harbin, China
4 Clinical Medicine, Harbin Medical University, Harbin, China
5 Xinlin District People’s Hospital, Xinlin, China
6 Department of Geriatrics, Xinlin District People’s Hospital, Xinlin, China
7 Department of General Practice, Dawusu Town Health Center, Xinlin, China
8 Department of Nephrology, The Fourth Affiliated Hospital, Harbin Medical University, Harbin, China
9 Department of Ultrasound, The Fourth Affiliated Hospital, Harbin Medical University, Harbin, China
10 Department of Geriatrics, The Fourth Affiliated Hospital, Harbin Medical University, Harbin, China
11 Da Hinggan Ling Health Commission, Jagdaqi, China
12 Xinlin Health Commission, Xinlin, China
13 Department of Ophthalmology, The Fourth Affiliated Hospital, Harbin Medical University, Harbin, China
14 Department of Endocrinology and Metabolism, The Fourth Affiliated Hospital, Harbin Medical University, Harbin, China
 
# Equal contribution
 
Corresponding authors: Prof Jun Han (hanjun198887@sina.com); Prof Ying Yu (happyhatty@163.com)
 
 Full paper in PDF
 
Abstract
Introduction: High body mass index (BMI) in middle-aged and older individuals (≥40 years) is a leading risk factor for thyroid cancer–related morbidity and mortality; however, the quantifiable impact of elevated BMI on disability-adjusted life years (DALYs) and mortality in ageing populations remains underexplored. This study comprehensively evaluated the global burden of thyroid cancer attributable to elevated BMI by integrating past epidemiological trends, demographic variability and risk attribution models, and provided relevant projected trajectories using data from the Global Burden of Disease (GBD) study.
 
Methods: We analysed mortality, DALYs, years of life lost (YLLs) and years lived with disability (YLDs). Temporal trends in disease burden from 1990 to 2021 were examined using linear regression models. Cluster analysis was used to assess region-specific burdens across GBD study regions. Finally, projections of future disease burden from 2022 to 2050 were generated using autoregressive integrated moving average and exponential smoothing models.
 
Results: In 2021, high BMI contributed to 5255 thyroid cancer–related deaths (age-standardised mortality rate: 0.06 per 100 000) and 144 955 DALYs (age-standardised rate: 1.68 per 100 000); women and low-middle Socio-demographic Index regions were identified as high-risk subgroups. Projections indicate continued increases in mortality and overall disease burden through 2050.
 
Conclusion: Substantial geographical heterogeneity in thyroid cancer burden was observed across GBD regions. Interventions targeting high-risk demographic groups and regions should be prioritised to reduce this growing disease burden.
 
 
New knowledge added by this study
  • This is the first study to confirm the quantifiable impact of elevated body mass index (BMI) on disability-adjusted life years and mortality in ageing demographic groups.
  • This study comprehensively evaluated the global disease burden of thyroid cancer attributable to elevated BMI by integrating epidemiological trends, demographic variability, and risk attribution models from 1990 to 2021.
Implications for clinical practice or policy
  • The Hong Kong Government could propose sex- and age-specific prevention strategies, metabolic risk mitigation, and early detection protocols to address the increasing public health threat posed by obesity-driven thyroid cancer.
  • The Hong Kong Government could prioritise interventions in high-risk demographic groups and regions to reduce this growing disease burden.
 
 
Introduction
Thyroid cancer is one of the most common endocrine malignancies,1 and its global incidence has steadily increased in recent decades.2 This rise is primarily attributed to an increased incidence of papillary thyroid carcinoma.3 Patients with papillary thyroid carcinoma generally have a favourable prognosis; with appropriate treatment, the 5-year survival rate exceeds 98.3%.4 Most known or suspected risk factors for thyroid cancer, such as age, sex, race or ethnicity, and family history, are non-modifiable.5
 
However, changes in other factors, including obesity, cancer detection, iodine intake and ionising radiation, may influence the observed incidence, mortality and disability-adjusted life years (DALYs) of thyroid cancer over time. It is well documented that elevated body mass index (BMI) influences cancer development across multiple malignancies.6 7 We speculate that these aggregated trends do not accurately reflect the true disease burden in populations with high BMI, particularly among middle-aged and older adults, because existing studies address only the heterogeneity of thyroid cancer incidence across regions.8 9 To address this gap, we used data from the Global Burden of Disease (GBD) 2021 study to systematically analyse the burden of thyroid cancer among middle-aged and older adults with high BMI from 1990 to 2021, and to project the future burden from 2022 through 2050. This analysis will assist policymakers in assessing thyroid cancer burden, evaluating the progress in targeted therapies, allocating resources, and formulating evidence-based policies.
 
Methods
Overview
The GBD 2021 study conducted a comprehensive assessment of health loss across 204 countries and territories, encompassing 369 diseases, injuries and impairments, as well as 88 risk factors, using updated epidemiological data and refined standardisation methodologies.10 The GBD database employs sophisticated methods to address missing data and adjust for confounding factors. Detailed descriptions of the GBD study design and analytical approaches have been extensively documented.10 Data used in the present study were obtained from the GBD 2021 database (https://ghdx.healthdata.org/gbd-2021), which contains no personally identifiable information.
 
Socio-demographic Index
The Socio-demographic Index (SDI) quantifies regional development status using aggregated measures of fertility rate, per capita income and educational attainment, scaled from 0 (least developed) to 1 (most developed). Within the GBD 2021 framework, countries were classified into five SDI tiers: high (>0.81), high-middle (0.70-0.81), middle (0.61-0.69), low-middle (0.46-0.60), and low (<0.46).10
 
Time series analysis
A time series comprises systematically recorded data points indexed at uniform temporal intervals (daily, monthly or yearly), enabling the identification of temporal patterns and trends. To forecast thyroid cancer burden metrics, we implemented autoregressive integrated moving average (ARIMA) models, which incorporate systematic evaluation of autoregressive, moving average and differencing parameters to optimise predictive accuracy.11
 
Study data
In this study, the burden of thyroid cancer associated with high BMI among populations aged <40 years was assumed to be negligible. Consequently, individuals aged ≥40 years were stratified into 12 age-groups.
 
Statistical analyses
The statistical analysis evaluated global deaths, DALYs, years of life lost (YLLs), years lived with disability (YLDs), and age-standardised rates for high-BMI–related thyroid cancer in middle-aged and older populations (2021), stratified by age, sex, SDI, region and country. Temporal trends (1990-2021) were analysed globally and across subgroups using linear regression models to estimate annual percentage changes.12 Decomposition analysis using the Das Gupta method (modified by Cheng et al [2020])13 14 isolated the effects of population ageing, population growth and epidemiological changes on variations in disease burden. The ARIMA and exponential smoothing models were used to project future disease burden (2022-2050). All analyses were performed using R software (version 4.0.2) for database management, computation and validation.
 
Results
Disease burden of thyroid cancer attributable to high body mass index in middle-aged and older populations
Globally, high-BMI–associated thyroid cancer among middle-aged and older populations caused 5255 deaths (95% uncertainty interval [95% UI]=3914-6653), with an age-standardised mortality rate of 0.06 per 100 000 (95% UI=0.05-0.08) [Table 1]. The number of attributable DALYs totalled 144 955 (95% UI=109 230-184 747), corresponding to an age-standardised DALY rate of 1.68 per 100 000 (95% UI=1.26-2.14) [Table 2]. Specifically, the number of YLDs reached 15 968 (95% UI=10 370-23 793; age-standardised rate: 0.18 per 100 000 [95% UI=0.12-0.28]) [Table 3], whereas YLLs constituted 128 986 (95% UI=96 149-162 365; age-standardised rate: 1.50 per 100 000 [95% UI=1.12-1.88]) [Table 4]. Age-standardised mortality, DALY, and YLL rates for high-BMI–related thyroid cancer increased with age, whereas YLD rates peaked in the 70-74 years age-group before declining. Non-linear age-specific patterns were observed for absolute case counts: deaths and DALYs peaked in the 55-59 years age-group (Table 2), YLDs in the 55-59 years age-group (Table 3), and YLLs in the 65-69 years age-group (Table 4). In 2021, female predominance was evident across all metrics. Females accounted for 61.37% of deaths, 60.79% of DALYs, 66.23% of YLDs, and 60.12% of YLLs. Geographically, middle-SDI regions had the highest absolute burden (1649 deaths; 47 448 DALYs), whereas high-middle SDI regions exhibited the highest age-standardised mortality (0.06 per 100 000) and DALY rates (1.63 per 100 000) [Tables 1 and 2].
 

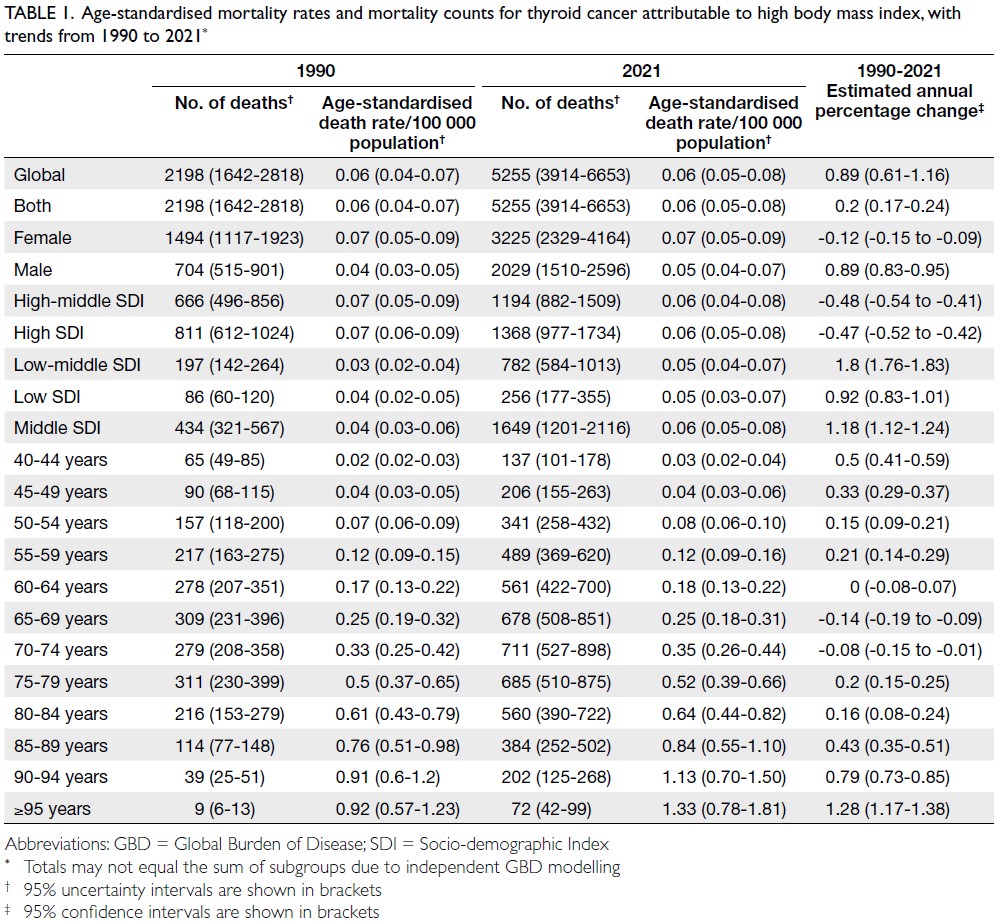
Table 1. Age-standardised mortality rates and mortality counts for thyroid cancer attributable to high body mass index, with trends from 1990 to 2021
 

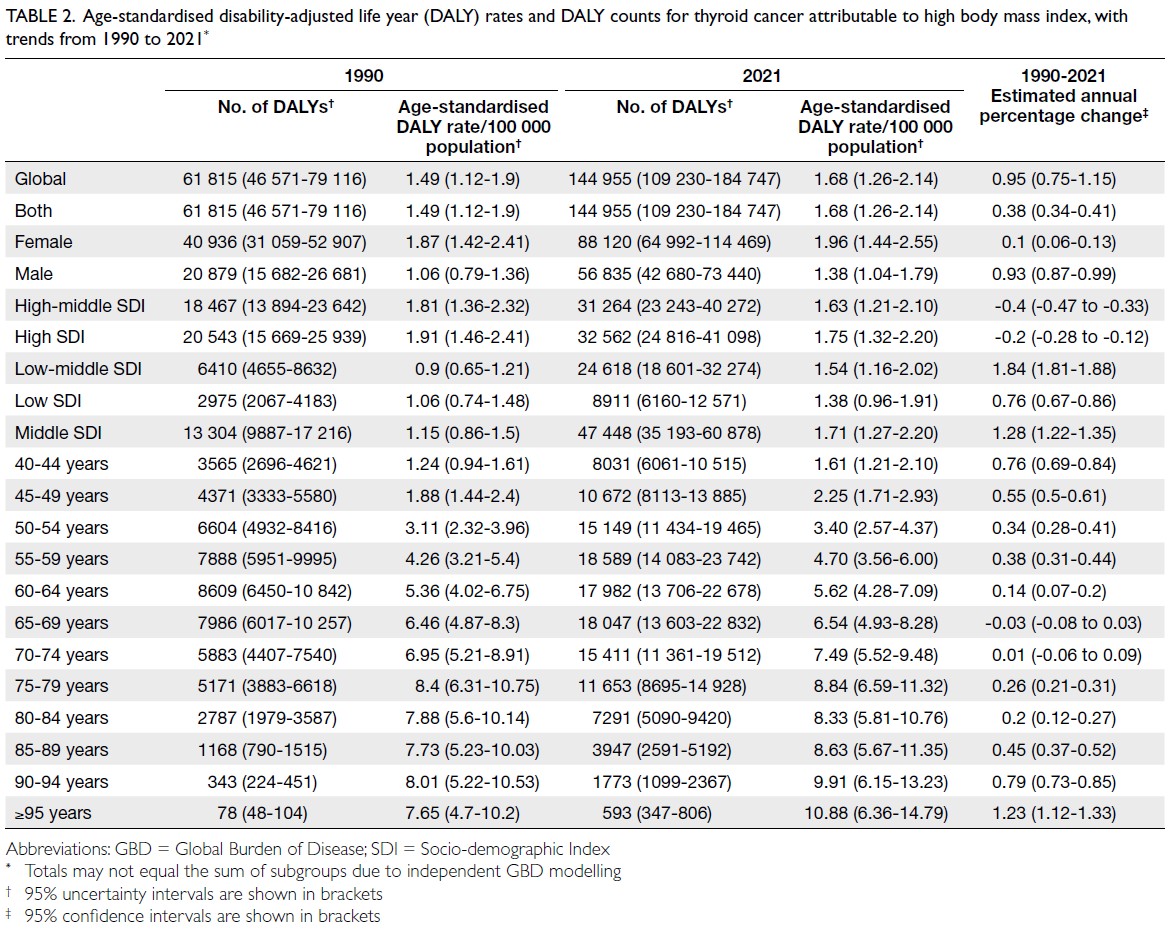
Table 2. Age-standardised disability-adjusted life year (DALY) rates and DALY counts for thyroid cancer attributable to high body mass index, with trends from 1990 to 2021
 

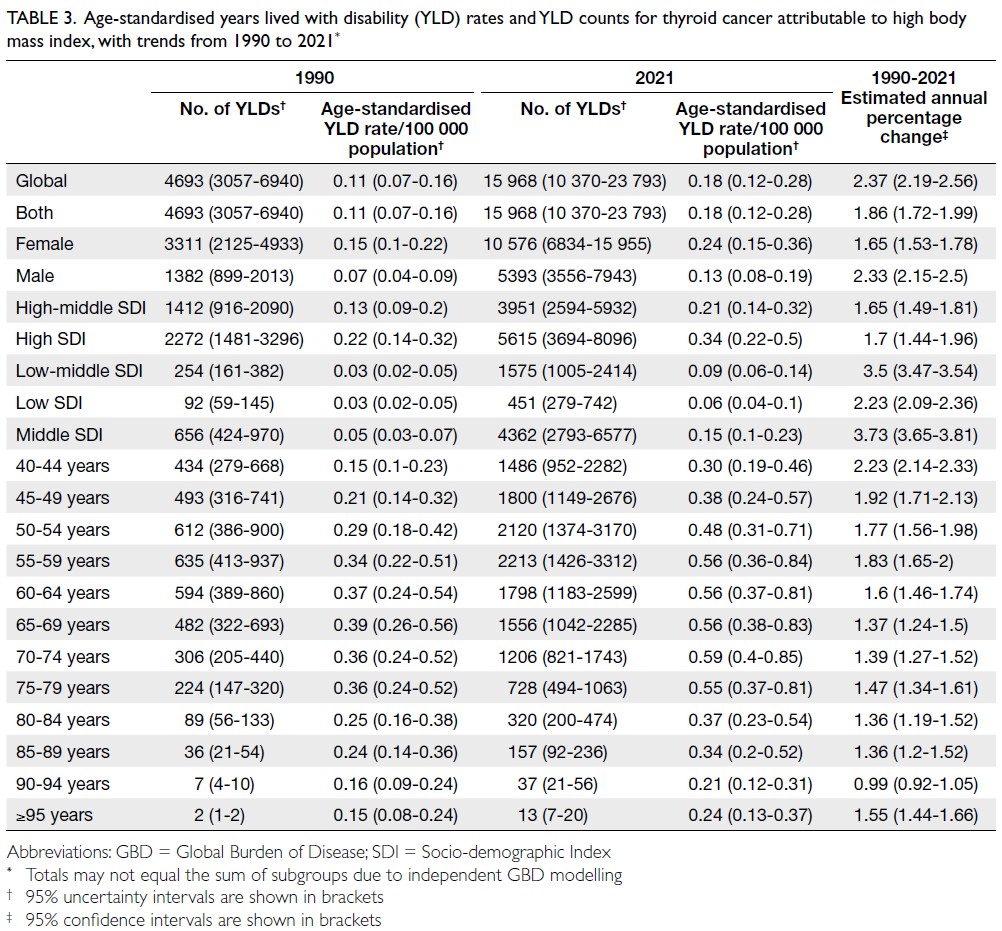
Table 3. Age-standardised years lived with disability (YLD) rates and YLD counts for thyroid cancer attributable to high body mass index, with trends from 1990 to 2021
 

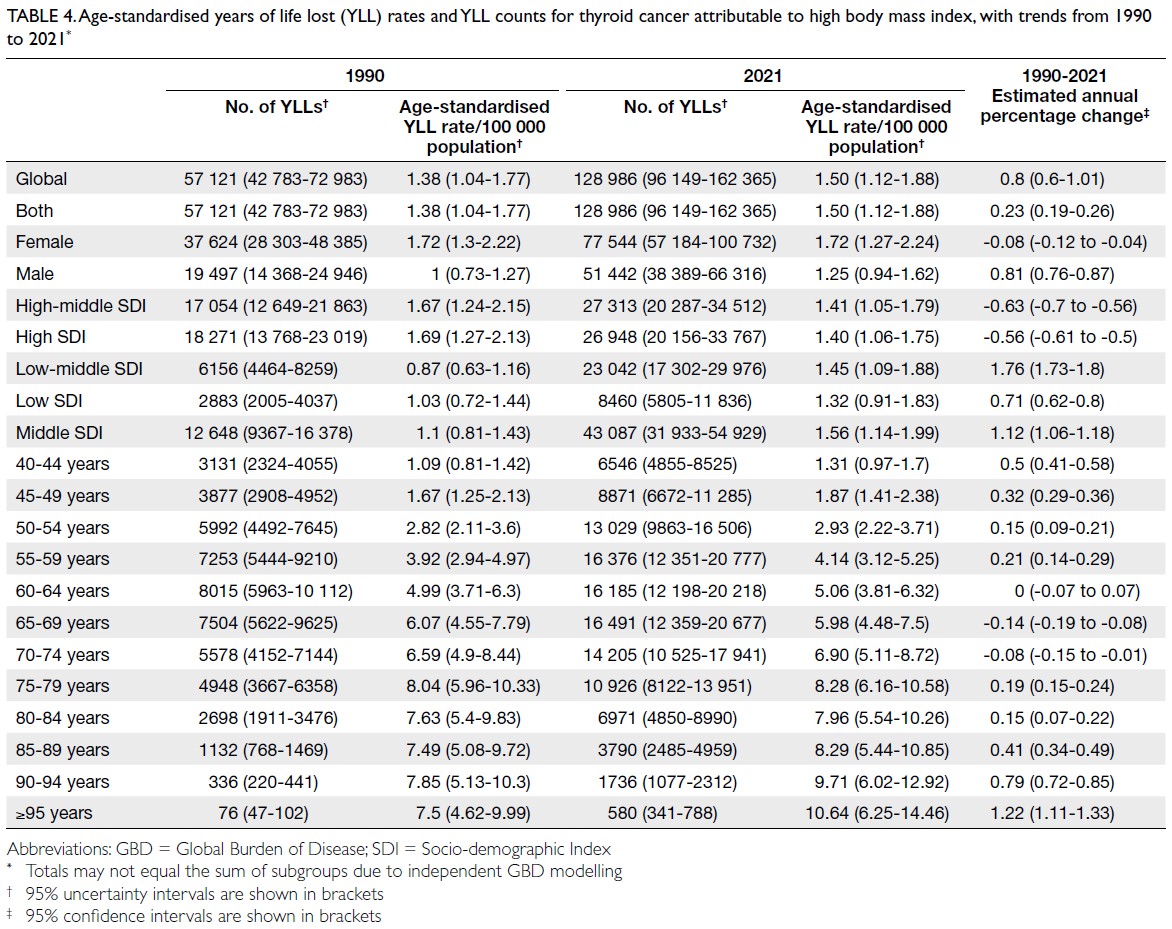
Table 4. Age-standardised years of life lost (YLL) rates and YLL counts for thyroid cancer attributable to high body mass index, with trends from 1990 to 2021
 
Globally, substantial disparities in the burden of high-BMI–related thyroid cancer were observed across 50 GBD regions in 2021. Asia displayed the highest absolute burden, with 75 130 DALYs (95% UI=54 305-97 695), 2601 deaths (95% UI=1884-3397), 7596 YLDs (95% UI=4771-11 735), and 67 533 YLLs (95% UI=48 806-88 249), whereas Oceania reported the lowest values, with 163 DALYs (95% UI=102-238) and five deaths (95% UI=3-7). Age-standardised rates revealed regional heterogeneity: Andean Latin America exhibited among the highest age-standardised rates for DALYs (4.26 per 100 000; 95% UI=3.03-5.89), deaths (0.16 per 100 000; 95% UI=0.12-0.23) and YLLs (3.98 per 100 000; 95% UI=2.80-5.48).
 
At the national level, China recorded the highest number of DALYs (23 684; 95% UI=16 056-32 507) and deaths (871; 95% UI=588-1177), followed by India (11 546-20 676 DALYs; 506 deaths). Fiji (Oceania) demonstrated the highest age-standardised DALY rate (6.07 per 100 000; 95% UI=3.76-8.98), exceeding that of Ecuador (South American, Andean region: 5.12 per 100 000; 95% UI=3.57-6.92). China also exhibited the highest global YLD (2871; 95% UI=1780-4650) and YLL (20 814; 95% UI=13 923-28 116) counts, reflecting its disproportionate burden among ageing populations with elevated BMI (online supplementary Fig 1).
 
Temporal trends in disease burden attributable to high body mass index–related thyroid cancer in middle-aged and older populations
From 1990 to 2021, the numbers of thyroid cancer–related deaths, DALYs, YLDs, and YLLs increased worldwide, reflecting a growing public health burden. Age-standardised rates for all metrics showed an overall increasing trend during this period, indicating persistent elevations in mortality and morbidity risk independent of population ageing. These findings suggest that the increasing disease burden cannot be attributed solely to demographic expansion, but may involve synergistic drivers such as environmental exposures or lifestyle changes (online supplementary Fig 2).
 
Sex-specific disparities were evident in temporal progression patterns; men displayed concurrent upward trends in age-standardised morbidity and mortality rates, as well as case numbers, highlighting sex-dimorphic epidemiological mechanisms (online supplementary Fig 3).
 
Age-stratified analysis revealed differential temporal patterns: middle-aged cohorts (40-44 years) showed relatively stable age-standardised rates in later decades despite increasing case counts, suggesting improved early detection or risk mitigation. Conversely, older populations (70-79 years) experienced concurrent increases in age-standardised morbidity metrics and absolute case counts, indicating that disease progression may be driven by ageing-related physiological vulnerabilities and prolonged exposure to risk factors (online supplementary Fig 4).
 
Geographical heterogeneity was observed across SDI regions. High- and high-middle-SDI regions achieved declining age-standardised rates despite increasing case numbers, likely reflecting advances in healthcare infrastructure and diagnostic precision. In contrast, low-middle- and low-SDI regions experienced parallel increases in age-standardised rates and absolute case counts, underscoring the compounding effects of limited healthcare access, delayed diagnosis, and unmitigated metabolic risk factors (online supplementary Fig 5).
 
Globally, thyroid cancer–related DALYs, deaths, YLDs, and YLLs among middle-aged and older populations with elevated BMI increased from 1990 to 2021. Population growth was the predominant driver of these increases, followed by epidemiological changes and population ageing.
 
High- and high-middle-SDI areas were primarily influenced by population growth and epidemiological shifts, with minimal contribution from ageing. Middle-SDI regions showed substantial contributions from all three factors—population growth, epidemiological changes, and ageing. In low-middle- and low-SDI regions, population growth remained the dominant driver, although epidemiological changes and ageing also contributed (online supplementary Fig 6). Sex-specific decomposition revealed differing contribution patterns. Among women, population growth was the primary driver of the burden, with additional contributions from epidemiological changes and smaller effects from ageing. In contrast, men exhibited a dual-driver pattern in which population growth and epidemiological changes jointly accounted for most of the burden, while ageing played a lesser role (online supplementary Fig 7).
 
Predicted results for 2022 to 2050
The ARIMA model projections for 2022 to 2050 indicated that the numbers of deaths, DALYs, YLDs, and YLLs related to thyroid cancer are expected to increase in both sexes. Corresponding age-standardised rates demonstrated relative stabilisation in women and an upward trend in men; these patterns were corroborated by exponential smoothing models (online supplementary Fig 8).
 
Discussion
Thyroid cancer is one of the most prevalent endocrine malignancies worldwide. Although the overall survival rate remains relatively high, its increasing incidence in many countries and regions, particularly in more developed nations, has become a growing public health concern.15 Globally, approximately 560 000 new cases of thyroid cancer are diagnosed annually, with a female-to-male incidence ratio of around 3:1.16 17 18 Concurrently, obesity has emerged as a major clinical and public health challenge, exhibiting rapid growth trends in both developed and developing countries. The impact of elevated BMI on cancer development has been well documented across multiple malignancies.7 However, the specific mechanisms underlying the association between elevated BMI and thyroid carcinogenesis remain poorly understood, constituting a critical knowledge gap that warrants further investigation.
 
According to the Global Burden of Disease Study 2021, thyroid cancer incidence rates have shown a sustained annual increase worldwide, with particularly pronounced rises among women in countries such as the United States and South Korea.19 This trend has been attributed to advances in early screening and diagnostic technologies. Furthermore, active surveillance has been recommended for the management of papillary microcarcinoma; these minimally invasive tumours frequently demonstrate favourable prognoses and indolent biological progression. This strategy effectively avoids overtreatment while reducing unnecessary surgical and therapeutic interventions.20 In recent years, China has updated its clinical guidelines for thyroid nodule management, emphasising early screening protocols, standardisation of fine-needle aspiration biopsy, and personalised treatment planning.21 These revised strategies, particularly in the management of differentiated thyroid cancer, have further improved patient survival and quality of life.
 
The present study leveraged the GBD 2021 study database to evaluate thyroid cancer–related mortality, DALYs, YLDs, and YLLs among middle-aged and older individuals (≥40 years) with elevated BMI from 1990 to 2021. The results revealed an age-dependent increase in mortality burden, with DALYs and YLDs peaking in the 55-59-year age-group and YLLs reaching maximal levels in the 65-69-year age-group. Notably, populations aged ≥85 years displayed attenuated disease burden metrics in absolute counts, potentially reflecting diminished physiological reserves that mask the clinical manifestations of malignancy, thereby contributing to diagnostic delays, therapeutic limitations, and exacerbated mortality. These findings underscore the critical interplay between ageing, metabolic risk, and healthcare accessibility in shaping thyroid cancer outcomes among high-BMI populations.
 
This study confirmed persistent sex disparities in thyroid cancer burden, with the incidence and prevalence among women consistently exceeding those among men across all regions in both 1990 and 2021. These disparities likely arise from an interplay of biological and socio-cultural mechanisms. Central to this imbalance are hormonal drivers—particularly oestrogen fluctuations during the menopausal transition—which may promote thyroid cell proliferation and oncogenesis. In addition to these biological factors, sex-specific lifestyle patterns, such as chronic stress, dietary habits, and exposure to environmental pollutants, may further increase tumourigenic risk. Underlying both dimensions, socio-cultural determinants affecting healthcare access may introduce diagnostic ascertainment bias, potentially obscuring the true epidemiological landscape.17
 
Notably, our analysis revealed a progressive rise in the proportions of obesity-driven thyroid cancer mortality and DALY proportions from 1990 to 2021; men exhibited a substantially greater escalation in burden relative to women.22 These patterns align with global epidemiological shifts—47.1% and 27.5% increases in adult and childhood obesity prevalence, respectively, from 1980 to 2013.23 Such trends likely contribute to the disproportionate increase in thyroid cancer burden among male populations. Mechanistically, prolonged obesity may synergise with age-related endocrine alterations through amplified metabolic dysregulation and chronic inflammation, thereby promoting thyroid carcinogenesis in ageing men.24
 
Low-SDI regions display lower overall thyroid cancer incidence rates but significantly faster growth than high-SDI regions. In contrast, high-SDI regions show stable or marginally declining incidence trends, potentially attributable to advanced healthcare infrastructure and higher health literacy, which enable early diagnosis and optimised management. These disparities emphasise the critical role of socio-economic development in shaping the epidemiology of thyroid cancer. Prioritising SDI-stratified interventions tailored to regional healthcare capacity and risk profiles could enhance the precision and impact of burden-mitigation strategies.25
 
Projections indicate escalating thyroid cancer mortality, DALYs, YLLs, and YLDs from 2022 to 2050, with progressive increases among men but stable rates among women, consistent with documented epidemiological trajectories.9 This rising burden in middle-aged and older populations with elevated BMI likely reflects synergistic interactions involving demographic ageing, the proliferation of high-risk behaviours, and socio-economic transitions. These forecasts highlight the urgent need to integrate tertiary prevention strategies with early-stage interventions targeting metabolic risk mitigation and diagnostic optimisation.
 
This investigation is strengthened by its rigorous analysis of the obesity-driven thyroid cancer burden in ageing populations using the GBD 2021 study dataset (1990-2021), coupled with comprehensive male patient data to delineate sex-specific epidemiological trajectories. However, the findings are tempered by several methodological constraints. The lack of histopathological subtype classification, such as papillary, follicular, or anaplastic variants, limits prognostic granularity. Additionally, there was limited consideration of modifiable risk factors, including gradients of radiation exposure and fluctuations in dietary iodine intake, which may synergistically interact with metabolic risk. Furthermore, this study did not fully disentangle how therapeutic advances (eg, surgical techniques, radiotherapy protocols, and molecular-targeted agents) modulate longitudinal disease burden. Collectively, these gaps underscore the imperative for intervention-focused studies integrating molecular stratification and context-specific risk profiling to refine clinical management paradigms.
 
Obesity is associated with an increased risk of at least 13 cancers (eg, endometrial, oesophageal, renal, and pancreatic adenocarcinomas; hepatocellular carcinoma; gastric cancer; colorectal cancer; postmenopausal breast cancer; ovarian cancer; gallbladder cancer; and thyroid cancer). Its biological mechanisms are multifactorial, mainly involving chronic inflammation, hormonal dysregulation, and metabolic disturbances: (1) long-term systemic inflammation may impair tissue repair capacity and promote tumour development26; (2) disruption of hormonal balance, as adipose tissue is a major source of aromatase activity that converts androgens to oestrogen, thereby increasing the risk of hormone-related malignancies27; and (3) increased visceral and subcutaneous fat accumulation may promote metabolic abnormalities that contribute to the development of liver, endometrial, and other cancers.28
 
Therefore, from a public health perspective, efforts should be strengthened to increase awareness of the association between obesity and cancer, promote health education, and encourage population-level weight control to reduce cancer incidence. From an individual perspective, effective weight management should be emphasised, including reducing the intake of high-fat and high-sugar foods, adopting a high-fibre, low-calorie diet, increasing physical activity, and undergoing regular health screening (including monitoring body weight, waist circumference, blood glucose, lipid levels, and liver and kidney function) to reduce the risk of obesity-related tumours.
 
Conclusion
Significant geographical heterogeneity in thyroid cancer burden was observed across GBD regions. These findings underscore the urgent need for sex- and age-specific prevention strategies, metabolic risk mitigation, and early detection protocols to address the growing public health threat posed by obesity-driven thyroid cancer. Interventions targeting high-risk demographic groups and regions should be prioritised to reduce this increasing disease burden.
 
Author contributions
Concept or design: B Jiang, S Niu, X Sun, J Qu, Y Yu, C Zhang, J Li2, J Han.
Acquisition of data: J Li5, L Li, D Cai, Y Zhao, J Tian, J Lian, X Liu.
Analysis or interpretation of data: All authors.
Drafting of the manuscript: B Jiang, S Niu, X Sun, J Qu.
Critical revision of the manuscript for important intellectual content: Y Yu, C Zhang, J Li2, J Han.
 
All authors had full access to the data, contributed to the study, approved the final version for publication, and take responsibility for its accuracy and integrity.
 
Conflicts of interest
All authors have disclosed no conflicts of interest.
 
Funding/support
This research was funded by the Heilongjiang Province Postdoctoral Research Start-up Fund (Ref No.: 21042240063), the Fundamental Research Funds for the Provincial Universities (Ref No.: 2023-KYYWF-0236), the Fundamental Research Funds for the Provincial Universities (Ref No.: 2023-KYYWF-0234), and the Excellent Youth Program of the Fourth Affiliated Hospital of Harbin Medical University, China (Ref No.: HYDSYYXQN2023015). The funders had no role in study design, data collection, analysis, interpretation, or manuscript preparation.
 
Ethics approval
Detailed descriptions of the Global Burden of Disease (GBD) study design and analytical approaches have been extensively documented in existing GBD publications. The data used in this study were obtained from the GBD 2021 study database (https://ghdx.healthdata.org/gbd-2021), which contains no personally identifiable information. All original studies were reviewed and approved by the relevant ethics committees.
 
Supplementary material
The supplementary material was provided by the authors, and some information may not have been peer reviewed. Accepted supplementary material will be published as submitted by the authors, without any editing or formatting. Any opinions or recommendations discussed are solely those of the author(s) and are not endorsed by the Hong Kong Academy of Medicine and the Hong Kong Medical Association. The Hong Kong Academy of Medicine and the Hong Kong Medical Association disclaim all liability and responsibility arising from any reliance placed on the content.
 
References
1. Boucai L, Zafereo M, Cabanillas ME. Thyroid cancer: a review. JAMA 2024;331:425-35. Crossref
2. Pizzato M, Li M, Vignat J, et al. The epidemiological landscape of thyroid cancer worldwide: GLOBOCAN estimates for incidence and mortality rates in 2020. Lancet Diabetes Endocrinol 2022;10:264-72. Crossref
3. Sipos JA, Mazzaferri EL. Thyroid cancer epidemiology and prognostic variables. Clin Oncol (R Coll Radiol) 2010;22:395-404. Crossref
4. Nabhan F, Dedhia PH, Ringel MD. Thyroid cancer, recent advances in diagnosis and therapy. Int J Cancer 2021;149:984-92. Crossref
5. Kitahara CM, Sosa JA. The changing incidence of thyroid cancer. Nat Rev Endocrinol 2016;12:646-53. Crossref
6. Li C, Zhang J, Dionigi G, Liang N, Guan H, Sun H. Uncovering the connection between obesity and thyroid cancer: the therapeutic potential of adiponectin receptor agonist in the AdipoR2-ULK axis. Cell Death Dis 2024;15:708. Crossref
7. Lengyel E, Makowski L, DiGiovanni J, Kolonin MG. Cancer as a matter of fat: the crosstalk between adipose tissue and tumors. Trends Cancer 2018;4:374-84. Crossref
8. Deng Y, Li H, Wang M, et al. Global burden of thyroid cancer from 1990 to 2017. JAMA Netw Open 2020;3:e208759. Crossref
9. Zhai M, Zhang D, Long J, et al. The global burden of thyroid cancer and its attributable risk factor in 195 countries and territories: a systematic analysis for the Global Burden of Disease study. Cancer Med 2021;10:4542-54. Crossref
10. GBD 2021 Diseases and Injuries Collaborators. Global incidence, prevalence, years lived with disability (YLDs), disability-adjusted life-years (DALYs), and healthy life expectancy (HALE) for 371 diseases and injuries in 204 countries and territories and 811 subnational locations, 1990-2021: a systematic analysis for the Global Burden of Disease study 2021. Lancet 2024;403:2133-61. Crossref
11. Lou HR, Wang X, Gao Y, Zeng Q. Comparison of ARIMA model, DNN model and LSTM model in predicting disease burden of occupational pneumoconiosis in Tianjin, China. BMC Public Health 2022;22:2167. Crossref
12. Wang F, Ma B, Ma Q, Liu X. Global, regional, and national burden of inguinal, femoral, and abdominal hernias: a systematic analysis of prevalence, incidence, deaths, and DALYs with projections to 2030. Int J Surg 2024;110:1951-67. Crossref
13. Cheng X, Yang Y, Schwebel DC, et al. Population ageing and mortality during 1990-2017: a global decomposition analysis. PLoS Med 2020;17:e1003138. Crossref
14. Das Gupta P. Standardization and decomposition of rates from cross-classified data. Genus 1994;50:171-96.
15. Chen DW, Lang BH, McLeod DS, Newbold K, Haymart MR. Thyroid cancer. Lancet 2023;401:1531-44. Crossref
16. Suteau V, Munier M, Briet C, Rodien P. Sex bias in differentiated thyroid cancer. Int J Mol Sci 2021;22:12992. Crossref
17. Shobab L, Burman KD, Wartofsky L. Sex differences in differentiated thyroid cancer. Thyroid 2022;32:224-35. Crossref
18. Remer LF, Lee CI, Picado O, Lew JI. Sex differences in papillary thyroid cancer. J Surg Res 2022;271:163-70. Crossref
19. Murray CJ; GBD 2021 Collaborators. Findings from the Global Burden of Disease study 2021. Lancet 2024;403:2259-62. Crossref
20. Vaccarella S, Franceschi S, Bray F, Wild CP, Plummer M, Dal Maso L. Worldwide thyroid-cancer epidemic? The increasing impact of overdiagnosis. N Engl J Med 2016;375:614-7. Crossref
21. Wang H, Wang J, Wang X, et al. Comments on National guidelines for diagnosis and treatment of thyroid cancer 2022 in China (English version). Chin J Cancer Res 2022;34:447-50. Crossref
22. Chong B, Jayabaskaran J, Kong G, et al. Trends and predictions of malnutrition and obesity in 204 countries and territories: an analysis of the Global Burden of Disease study 2019. EClinicalMedicine 2023;57:101850. Crossref
23. Ng M, Fleming T, Robinson M, et al. Global, regional, and national prevalence of overweight and obesity in children and adults during 1980-2013: a systematic analysis for the Global Burden of Disease study 2013. Lancet 2014;384:766-81. Crossref
24. Schmid D, Ricci C, Behrens G, Leitzmann MF. Adiposity and risk of thyroid cancer: a systematic review and meta-analysis. Obes Rev 2015;16:1042-54. Crossref
25. Zhou T, Wang X, Zhang J, et al. Global burden of thyroid cancer from 1990 to 2021: a systematic analysis from the Global Burden of Disease study 2021. J Hematol Oncol 2024;17:74. Crossref
26. Iyengar NM, Gucalp A, Dannenberg AJ, Hudis CA. Obesity and cancer mechanisms: tumor microenvironment and inflammation. J Clin Oncol 2016;34:4270-6. Crossref
27. Engin A. Obesity-associated breast cancer: analysis of risk factors and current clinical evaluation. Adv Exp Med Biol 2024;1460:767-819. Crossref
28. Sohn W, Lee HW, Lee S, et al. Obesity and the risk of primary liver cancer: a systematic review and meta-analysis. Clin Mol Hepatol 2021;27:157-74. Crossref

Validation of EuroSCORE II in post–cardiac surgery patients in a tertiary institution in Hong Kong

Hong Kong Med J 2026 Apr;32(2):126–34 | Epub 13 Apr 2026
© Hong Kong Academy of Medicine. CC BY-NC-ND 4.0
 
ORIGINAL ARTICLE
Validation of EuroSCORE II in post–cardiac surgery patients in a tertiary institution in Hong Kong
Karen HL Ng, MStat1; Kailu Wang, PhD2; Takuya Fujikawa, MD1,3; Micky WT Kwok, MB, ChB, FRCS1,3; Jacky YK Ho, MB, ChB, FRCS1,3; Simon CY Chow, MB, ChB, FRCS1,3; Joyce WY Chan, MB, BS, FRCS1,3; Kevin Lim, MB, ChB, FRCS1,3; Aliss TC Chang, MB, ChB, FRCS1,3; Ivan CH Siu, MB, ChB, MRCS1,3; Randolph HL Wong, MB, ChB, FRCS1,3
1 Division of Cardiothoracic Surgery, Department of Surgery, Prince of Wales Hospital, Hong Kong SAR, China
2 Centre for Health Systems and Policy Research, The Jockey Club School of Public Health and Primary Care, Faculty of Medicine, The Chinese University of Hong Kong, Hong Kong SAR, China
3 Division of Cardiothoracic Surgery, Department of Surgery, The Chinese University of Hong Kong, Hong Kong SAR, China
 
Corresponding author: Prof Randolph HL Wong (wonhl1@surgery.cuhk.edu.hk)
 
 Full paper in PDF
 
Abstract
Introduction: This study aimed to assess the discriminatory ability and calibration performance of the European System for Cardiac Operative Risk Evaluation (EuroSCORE) II, a widely used risk prediction tool, in predicting postoperative mortality among patients undergoing cardiac surgery at Prince of Wales Hospital (PWH) in Hong Kong.
 
Methods: Complete data from 4180 patients who underwent cardiac surgery at PWH between 2013 and 2023 were available for validation of EuroSCORE II and comparison of its discriminatory ability with the logistic EuroSCORE. Discriminatory performance was primarily assessed using the area under the receiver operating characteristic curve (AUROC). Calibration was evaluated using the Hosmer–Lemeshow test, coefficient of determination (R2), and normalised root mean square error (NRMSE).
 
Results: EuroSCORE II demonstrated strong discrimination and good calibration for predicting 30-day mortality in the overall cohort (AUROC=0.829; Hosmer–Lemeshow P=0.155) and key subgroups: isolated coronary artery bypass grafting (CABG) [AUROC=0.847; P=0.113], isolated valve surgery (AUROC=0.810; P=0.162), and aortic surgery (AUROC=0.735; P=0.549). More than 85% of the variation in 30-day mortality (R2) was explained across these groups. Compared with the logistic EuroSCORE, EuroSCORE II showed improved discrimination and calibration, with higher AUROC values and lower NRMSE.
 
Conclusion: EuroSCORE II demonstrates strong discriminatory ability and good calibration for predicting 30-day mortality among patients undergoing cardiac surgery and within key subgroups—isolated CABG, isolated valve surgery, and aortic surgery—in this cohort.
 
 
New knowledge added by this study
  • The European System for Cardiac Operative Risk Evaluation (EuroSCORE) II demonstrates strong discriminatory ability and good calibration for predicting 30-day mortality among patients undergoing cardiac surgery at Prince of Wales Hospital (PWH) in Hong Kong.
  • EuroSCORE II demonstrates improved discrimination and calibration compared with the logistic EuroSCORE in the overall cardiac surgery cohort at PWH.
  • Within the aortic subgroup, EuroSCORE II demonstrates statistically significant improvements in discrimination and calibration relative to the logistic EuroSCORE.
Implications for clinical practice or policy
  • EuroSCORE II represents a reliable risk stratification tool for guiding treatment decisions, identifying high-risk patients and optimising resource allocation.
  • Incorporation of additional variables into EuroSCORE II may further enhance predictive accuracy and enable tailored interventions for post–cardiac surgery patients.
 
 
Introduction
The Global Burden of Disease Results Tool of the Institute for Health Metrics and Evaluation reported that cardiovascular diseases accounted for approximately 10 383 550 deaths globally in 2017, representing 18.56% of all-cause mortality.1 Cardiothoracic surgery plays an important role in the treatment of these conditions and in reducing associated morbidity and mortality. However, surgery carries inherent risks that vary among patients, necessitating careful evaluation of risks and benefits before proceeding. A risk stratification tool is essential for effective patient triage and the consent process.
 
One widely used risk stratification tool is the European System for Cardiac Operative Risk Evaluation (EuroSCORE), a specialised scoring system that provides customised predictions of in-hospital mortality after cardiac surgery. The tool assigns scores based on various preoperative risk factors to stratify patients into different risk categories (low: EuroSCORE <4%, intermediate: 4-8%, high: >8%).2 In the UK, in-hospital mortality declined from 4.0% to 2.8% between 2002 and 2016 following implementation of EuroSCORE,3 supporting its value in cardiac surgical risk assessment. The EuroSCORE comprises three versions: the additive EuroSCORE,4 the logistic EuroSCORE,5 and EuroSCORE II.6 In 2012, the Society for Cardiothoracic Surgery in Great Britain and Ireland recommended the use of the latest version, EuroSCORE II.6
 
Prince of Wales Hospital (PWH) in Hong Kong has adopted the logistic EuroSCORE for risk assessment since 2007. However, several publications from different countries have raised concerns regarding the accuracy of the additive and logistic EuroSCORE models, leading to the development of EuroSCORE II.7 8 9 Consequently, EuroSCORE II has been proposed as the future risk adjustment tool of the Society for Cardiothoracic Surgery in Great Britain and Ireland following successful contemporary validation.6 10 11
 
Although EuroSCORE II has been widely used and validated, the underlying data were predominantly derived from Western populations undergoing cardiac surgery in Europe and the US.4 12 13 14 Therefore, studies evaluating the performance of EuroSCORE II in Asian populations remain limited,15 16 17 and none has been conducted specifically in Hong Kong. Furthermore, no studies have compared the performance of the logistic EuroSCORE and EuroSCORE II in the Hong Kong population. The present study aimed to address these gaps.
 
Moreover, Hong Kong has a higher proportion of aortic surgery than Western countries. Prince of Wales Hospital reported a surge in aortic surgeries, reaching 26% between 2021 and 2022,18 whereas the UK reported an aortic surgery prevalence of 3.47% between 2015 and 2016.3 We therefore sought to investigate whether this variation influences the validity of EuroSCORE II through subgroup analyses.
 
The primary objective of this study was to assess the discriminatory ability and calibration of EuroSCORE II in predicting postoperative mortality after the three main index cardiac surgeries (ie, coronary artery bypass grafting [CABG], valve surgery, and aortic surgery) at our centre.2 7 8 9 14 15 16 17 19 20 21 22 23 The secondary objective was to compare the discriminatory ability and calibration of EuroSCORE II with those of the logistic EuroSCORE in patients undergoing cardiac surgery.
 
Methods
Study design and population cohort
This retrospective validation study included patients (aged ≥18 years) who underwent all types of cardiac surgery—including CABG, valve surgery (eg, aortic valve replacement, mitral valve replacement, and tricuspid valve repair), aortic surgery, isolated or combined procedures, and other procedures (eg, left atrial appendage closure) at PWH between 1 January 2013 and 31 December 2023 (inclusive) [Fig]. Because PWH does not perform certain cardiothoracic procedures—such as paediatric cardiac surgery, cardiac transplantation, and oesophageal surgery—records for these interventions were unavailable. For patients who underwent multiple cardiac surgeries during the same hospital admission, only the first index procedure was analysed. The minimum sample size of 225 was calculated based on estimates of area under the receiver operating characteristic curve (AUROC) from the literature7 and the estimated prevalence of the outcome (online supplementary Table),7 24 indicating that our primary cohorts for CABG, valve surgery, and aortic surgery exceeded the required sample size.
 

Figure. Patient population selection (n=4180)
 
Data collection and outcomes
The Dendrite cardiac surgery database (Dendrite Clinical Systems, Oxford, United Kingdom)25 was utilised for secondary data collection (Fig). This database captures clinically relevant information, including preoperative medical records and postoperative complications for patients undergoing cardiac surgery. All key variables required to calculate EuroSCORE II6 and the logistic EuroSCORE5 were extracted. Mortality, the primary outcome, was defined as death within 30 days of the index operation (regardless of place of death), consistent with previous studies.2 9 14 15 21
 
Statistical analyses
Cases with missing or incomplete data required for calculation of EuroSCORE II were excluded from the analysis. Analyses were performed for the overall cohort and stratified by individual cardiac procedure. Complete data were available for validation of EuroSCORE II and comparison of its predictive performance with that of the logistic EuroSCORE for postoperative mortality.
 
Univariate and multivariate binary logistic regression analyses were conducted on all relevant variables included in the EuroSCORE II scale to identify significant covariates associated with an increased risk of mortality.
 
The discriminatory performance of the predictive models was evaluated using the AUROC; values of 0.8 or above indicated strong discrimination, and 1.0 indicated perfect discrimination. Pairwise comparisons of AUROCs for individual cardiac procedures were performed using the DeLong test, with the threshold for statistical significance set at P<0.05.
 
Calibration of the predictive model was evaluated using the Hosmer–Lemeshow goodness-of-fit test and calibration plots, through statistical and graphical assessment of agreement between observed and expected event rates within model subgroups. A P value >0.05 and a regression line approximating the 45-degree diagonal indicated good calibration, reflecting adequate agreement between observed and predicted event rates.
 
Model goodness of fit was further assessed using the coefficient of determination (R2), which quantifies the proportion of variance explained by the model, and the normalised root mean square error (NRMSE), which measures predictive accuracy by comparing predicted and observed values, normalised to the data range. Higher R2 values and lower NRMSE values indicate better model fit.
 
Statistical analyses were performed using SPSS (Windows version 29.0; IBM Corp, Armonk [NY], United States), Microsoft Excel 2019, and R software (RStudio, version 2024.04.2).
 
Results
Patient characteristics
The study cohort comprised 4180 patients (Fig). Table 1 summarises the characteristics of the overall cohort and relevant subgroups. The median age was 63 years (interquartile range, 56-69), and 29.2% (n=1222) were women. Aortic operations were performed in 21.1% (n=883) of patients and the majority underwent a single non-coronary procedure (36.9%, n=1541). For the overall cohort, the median logistic EuroSCORE value was 5.8 (interquartile range, 2.6-13.7), whereas median EuroSCORE II value was 2.4 (interquartile range, 1.2-5.3). The institutional 30-day mortality rate for all cardiac procedures was 4.2%.
 

Table 1. Patient demographics and characteristics
 
Primary outcome
Discriminatory and calibration performance
The AUROC for EuroSCORE II was 0.829, indicating strong discriminatory ability. The Hosmer–Lemeshow P value for EuroSCORE II was 0.155, indicating no statistically significant difference between predicted and observed values (online supplementary Fig a). Accordingly, EuroSCORE II demonstrated acceptable calibration.
 
Comparison between logistic EuroSCORE and EuroSCORE II
EuroSCORE II demonstrated a statistically significant improvement in discriminatory performance compared with the logistic EuroSCORE (DeLong P=0.006). Additionally, EuroSCORE II showed superior calibration, supported by a significant Hosmer–Lemeshow test result for the logistic EuroSCORE (P<0.001). Calibration curves comparing observed and predicted 30-day mortality were consistent with these findings, further indicating better calibration with EuroSCORE II than with the logistic EuroSCORE. More than 90% of the variation in 30-day mortality was explained by both models (R2 for EuroSCORE II=98.7%; R2 for logistic EuroSCORE=99.1%). Notably, EuroSCORE II demonstrated a substantially lower NRMSE (5.7%) than the logistic EuroSCORE (56.4%), indicating reduced dispersion and relative variability in predictions (online supplementary Fig a).
 
Subgroup analysis
Isolated coronary artery bypass surgery
In this subgroup, EuroSCORE II demonstrated strong discriminatory performance (AUROC=0.847) and acceptable calibration (Hosmer–Lemeshow P=0.113). There was no statistically significant difference in discriminatory performance between EuroSCORE II and the logistic EuroSCORE (DeLong P=0.529). However, EuroSCORE II showed better calibration, supported by a significant Hosmer–Lemeshow test result for the logistic EuroSCORE (P<0.001) and calibration curves favouring EuroSCORE. More than 85% of the variation in 30-day mortality was explained by both models (R2 for EuroSCORE II=87.7%; R2 for logistic EuroSCORE=91.4%). Compared with the logistic EuroSCORE (40.6%), EuroSCORE II demonstrated a lower NRMSE (13.0%), indicating reduced dispersion and relative variability (online supplementary Fig b).
 
Isolated valve surgery
In this subgroup, EuroSCORE II demonstrated strong discriminatory performance (AUROC=0.810) and acceptable calibration (Hosmer–Lemeshow P=0.162). There was no statistically significant difference in discriminatory performance between EuroSCORE II and the logistic EuroSCORE (DeLong P=0.160). Nevertheless, EuroSCORE II demonstrated superior calibration, supported by a significant Hosmer–Lemeshow test result for the logistic EuroSCORE (P<0.001) and calibration curves favouring EuroSCORE II. More than 90% of the variation in 30-day mortality was explained by both models (R2 for EuroSCORE II=94.7%; R2 for logistic EuroSCORE=94.4%). Compared with the logistic EuroSCORE (80.4%), EuroSCORE II demonstrated a lower NRMSE (21.8%), indicating reduced dispersion and relative variability (online supplementary Fig c).
 
Aortic surgery
In this subgroup, EuroSCORE II demonstrated satisfactory discriminatory performance (AUROC=0.735) and good calibration (Hosmer–Lemeshow P=0.549). It also showed a statistically significant improvement in discrimination compared with the logistic EuroSCORE (DeLong P<0.001). Calibration was also superior, supported by a significant Hosmer–Lemeshow test result for the logistic EuroSCORE (P<0.001) and calibration curves favouring EuroSCORE II. More than 90% of the variation in 30-day mortality was explained by EuroSCORE II (R2 for EuroSCORE II=96.1%; R2 for logistic EuroSCORE=76.6%). EuroSCORE II also demonstrated a lower NRMSE (6.6%) than the logistic EuroSCORE (98.8%), indicating reduced dispersion and relative variability (online supplementary Fig d).
 
Combined valve and coronary artery bypass surgery
In this subgroup, EuroSCORE II demonstrated fair discriminatory performance (AUROC=0.694) and good calibration (Hosmer–Lemeshow P=0.606). There was no statistically significant difference in discriminatory performance between EuroSCORE II and the logistic EuroSCORE (DeLong P=0.913). Both models exhibited adequate calibration (EuroSCORE II P=0.606; logistic EuroSCORE P=0.280) [online supplementary Fig e].
 
Combined valve or coronary artery bypass surgery and other procedures
In this subgroup, EuroSCORE II demonstrated strong discriminatory performance (AUROC=0.862) and acceptable calibration (Hosmer–Lemeshow P=0.159). There was no statistically significant difference in discriminatory performance between EuroSCORE II and the logistic EuroSCORE (DeLong P=0.248). However, EuroSCORE II exhibited superior calibration compared with the logistic EuroSCORE (Hosmer–Lemeshow P=0.062) [online supplementary Fig f].
 
Other procedures
In this subgroup, EuroSCORE II demonstrated strong discriminatory performance (AUROC=0.872) but poor calibration (Hosmer–Lemeshow P<0.001). There was no statistically significant difference in discriminatory performance between EuroSCORE II and the logistic EuroSCORE (DeLong P=0.626). Notably, calibration curves favoured EuroSCORE II over the logistic EuroSCORE (online supplementary Fig g).
 
Multivariate binary logistic regression analysis
Furthermore, comparison of EuroSCORE II variables with multivariable analyses from PWH database identified dialysis as an additional significant predictor of increased 30-day mortality (adjusted odds ratio=3.401) among patients undergoing cardiac surgery (Table 2).
 

Table 2. Multivariable analysis of risk factors associated with postoperative mortality in the overall cohort (n=4180)
 
Discussion
In the present study, EuroSCORE II demonstrated strong discriminatory performance and good calibration in the overall cohort and three key subgroups (isolated CABG, isolated valve surgery and aortic surgery). Moreover, EuroSCORE II outperformed the logistic EuroSCORE in both discrimination and calibration across the overall cohort and these principal subgroups.
 
Our results are consistent with validation studies conducted in several European countries (Italy,26 Greece,27 Serbia,28 Spain,29 and Hungary30), which demonstrated strong discriminatory performance (AUROC >0.7) for EuroSCORE II.26 27 28 29 30 31 These findings reaffirm the robust predictive performance of EuroSCORE II for mortality in patients undergoing cardiac surgery.
 
In addition to European populations, our findings align with those of validation studies conducted in Asian cohorts.15 16 17 23 Specifically, Liu et al15 demonstrated strong discriminatory performance for EuroSCORE II, with an AUROC of 0.792 in a single-centre setting. This concordance further supports the consistency and reliability of EuroSCORE II as a mortality prediction tool in Asian cardiac surgery populations.
 
However, Kurniawaty et al19 reported considerably different findings, demonstrating only fair discriminatory performance, with evidence of miscalibration and underprediction in an Indonesian population. This discrepancy may be attributable to differences in patient age. Both our cohort and the European cohorts had substantially higher median (63 years) or mean (64.6 years)6 ages compared with the mean age in the Indonesian cohort (44 years)19. Given the younger age profile and lower prevalence of risk factors included in the EuroSCORE II model among Indonesian patients, its predictive performance may be limited in that population. Accordingly, these findings may be less generalisable to the Hong Kong population.
 
For the overall cohort, EuroSCORE II demonstrated superior performance in both discrimination and calibration compared with the logistic EuroSCORE. This difference may reflect the tendency of the logistic EuroSCORE to overestimate mortality risk, particularly in high-risk emergency patients.10 Consequently, EuroSCORE II appears to provide more accurate risk stratification than the logistic EuroSCORE.
 
For isolated CABG procedures, the discriminatory performance of EuroSCORE II was strong in our study, supported by a non-significant Hosmer–Lemeshow statistic, consistent with findings from a large UK validation cohort.7 Studies conducted in Finland32 (AUROC=0.852) and China16 (AUROC=0.762) similarly demonstrated robust discriminatory performance of EuroSCORE II in predicting operative mortality among high-risk isolated CABG patients and those undergoing CABG with or without concomitant major cardiac surgery. However, a study from Singapore reported poor discrimination and calibration, particularly in moderate- and high-risk cohorts.33 Comparable findings were reported in studies from Indonesia22 and Malaysia,23 which demonstrated fair discrimination but underestimation of mortality after isolated CABG. These discrepancies suggest that additional caution may be warranted when applying EuroSCORE II in isolated CABG populations. Differences in demographic characteristics or study design may contribute to variability in model performance, warranting further investigation.
 
For aortic procedures, EuroSCORE II demonstrated higher AUROC values and more favourable Hosmer–Lemeshow P values than the logistic EuroSCORE. Nevertheless, caution is warranted because the model does not incorporate specific procedural variables (eg, open surgery vs minimally invasive approaches) as risk factors, which may limit precision in mortality prediction for aortic surgery.7
 
The adoption of contemporary machine learning and artificial intelligence techniques, rather than logistic regression, may offer more effective modelling approaches for capturing complex, non-linear interactions among established risk factors. Furthermore, incorporating the statistically significant variable identified through multivariate analysis of the PWH database, specifically dialysis, into a future EuroSCORE III model may further enhance its predictive performance.
 
Strengths
First, the robustness of this validation study is supported by its substantial sample size (n=4180), which increases statistical power, enables detection of smaller effects, and enhances generalisability. Second, the absence of missing data strengthens measurement completeness and the credibility of the validation process, reduces information bias, and facilitates a more precise evaluation of EuroSCORE II predictive performance within this large cohort.
 
Limitations
First, reliance on data from a single institution may introduce sampling bias. Therefore, multi-centre analyses should be conducted in future, provided sufficient resources are available. Second, the retrospective design limited the study by precluding long-term follow-up after patient discharge. Consequently, the analysis did not capture longer-term outcomes that may be influenced by baseline EuroSCORE II risk estimates. Additionally, the cohort demonstrated a skewed distribution across risk categories, with a substantial proportion (>85.2%) categorised as low or intermediate risk, thereby limiting generalisability to high-risk populations.
 
Future research
First, in aortic surgery, the discrepancy in EuroSCORE II performance observed between Hong Kong and the UK indicates a need for further investigation.10 A meta-analysis focusing on validation of EuroSCORE II in aortic procedures could help refine risk assessment in this subgroup. Second, although EuroSCORE II is a valuable risk stratification tool in cardiac surgery, minimally invasive cardiac procedures34 and certain established risk factors (eg, diffuse coronary artery disease and aortic calcification)15 are not included in the model. Accordingly, there may be a need for in-depth evaluation of their relevance to EuroSCORE II calculation. Third, multi-centre studies would enable validation of these findings on a broader scale. Collaboration with the other two cardiac centres in Hong Kong would enhance generalisability and support more robust conclusions.
 
Conclusion
In our cohort, EuroSCORE II demonstrated strong discriminatory performance and good calibration for predicting 30-day postoperative mortality among patients undergoing cardiac surgery. It also shows superior calibration and comparable or improved discrimination in the three principal subgroups—isolated CABG, isolated valve surgery, and aortic surgery—compared with the logistic EuroSCORE. Accordingly, EuroSCORE II represents a risk stratification tool superior to the logistic EuroSCORE and is well suited for use in Hong Kong.
 
Author contributions
Concept or design: KHL Ng, T Fujikawa, K Wang, RHL Wong.
Acquisition of data: KHL Ng, MWT Kwok, JYK Ho, SCY Chow, JWY Chan, K Lim, ATC Chang, ICH Siu, T Fujikawa, RHL Wong.
Analysis or interpretation of data: KHL Ng, T Fujikawa, K Wang, RHL Wong.
Drafting of the manuscript: KHL Ng, T Fujikawa, K Wang, RHL Wong.
Critical revision of the manuscript for important intellectual content: KHL Ng, T Fujikawa, RHL Wong.
 
All authors had full access to the data, contributed to the study, approved the final version for publication, and take responsibility for its accuracy and integrity.
 
Conflicts of interest
All authors have disclosed no conflicts of interest.
 
Acknowledgement
The authors thank Dr Simon KS Yau from Department of Family Medicine of the New Territories East Cluster for his insightful contributions to data interpretation and manuscript revision.
 
Declaration
This research was presented at The Hospital Authority Convention 2025 (26 May 2025, Hong Kong).
 
Funding/support
This research received no specific grant from any funding agency in the public, commercial, or not-for-profit sectors.
 
Ethics approval
This research was approved by the Institutional Review Board of The Chinese University of Hong Kong/Hospital Authority New Territories East Cluster, Hong Kong (Ref No.: 2024.571). The requirement for informed patient consent was waived by the Board due to the retrospective nature of the study.
 
Supplementary material
The supplementary material was provided by the authors and some information may not have been peer reviewed. Accepted supplementary material will be published as submitted by the authors, without any editing or formatting. Any opinions or recommendations discussed are solely those of the author(s) and are not endorsed by the Hong Kong Academy of Medicine and the Hong Kong Medical Association. The Hong Kong Academy of Medicine and the Hong Kong Medical Association disclaim all liability and responsibility arising from any reliance placed on the content.
 
References
1. Vervoort D, Swain JD, Pezzella AT, Kpodonu J. Cardiac surgery in low- and middle-income countries: a state-of-the-art review. Ann Thorac Surg 2021;111:1394-400. Crossref
2. Silverborn M, Nielsen S, Karlsson M. The performance of EuroSCORE II in CABG patients in relation to sex, age, and surgical risk: a nationwide study in 14,118 patients. J Cardiothorac Surg 2023;18:40. Crossref
3. Society for Cardiothoracic Surgery in Great Britain and Ireland. Blue Books. Available from: https://scts.org/professionals/reports/resources/. Accessed 10 Sep 2024.
4. Nashef SA, Roques F, Michel P, Gauducheau E, Lemeshow S, Salamon R. European System for Cardiac Operative Risk Evaluation (EuroSCORE). Eur J Cardiothorac Surg 1999;16:9-13. Crossref
5. Roques F, Michel P, Goldstone AR, Nashef SA. The logistic EuroSCORE. Eur Heart J 2003;24:881-2. Crossref
6. Nashef SA, Roques F, Sharples LD, et al. EuroSCORE II. Eur J Cardiothorac Surg 2012;41:734-44. Crossref
7. Chalmers J, Pullan M, Fabri B, et al. Validation of EuroSCORE II in a modern cohort of patients undergoing cardiac surgery. Eur J Cardiothorac Surg 2013;43:688-94. Crossref
8. Zheng Z, Li Y, Zhang S, et al. The Chinese coronary artery bypass grafting registry study: how well does the EuroSCORE predict operative risk for Chinese population? Eur J Cardiothorac Surg 2009;35:54-8. Crossref
9. Yap CH, Reid C, Yii M, et al. Validation of the EuroSCORE model in Australia. Eur J Cardiothorac Surg 2006;29:441-6. Crossref
10. Grant SW, Hickey GL, Dimarakis I, et al. Performance of the EuroSCORE models in emergency cardiac surgery. Circ Cardiovasc Qual Outcomes 2013;6:178-85. Crossref
11. Grant SW, Hickey GL, Dimarakis I, et al. How does EuroSCORE II perform in UK cardiac surgery; an analysis of 23 740 patients from the Society for Cardiothoracic Surgery in Great Britain and Ireland National Database. Heart 2012;98:1568-72. Crossref
12. Roques F, Nashef SA, Michel P, et al. Risk factors and outcome in European cardiac surgery: analysis of the EuroSCORE multinational database of 19030 patients. Eur J Cardiothorac Surg 1999;15:816-22. Crossref
13. Gogbashian A, Sedrakyan A, Treasure T. EuroSCORE: a systematic review of international performance. Eur J Cardiothorac Surg 2004;25:695-700. Crossref
14. Nashef SA, Roques F, Hammill BG, et al. Validation of European System for Cardiac Operative Risk Evaluation (EuroSCORE) in North American cardiac surgery. Eur J Cardiothorac Surg 2002;22:101-5. Crossref
15. Liu PH, Shih HH, Kang PL, Pan JY, Wu TH, Wu CJ. Performance of the EuroSCORE II model in predicting short-term mortality of general cardiac surgery: a single-center study in Taiwan. Acta Cardiol Sin 2022;38:495-503. Crossref
16. Shen L, Chen X, Gu J, Xue S. Validation of EuroSCORE II in Chinese patients undergoing coronary artery bypass surgery. Heart Surg Forum 2018;21:E036-9. Crossref
17. Zhang GX, Wang C, Wang L, et al. Validation of EuroSCORE II in Chinese patients undergoing heart valve surgery. Heart Lung Circ 2013;22:606–11. Crossref
18. Prince of Wales Hospital, The Chinese University of Hong Kong. Cardiac Surgery Report 2021–22. Available from: https://www.surgery.cuhk.edu.hk/cts/Cardiac_Surgery_Report_2021-22.pdf. Accessed 4 Sep 2024.
19. Kurniawaty J, Setianto BY, Widyastuti Y, Supomo S, Boom CE, Ancilla C. Validation for EuroSCORE II in the Indonesian cardiac surgical population: a retrospective, multicenter study. Expert Rev Cardiovasc Ther 2022;20:491-6. Crossref
20. Sembiring YE, Ginting A, Puruhito I, Budiono K. Validation of EuroSCORE II to predict mortality in post-cardiac surgery patients in East Java tertiary hospital. Med J Indones 2021;30:54-9. Crossref
21. Atashi A, Amini S, Tashnizi MA, et al. External validation of European System for Cardiac Operative Risk Evaluation II (EuroSCORE II) for risk prioritization in an Iranian population. Braz J Cardiovasc Surg 2018;33:40-6. Crossref
22. Zahara R, Soeharto DF, Widyantoro B, Sugisman, Herlambang B. Validation of EuroSCORE II scoring system on isolated CABG patient in Indonesia. Egypt Heart J 2023;75:86. Crossref
23. Musa AF, Cheong XP, Dillon J, Nordin RB. Validation of EuroSCORE II in patients undergoing coronary artery bypass grafting (CABG) surgery at the National Heart Institute, Kuala Lumpur: a retrospective review. F1000Res 2018;7:534. Crossref
24. Riley RD, Ensor J, Snell KI, et al. Calculating the sample size required for developing a clinical prediction model. BMJ 2020;368:m441. Crossref
25. Dendrite Clinical Systems. Databases for hospitals and clinics. Available from: https://www.e-dendrite.com/hospital-systems. Accessed 5 Sep 2024.
26. Paparella D, Guida P, Di Eusanio G, et al. Risk stratification for in-hospital mortality after cardiac surgery: external validation of EuroSCORE II in a prospective regional registry. Eur J Cardiothorac Surg 2014;46:840-8. Crossref
27. Stavridis G, Panaretos D, Kadda O, Panagiotakos DB. Validation of the EuroSCORE II in a Greek cardiac surgical population: a prospective study. Open Cardiovasc Med J 2017;11:94-101. Crossref
28. Nezic D, Spasic T, Micovic S, et al. Consecutive observational study to validate EuroSCORE II performances on a single-center, contemporary cardiac surgical cohort. J Cardiothorac Vasc Anesth 2016;30:345-51. Crossref
29. Garcia-Valentin A, Mestres CA, Bernabeu E, et al. Validation and quality measurements for EuroSCORE and EuroSCORE II in the Spanish cardiac surgical population: a prospective, multicentre study. Eur J Cardiothorac Surg 2016;49:399-405. Crossref
30. Koszta G, Sira G, Szatmári K, Farkas E, Szerafin T, Fülesdi B. Performance of EuroSCORE II in Hungary: a single-centre validation study. Heart Lung Circ 2014;23:1041-50. Crossref
31. Barili F, Pacini D, Capo A, et al. Does EuroSCORE II perform better than its original versions? A multicentre validation study. Eur Heart J 2013;34:22-9. Crossref
32. Biancari F, Vasques F, Mikkola R, Martin M, Lahtinen J, Heikkinen J. Validation of EuroSCORE II in patients undergoing coronary artery bypass surgery. Ann Thorac Surg 2012;93:1930-5. Crossref
33. Luo HD, Teoh LK, Gaudino MF, Fremes S, Kofidis T. The Asian system for cardiac operative risk evaluation for predicting mortality after isolated coronary artery bypass graft surgery (ASCORE-C). J Card Surg 2020;35:2574-82. Crossref
34. Ilcheva L, Risteski P, Tudorache I, et al. Beyond conventional operations: embracing the era of contemporary minimally invasive cardiac surgery. J Clin Med 2023;12:7210. Crossref

Descriptive analysis of platelet-rich plasma injection therapy in chronic musculoskeletal pain

Hong Kong Med J 2026 Apr;32(2):121–5 | Epub 15 Apr 2026
© Hong Kong Academy of Medicine. CC BY-NC-ND 4.0
 
ORIGINAL ARTICLE
Descriptive analysis of platelet-rich plasma injection therapy in chronic musculoskeletal pain
Mandy HM Chu, MB, ChB, FANZCA1; WS Chan, FANZCA, FHKCA (Pain Medicine)2; Ara CY Li, FANZCA, FHKCA (Pain Medicine)3; Henry MK Wong, MB, ChB, FANZCA1; HL Wong, HDip, BSc1; KM Ho, FANZCA, FCICM1
1 Department of Anaesthesia and Intensive Care, The Chinese University of Hong Kong, Hong Kong SAR, China
2 Peter Hung Pain Specialist Clinic, CUHK Medical Centre, Hong Kong SAR, China
3 Department of Anaesthesia, Pain and Perioperative Medicine, Prince of Wales Hospital, Hong Kong SAR, China
 
Corresponding author: Prof Mandy HM Chu (hiumanchu@cuhk.edu.hk)
 
 Full paper in PDF
 
Abstract
Introduction: Platelet-rich plasma (PRP) injections have been used to manage various chronic pain conditions. However, evidence remains limited due to poor standardisation across practices. In this descriptive study, we aimed to characterise current PRP practice patterns at a university-affiliated private pain clinic in Hong Kong, focusing on case mix and treatment outcomes in patients with chronic musculoskeletal pain.
 
Methods: This retrospective descriptive study included patients with diverse chronic musculoskeletal pain conditions aged 18 years or older who attended the CUHK Medical Centre Peter Hung Pain Specialist Clinic and received PRP injection therapy between January 2023 and December 2024. Improvements in pain and changes in oral analgesic use were recorded.
 
Results: In total, 248 patients were included. Prior to PRP treatment, over 70% required multiple oral analgesics for pain control, including 55.6% taking antidepressants, 41.5% gabapentin or pregabalin, and 25.8% oral opioids. At first follow-up (median: 4 weeks, range: 1-20), more than 60% reported ‘moderate’ or ‘much’ improvement in pain symptoms. By 12 months post-treatment, fewer than 10% of patients in each category continued to require oral opioids, antidepressants, gabapentin, or pregabalin. Of the 26 patients (10.5%) who required a second PRP session, only one reported no improvement.
 
Conclusion: These results highlight the potential utility of PRP in managing chronic musculoskeletal pain and underscore the need for randomised controlled trials to confirm its long-term impact on quality of life of patients.
 
 
New knowledge added by this study
  • Musculoskeletal pain is a common clinical manifestation in Hong Kong.
  • Leukocyte-rich platelet-rich plasma (PRP) provided convincing pain improvement across various types of musculoskeletal pain, with reduction or discontinuation of oral analgesics.
  • The effect of PRP injection was more pronounced in patients with a shorter duration of chronic pain.
Implications for clinical practice or policy
  • Randomised controlled trials with standardised PRP preparation in specific patient groups are needed.
  • Platelet-rich plasma injection may be beneficial for chronic pain; however, further evidence is required.
 
 
Introduction
Platelet-rich plasma (PRP) refers to plasma with a platelet concentration higher than that found in whole blood. It is classified into four types based on its leukocyte and fibrin content: leukocyte-rich or -poor, and fibrin-rich or -poor.1 Initially used by haematologists in the 1970s as platelet transfusions for thrombocytopenia, PRP gained traction in the 1980s in maxillofacial surgery and sports medicine due to its potential anti-inflammatory effects.2 Since then, its applications have extended to regenerative medicine and pain management because of its abundance of growth factors and cytokines.3 Despite its widespread use in degenerative and pain conditions—such as osteoarthritis, low back pain, and tendinitis—evidence for PRP efficacy in humans remains limited and controversial.4 5 Understanding of PRP practice and efficacy among anaesthetists is particularly scarce. This study aimed to characterise current PRP practice patterns at a university-affiliated private pain clinic in Hong Kong, focusing on case mix and treatment outcomes in patients with chronic musculoskeletal pain.
 
Methods
Study population
This study included patients aged 18 years or older who attended the CUHK Medical Centre Peter Hung Pain Specialist Clinic and received PRP injection therapy for chronic pain between January 2023 and December 2024. Patients were excluded if they were younger than 18 years, had been diagnosed with cancer-related pain, or did not proceed with PRP therapy after pain assessment.
 
Leukocyte-rich PRP was prepared by collecting autologous blood and subjecting it to two centrifugation cycles using sterile technique and an Eppendorf Centrifuge 5702 (Eppendorf SE, Hamburg, Germany). Whole blood was first centrifuged at 3800 rpm for 2 minutes to sediment red blood cells and form a buffy coat-rich plasma layer, without excessive platelet loss into the erythrocyte fraction. The plasma/buffy coat fraction was then transferred and centrifuged again at 3800 rpm for 5 minutes, applying the same centrifugal force in longer duration to this less viscous, cell-reduced plasma to achieve further platelet sedimentation and centration while minimising platelet damage or premature activation. The same force with longer duration is considered having the same effect as higher force with shorter duration by the manufacturer. Each PRP injection session targeted all painful regions deemed suitable by the same attending pain specialist under monitored anaesthesia care or general anaesthesia.
 
Data were extracted from the pain clinic and hospital databases, including patient age, sex, sites and types of chronic pain, duration of pain prior to PRP therapy, use of pain medications, history of surgical or interventional procedures for pain, and the indications, locations, and dosage for each PRP treatment. Standard pain assessment for patients undergoing PRP therapy included evaluation of overall and site-specific pain improvement at follow-up visits. In this study, pain improvement at the first follow-up after PRP therapy was specifically assessed and categorised as ‘no improvement’, ‘mildly improved’, ‘moderately improved’, or ‘much improved’. Additional outcomes included the proportion of patients able to discontinue oral analgesics and identification of factors associated with a favourable pain relief response to PRP therapy.
 
Statistical analyses
Results are presented as numbers (with percentages) and medians (with interquartile ranges [IQRs] and ranges). Categorical variables before and after PRP therapy were compared using the McNemar test. One-way analysis of variance was used to assess the association between the duration of chronic pain prior to PRP therapy and the likelihood of reporting ‘much improved’ pain at the first follow-up. Logistic regression analysis was conducted to determine whether specific pain pathologies or anatomical regions were associated with better responses to PRP therapy. All statistical tests were two-tailed and performed using SPSS (Windows version 29.0; IBM Corp, Armonk [NY], United States). A P value <0.05 was considered statistically significant.
 
Results
A total of 248 patients aged 20 to 97 years who received at least one session of PRP therapy during the study period were included. Of these, 61.3% were women. The duration of pain prior to PRP therapy varied widely, ranging from 1 month to over 20 years, with a median of 15 months. More than 70.2% of patients (n=174) were taking two or more analgesics before PRP therapy. Fourteen patients (5.6%) had previously received ketamine infusions for pain; two of these had undergone interventional procedures such as radiofrequency thermocoagulation of the trigeminal ganglion, ultrasound- and X-ray–guided radiofrequency with injection to the left glossopharyngeal nerve, and X-ray–guided steroid injection at the L4/5 level of the lumbar spine. Ninety patients (36.3%) reported pain in more than one anatomical region. Baseline characteristics, including analgesic use, are summarised in Table 1.
 

Table 1. Patient characteristics at baseline (n=248)
 
Platelet-rich plasma therapy was administered to 404 anatomical sites across the 248 patients. The median volume of PRP injected during the first session was 17.0 mL (mean=18.3, IQR=10.0-20.5; range, 2-50). Twenty-six patients (10.5%) required more than one PRP session, with a median interval of 4.0 months (mean=4.0, IQR=2.8-5.0; range, 1-15). Seven patients (2.8%) received three sessions during the 2-year study period.
 
The median time to first follow-up after PRP therapy was 4.0 weeks (mean=4.5, IQR=4.0-4.5; range, 1-20). Thirty patients (12.1%) did not return for follow-up. Among the remaining 218 patients, over 60% reported their pain as either ‘moderately improved’ or ‘much improved’. The distribution of pain relief levels is shown in Table 2. Among all factors assessed, only the duration of chronic pain prior to PRP therapy was significantly associated with the likelihood of reporting ‘much improved’ pain at first follow-up. Specifically, longer pain duration was inversely associated with improvement (odds ratio=0.91 per 6-month increment in pain duration prior to PRP therapy, 95% confidence interval=0.85-0.98; P=0.008) [Table 3]. Patients with chronic pain lasting less than 2 years appeared to respond best to PRP therapy (Fig). The volume of PRP injected was not significantly associated with reporting ‘much improved’ pain.
 

Table 2. Subjective pain relief rating compared with baseline at first follow-up after platelet-rich plasma therapy (n=218)
 

Table 3. Logistic regression analysis of clinical factors associated with reporting chronic pain ‘much improved’ at first follow-up after platelet-rich plasma therapy (n=218)
 

Figure. Association between chronic pain duration prior to treatment and reporting ‘much improved’ pain at first follow-up
 
The median time to second follow-up was 9.0 weeks (mean=9.7, IQR=8.0-11.0; range, 2-32). Over the 12-month period after PRP therapy, a substantial number of patients were able to discontinue oral analgesics (Table 4).
 

Table 4. Differences in analgesic use before and after platelet-rich plasma therapy at 6- and 12-month follow-up (n=248)
 
Discussion
In this descriptive study, over 60% of patients reported moderate to significant improvement in pain symptoms after their first PRP treatment session. Among the 26 patients who received a second session, only one reported no improvement, suggesting a favourable response to repeated treatment. This improvement was accompanied by a substantial reduction in the use of oral analgesics. Given the known adverse effects associated with polypharmacy—particularly involving antidepressants, gabapentinoids, and opioids—this reduction may contribute to improved quality of life of patients.
 
Our cohort included patients with a wide range of chronic pain conditions affecting various anatomical sites. Intriguingly, there was no apparent correlation between the number of pain sites and the degree of pain relief, suggesting that PRP may have broad applicability across multiple pain syndromes. However, due to the heterogeneity of pain presentations and the presence of multiple pain regions in many patients, we were unable to determine whether PRP was more effective for specific types or anatomical regions of pain. This highlights the need for future randomised controlled trials involving more homogeneous patient populations to confirm the long-term impact of PRP on quality of life according to pain pathology.
 
Although PRP therapy is considered a form of regenerative therapy,3 its mechanisms of action are not yet fully understood.5 Platelets contain granules that release a variety of bioactive substances, including growth factors, antimicrobial proteins, metalloproteases, coagulation factors, and membrane glycoproteins that influence the synthesis of interleukins and chemokines. Other bioactive molecules, including neurotransmitters such as serotonin, dopamine, adenosine diphosphate, adenosine triphosphate, and histamine, may also play roles in tissue modulation and regeneration.4 Some research suggests that leukocyte-rich PRP has stronger anti-inflammatory effects and higher concentrations of growth factors, which may be important for conditions such as knee osteoarthritis.6 7 However, evidence as to whether leukocyte-rich PRP is superior to leukocyte-poor PRP remains inconclusive. One of the largest randomised controlled trials assessing PRP for knee osteoarthritis concluded that leukocyte-poor PRP was not significantly more effective than placebo in improving symptoms or joint structure among patients with mild to moderate knee osteoarthritis over 12 months.8 Conversely, a recent systematic review and meta-analysis found that leukocyte-poor PRP provided moderate pain relief compared with other active treatments; no significant difference was observed between leukocyte-rich PRP and other therapies.5 In the present study, all patients received leukocyte-rich PRP; therefore, we were unable to compare the efficacy of different PRP formulations.
 
The data showed that 13 patients with a history of cancer (either active with metastasis, in remission, or with unclear status) received PRP for pain clinically unrelated to their cancers (Table 1). Currently, there is no strong evidence regarding the safety of PRP use in patients with cancer. A recent formal consensus from the International Research Group on Platelet Injections recommended that PRP may be performed in patients with cancers in remission or with metastasis—after discussion with an oncologist—although the supporting evidence is contradictory or inconclusive and largely based on expert opinion, with very limited or absent literature.9
 
Limitations
This study has several limitations. First, without a control group, placebo effects cannot be excluded. Second, PRP dosing was not standardised; the volume administered varied according to the number and size of pain sites, and detailed documentation of per-site dosing was unavailable. Additionally, over 10% of patients did not return for follow-up, and reasons for loss to follow-up were not documented, introducing potential selection bias. The heterogeneity of pain conditions further complicated data interpretation. Although current evidence suggests that leukocyte-rich PRP may cause greater initial flare-up than leukocyte-poor PRP for intra-articular injections,10 any initial worsening of symptoms was not captured in our study because of variability in the timing of first follow-up. Finally, pain improvement was assessed using non-standardised, subjective descriptors (‘much improved’, ‘moderately improved’, or ‘mildly improved’). These terms reflect patient satisfaction but do not permit precise quantification of pain reduction. Future studies should incorporate validated quantitative assessment tools, such as the Brief Pain Inventory, to enhance the reliability of outcome measurement.
 
Conclusion
Leukocyte-rich PRP appeared effective in improving chronic musculoskeletal pain. The majority of patients reported meaningful symptom relief, and many were able to reduce or discontinue oral analgesics—an outcome that may substantially improve quality of life, particularly given the adverse effects associated with polypharmacy involving antidepressants, gabapentinoids, and opioids. Well-designed randomised controlled trials focusing on chronic musculoskeletal pain of less than 2 years’ duration—and incorporating standardised protocols for leukocyte-rich PRP preparation, injection volume, and patient selection criteria—are needed to confirm its long-term impact on quality of life of patients.
 
Author contributions
Concept or design: MHM Chu, WS Chan, KM Ho.
Acquisition of data: WS Chan, HL Wong.
Analysis or interpretation of data: MHM Chu, KM Ho.
Drafting of the manuscript: MHM Chu, KM Ho.
Critical revision of the manuscript for important intellectual content: WS Chan, ACY Li, HMK Wong.
 
All authors had full access to the data, contributed to the study, approved the final version for publication, and take responsibility for its accuracy and integrity.
 
Conflicts of interest
All authors have disclosed no conflicts of interest.
 
Acknowledgement
We are grateful to the staff in Peter Hung Pain Specialist Clinic and Operating Theatre of CUHK Medical Centre for their assistance in patient care and study logistics.
 
Funding/support
This research received no specific grant from any funding agency in the public, commercial, or not-for-profit sectors.
 
Ethics approval
This research was approved by the Clinical Research Ethics Committee of CUHK Medical Centre, Hong Kong (Ref No.: CREC-202409). A waiver of patient consent was approved by the Committee due to the retrospective and observational nature of the study. Only de-identified data were used for analysis.
 
References
1. Arnoczky SP, Delos D, Rodeo SA. What is platelet-rich plasma? Oper Tech Sports Med 2011;19:142-8. Crossref
2. Cao Y, Zhu X, Zhou R, He Y, Wu Z, Chen Y. A narrative review of the research progress and clinical application of platelet-rich plasma. Ann Palliat Med 2021;10:4823-9. Crossref
3. Arita A, Tobita M. Current status of platelet-rich plasma therapy under the act on the safety of regenerative medicine in Japan. Regen Ther 2023;23:37-43. Crossref
4. Cole BJ, Seroyer ST, Filardo G, Bajaj S, Fortier LA. Platelet-rich plasma: where are we now and where are we going? Sports Health 2010;2:203-10. Crossref
5. Wang F, Meng F, Chan TC, Wong SS. Platelet-rich plasma for treating chronic noncancer pain: a systematic review and meta-analysis of randomized controlled trials. Pain Ther 2025;14:1169-88. Crossref
6. Jayaram P, Mitchell PJ, Shybut TB, Moseley BJ, Lee B. Leukocyte-rich platelet-rich plasma is predominantly anti-inflammatory compared with leukocyte-poor platelet-rich plasma in patients with mild-moderate knee osteoarthritis: a prospective, descriptive laboratory study. Am J Sports Med 2023;51:2133-40. Crossref
7. Lin KY, Chen P, Chen AC, Chan YS, Lei KF, Chiu CH. Leukocyte-rich platelet-rich plasma has better stimulating effects on tenocyte proliferation compared with leukocyte-poor platelet-rich plasma. Orthop J Sports Med 2022;10:23259671221084706. Crossref
8. Bennell KL, Paterson KL, Metcalf BR, et al. Effect of intra-articular platelet-rich plasma vs placebo injection on pain and medial tibial cartilage volume in patients with knee osteoarthritis: the RESTORE randomized clinical trial. JAMA 2021;326:2021-30. Crossref
9. Eymard F, Louati K, Noël É, et al. Indications and contraindications to platelet-rich plasma injections in musculoskeletal diseases in case of infectious, oncological and haematological comorbidities: a 2025 formal consensus from the GRIIP (International Research Group on Platelet Injections). Knee Surg Sports Traumatol Arthrosc 2025;33:2293-306. Crossref
10. Lu J, Li H, Zhang Z, Xu R, Wang J, Jin H. Platelet-rich plasma in the pathologic processes of tendinopathy: a review of basic science studies. Front Bioeng Biotechnol 2023;11:1187974. Crossref

Has the bacteriology of periprosthetic joint infection after total knee arthroplasty changed over time? A retrospective cohort study of 2171 patients

Hong Kong Med J 2026 Apr;32(2):114–20 | Epub 17 Apr 2026
© Hong Kong Academy of Medicine. CC BY-NC-ND 4.0
 
ORIGINAL ARTICLE
Has the bacteriology of periprosthetic joint infection after total knee arthroplasty changed over time? A retrospective cohort study of 2171 patients
JR Khoo, MB, BS1; PK Chan, FHKCOS, FHKAM (Orthopaedic Surgery)2; Jeffrey HY Leung, BSc, MSc2; Vincent WK Chan, FHKAM (Orthopaedic Surgery), FRCSEd1; Amy Cheung, FHKCOS, FHKAM (Orthopaedic Surgery)1; Michelle Hilda Luk, FHKAM (Orthopaedic Surgery), FRCSEd1; MH Cheung, FHKCOS, FHKAM (Orthopaedic Surgery)2; Henry Fu, FHKCOS, FHKAM (Orthopaedic Surgery)2; KY Chiu, FHKCOS, FHKAM (Orthopaedic Surgery)2
1 Department of Orthopaedics and Traumatology, Queen Mary Hospital and The University of Hong Kong, Hong Kong SAR, China
2 Department of Orthopaedics and Traumatology, School of Clinical Medicine, Li Ka Shing Faculty of Medicine, The University of Hong Kong, Hong Kong SAR, China
 
Corresponding author: Dr PK Chan (cpk464@hku.hk)
 
 Full paper in PDF
 
Abstract
Introduction: Periprosthetic joint infection (PJI) is an uncommon but serious complication of total knee arthroplasty (TKA). A previous retrospective cohort study at our institution reported a PJI incidence of 1.34% between 1993 and 2013. The present study aimed to determine whether the incidence of PJI after TKA has changed at our hospital and to evaluate changes in microbiological patterns between 2014 and 2021.
 
Methods: In total, 2171 primary TKAs were performed at Queen Mary Hospital in Hong Kong between 1 January 2014 and 31 December 2021. All cases of PJI were identified using the Musculoskeletal Infection Society criteria. Patient demographics, PJI occurrence, and microbiological data were collected and compared with the previously published findings from the 1993-2013 PJI cohort.
 
Results: The incidence of PJI after TKA was 0.64% between 2014 and 2021, representing a significant decrease from the incidence of 1.34% observed at our institution between 1993 and 2013 (P=0.018). There was no significant difference in the incidence of early-onset infection (P=0.095). Methicillin-sensitive Staphylococcus aureus was the most common causative organism, accounting for 57.1% (n=8) of our cohort and 26.5% (n=9) in the previous cohort.
 
Conclusion: The incidence of PJI decreased significantly from 1.34% to 0.64% between the two study periods, suggesting the effectiveness of infection-reduction measures implemented at our institution. Minimal differences were observed in the microbiological patterns of PJI between the cohorts.
 
 
New knowledge added by this study
  • Between 2014 and 2021, the incidence of periprosthetic joint infection (PJI) after elective primary total knee arthroplasty (TKA) performed at our institution was 0.64%.
  • Methicillin-sensitive Staphylococcus aureus remains the most common causative organism in cases of PJI.
  • Antibiotic-resistant microorganisms are less prevalent than expected in cases of PJI.
Implications for clinical practice or policy
  • Multidisciplinary, protocol-driven optimisation of modifiable risk factors—both preoperatively and perioperatively—directly lowers PJI rates. Hospitals should adopt restrictive transfusion policies and aggressive medical co-morbidity management as standard of care for all patients undergoing TKA.
  • Initiating antibiotics only after obtaining appropriate microbiological samples (eg, joint aspiration) significantly improves organism identification. This allows targeted antimicrobial therapy rather than empirical coverage, which is particularly important given the changing bacteriological profile. Clinicians should avoid prescribing empirical antibiotics before sampling to prevent false-negative cultures and subsequent treatment failure.
 
 
Introduction
Periprosthetic joint infection (PJI) is an uncommon but severe complication of total knee arthroplasty (TKA). The existing literature indicates that approximately 1% to 2% of patients undergoing primary arthroplasty experience PJI; moreover, PJI is the leading cause of revision arthroplasty.1 2 Individuals with PJI may experience a substantial decrease in quality of life and must undergo complex and costly treatments to resolve this complication.3
 
A previous study at our institution, Queen Mary Hospital in Hong Kong, examined 2543 patients who underwent elective primary TKA between 1993 and 2013.4 During that period, the reported incidence of PJI was 1.34% and the most common causative organism was methicillin-sensitive Staphylococcus aureus (MSSA).4 The number of TKAs performed at our centre is rapidly increasing. In the past 8 years, clinicians at our institution have performed 85% of the total number of TKAs between 1993 and 2013, a span of 20 years. Considering the rapid population ageing in Hong Kong, we anticipate a continued increase in the number of TKAs. In recent years, various measures have been proposed to further reduce the incidence of PJI, including restrictions on blood transfusion rates, preoperative optimisation of modifiable risk factors, and the implementation of stringent culture techniques to improve microbial yield.5 6 7 However, the limited availability of local data makes it difficult to assess the effectiveness of these techniques in reducing PJI incidence. It is important to analyse the efficacy of these interventions as part of ongoing efforts to improve surgical outcomes at our centre. Furthermore, the increasing consumption of antibiotics over the past two decades has led to inevitable changes in the microbiological landscape of infectious organisms.8
 
This study had three objectives. First, it aimed to provide current local data on the incidence of PJI after elective primary TKA. Second, it sought to identify changes in the microbiological landscape of PJI; this information may guide future treatment and prevention strategies. Third, it aimed to showcase the efficacy of interventions to reduce PJI incidence and encourage their adoption beyond our institution.
 
Considering the measures introduced to reduce infection at our institution, we hypothesised that the incidence of PJI after primary TKA decreased over the past decade. We also hypothesised that the proportion of methicillin-resistant S aureus (MRSA)–related PJI increased during this period due to the increasing global consumption of antibiotics.
 
Methods
This retrospective cohort study compared the incidence and bacteriology of PJI after TKA at our institution. Participants were included if they underwent primary elective TKA at our institution between 2014 and 2021, and met the 2011 Musculoskeletal Infection Society (MSIS) criteria for PJI.9 Exclusion criteria were infection after revision arthroplasty, knee arthroplasty for malignant joint conditions, and active bacteraemia. The primary outcomes of interest were the incidence and bacteriological patterns of PJI. Secondary outcomes included preoperative patient demographics and time to onset of PJI.
 
Study population
The Hong Kong Hospital Authority’s Clinical Data Analysis and Reporting System and the Local Joint Replacement Registry were utilised to identify all TKAs performed at our institution between 2014 and 2021. Records were then searched using the keywords ‘orthopaedic aftercare’ and ‘periprosthetic joint infection’ to identify potential cases of PJI. Patients who did not meet the 2011 MSIS criteria for PJI were excluded; the remaining patients comprised the study cohort.10 Two senior authors of this study (PK Chan and KY Chiu) independently screened the patient database using the 2011 MSIS criteria to identify suitable patients for further data collection. Any uncertainties or disagreements were resolved through discussion.
 
Using a predefined data extraction form, the same two senior authors extracted the following data from the records of all included patients: intraoperative joint fluid culture results, age, sex, medical co-morbidities (eg, diabetes mellitus, rheumatoid arthritis, and immunosuppression), date of the index operation, surgical technique, operative time, date of re-operation, and postoperative antibiotic regimen.
 
A previous retrospective cohort study by Siu et al4 assessed the incidence and bacteriology of PJI among patients who underwent TKA at our institution between 1993 and 2013. From that study, we extracted data on the incidence and bacteriology of PJI, patient demographics, and time to onset of infection for comparison with our cohort. For both cohorts, we recorded the mean operative time, number of joint specialists involved, surgical technique, use of patient-specific instrumentation, and infection control protocols; these data were used to identify potential confounders that could influence the incidence of PJI.
 
Patients in our cohort were classified according to the time to infection onset as early, delayed, or late. Early-onset PJI was defined as infection occurring within 3 months of the index operation. These infections commonly arise from intraoperative contamination by highly virulent microorganisms and therefore constitute a key focus of intervention. Delayed-onset PJI was defined as infection occurring between 3 and 24 months after the index operation. These infections are also typically acquired during surgery but involve less virulent microorganisms. Late-onset PJI was defined as infection occurring over 24 months after surgery. These infections are often caused by haematogenous pathogens unrelated to the index operation.11
 
In accordance with our institution’s guidelines, patients were invited to attend follow-up at 2 weeks, 3 months, 6 months, and 12 months postoperatively. Patients without complications were subsequently scheduled for annual follow-up. Regarding infection control, the preoperative, perioperative, and postoperative protocols for elective primary TKA remained consistent throughout the study period in both cohorts. Intravenous antibiotic prophylaxis (1 g of cefazolin, or vancomycin for patients with a penicillin allergy) was administered 1 hour prior to skin incision. Intraoperatively, laminar airflow and body exhaust systems were utilised. Antibiotic-loaded cement was not routinely used, and a single postoperative wound management and rehabilitation programme was implemented throughout the study period. Postoperative antibiotics were not routinely administered.
 
Statistical analyses
Categorical variables were grouped for analysis; prevalence was calculated and group differences were tested with the Chi squared test. Continuous variables were compared using independent two-tailed t tests. A P value <0.05 was considered statistically significant. All statistical analyses were conducted using SPSS (Windows version 27.0; IBM Corp, Armonk [NY], United States).
 
Results
In total, 2543 and 2171 primary TKAs were performed at our institution between 1993-20134 and 2014-2021, respectively. The incidence of PJI was 0.64% (n=14; 95% confidence interval=0.39-0.89) between 2014 and 2021, significantly lower than the 1.34% (n=34; 95% confidence interval=0.97-1.71) recorded between 1993 and 2013 (P=0.018).4
 
The mean age of the 14 patients with PJI in our cohort was 68.5 ± 7 years (range, 56-85). Of these patients, eight were men (57.1%) and six were women (42.9%). In terms of medical co-morbidities, seven patients had diabetes mellitus (50.0%), one had rheumatoid arthritis (7.1%), and one had end-stage renal disease requiring immunosuppression (7.1%). The mean follow-up period in our cohort was 4 years 9 months (interquartile range [IQR], 4 years 0 months to 6 years 11 months). There were no significant differences in age, sex distribution, or medical co-morbidities (diabetes mellitus and rheumatoid arthritis) between the two cohorts. The cohort demographics are compared in Table 1.4
 

Table 1. Patient demographics in the two cohorts
 
Confounding factors
We analysed other potential confounding factors (eg, mean operative time, number of joint specialists involved, and surgical approach) to minimise their effects on the primary and secondary outcomes.12 The indications for TKA did not change at our institution during the two time periods. Our institutional guidelines state that patients with Kellgren and Lawrence Grade 3 or 4 end-stage knee osteoarthritis and debilitating symptoms refractory to nonoperative treatment are candidates for TKA. The mean operative times for primary elective TKA were 1 hour 56 minutes during 1993-20134 and 1 hour 33 minutes during 2014-2021. The difference was not statistically significant (P=0.170). The number of joint specialists involved increased from four to six between the two periods. From 1993 to 2019, all TKAs were exclusively performed using the conventional approach.
 
After the computed tomography–based robotic arm–assisted system for total joint arthroplasty was introduced in 2019,13 surgeons at our institution could choose between robotic-assisted TKA and conventional TKA. Currently, there are no specific indications for either approach; the choice remains a matter of surgeon preference.14 To our knowledge, no studies have compared PJI incidence between robotic-assisted and conventional TKA; future research should explore the infection rate associated with each procedure. Patients undergoing robotic-assisted TKA at our institution follow the same postoperative protocol established for those undergoing conventional TKA (follow-up at 2 weeks, 3 months, 6 months, 12 months, and annually thereafter). Because robotic-assisted TKA was recently introduced at our institution, the mean follow-up duration for patients treated with this approach was short (14 months; IQR, 4.5-26).
 
Time to infection
Early-onset PJI occurred in 7.1% (n=1) of patients in the study cohort, arising 60 days after arthroplasty. In the 1993-2013 cohort, 29.4% (n=10) of patients experienced early-onset infection at a median of 17 days after arthroplasty (IQR, 9-32).4 However, the incidence of early-onset PJI did not differ significantly between the two cohorts (P=0.095) [Table 1]. Delayed-onset PJI occurred in 28.6% (n=4) of patients in the study cohort, occurring at a median of 6 months after arthroplasty (IQR, 5-7). Late-onset PJI occurred at a median of 3 years after arthroplasty (IQR, 2 years 1 month to 3 years 7 months). A larger proportion of patients experienced infection during the first year after surgery in the 1993-2013 cohort4 compared with the 2014-2021 cohort (59% vs 36%).
 
Bacteriology
Methicillin-sensitive S aureus remained the most common causative organism in cases of PJI between 2014 and 2021, affecting 57.1% (n=8) of patients. The proportion of PJI cases caused by MSSA was significantly greater in the 2014-2021 cohort than in the 1993-2013 cohort, in which 26.5% (n=9) of patients were infected with MSSA (P=0.043) [Table 2].4
 

Table 2. Microbiological patterns in the two cohorts
 
Methicillin-resistant S aureus was the second most common causative organism in cases of PJI between 1993 and 2013 (17.6%, n=6)4; Streptococcus spp. (14.3%, n=2) was the second most common causative organism between 2014 and 2021. The two cases of streptococcal infection in the 2014-2021 cohort comprised one with Streptococcus dysgalactiae and one with Streptococcus agalactiae. Other causative organisms in PJI cases within the 2014-2021 cohort included MRSA (7.1%, n=1), methicillin-sensitive coagulase-negative staphylococci (7.1%, n=1), and Escherichia coli (7.1%, n=1). Methicillin-resistant strains accounted for 40% of all staphylococcal infections between 1993 and 20134; this proportion was 11.1% between 2014 and 2021. Table 2 compares the microbiological patterns of PJI between the two cohorts.
 
There was a non-significant decrease in the proportion of patients with culture-negative PJI between the two cohorts, from 23.5% (n=8) between 1993 and 20134 to 7.1% (n=1) between 2014 and 2021 (P=0.186) [Table 2].
 
Discussion
This study showed that the incidence of PJI after primary TKA at our institution significantly decreased. Worldwide, the reported incidence of PJI after primary elective TKA ranges from 1% to 2%.1 2 Over the years, our institution has implemented various measures to reduce the incidence of PJI after TKA, including a preoperative patient optimisation programme and a restrictive blood management programme. These measures are summarised in Table 3.5 6
 

Table 3. Interventional measures to reduce the incidence of periprosthetic joint infection at our institution
 
Medical risk factors
The association between blood transfusion and increased perioperative morbidity in patients undergoing TKA is well documented.15 16 The American College of Surgeons National Surgical Quality Improvement Program reported that patients receiving transfusions experienced up to a tenfold increase in the risk of adverse postoperative outcomes.17 Based on these findings, a more restrictive transfusion approach has been implemented in the past several years after the 2015 study17 to improve postoperative outcomes. A retrospective study of 12 590 patients demonstrated significant decreases in complications, 30-day readmissions, and hospital length of stay following implementation of a patient blood management programme for patients undergoing prosthetic joint arthroplasty.18 The programme aimed to reduce transfusion requirements by optimising red cell mass, minimising blood loss, and defining appropriate indications for transfusion.18 A patient blood management programme was introduced at our institution in 2014; subsequently, the mean transfusion rate among patients undergoing TKA decreased from 31.3% in 2013 to 1.9% in 2018.6
 
Preoperative optimisation
The preoperative optimisation programme at our institution emphasises the optimisation of modifiable risk factors for PJI prior to TKA.5 Rheumatological diseases such as rheumatoid arthritis, juvenile inflammatory arthritis, ankylosing spondylitis, and psoriatic arthritis are known to increase the risk of PJI.19 20 A previous review of 2543 TKAs showed that the incidence of PJI was 3.1% in patients with rheumatoid arthritis, significantly higher than the 1.2% observed in patients without rheumatoid arthritis.4 At our institution, patients with rheumatoid arthritis who exhibit a persistently elevated erythrocyte sedimentation rate or C-reactive protein level are referred to a rheumatologist for further assessment and treatment prior to surgery. Diabetes mellitus is also strongly associated with an increased risk of PJI. All patients scheduled for elective TKA at our institution undergo universal glycated haemoglobin and fructosamine screening, with referral to an endocrinologist for optimisation if the glycated haemoglobin level exceeds 7.5%.21 Other modifiable risk factors monitored at our institution include weight control, vitamin D status, and nutritional status.22
 
Antimicrobial resistance
From 2014 to 2021, MSSA was the most common causative organism in cases of PJI at our institution (57.1%, n=8). This finding is consistent with the existing literature, which indicates that S aureus is the most common causative organism in PJI after primary joint arthroplasty (19%-29% of cases worldwide).23 24 25 The unique virulence factors of S aureus enhance its ability to adhere to implants, facilitating aggressive biofilm formation and enabling replication and survival within this microenvironment.26 27
 
Owing to the increasing use of antibiotics in the community, we hypothesised that the number of antibiotic-resistant causative organisms would increase in our cohort of patients with PJI. The SENTRY Antimicrobial Surveillance Program evaluated 20-year trends in antimicrobial susceptibility among S aureus isolates across 427 centres in 45 countries.28 The authors reported that the prevalence of MRSA peaked at 44.2% in 2005-2008, then declined to 42.3% in 2009-2012 and 39.0% in 2013-2016.28 The incidence of MRSA among PJI cases in our study was consistent with findings from other regions. For example, a multicentre study in New Zealand showed that 9.1% of PJIs were attributable to MRSA.29
 
It is well established that early-onset infection typically occurs during surgery through intraoperative contamination, whereas late-onset PJI commonly arises from haematogenous spread.10 We observed a decrease in the proportion of early-onset infection between the two cohorts; however, this difference was not statistically significant (P=0.095). Additional measures should be implemented to further reduce the incidence of PJI after primary TKA at our institution.
 
Culture-negative periprosthetic joint infection
In recent years, the incidence of culture-negative PJI has increased among patients undergoing total joint arthroplasty.30 This increase has been hypothesised to result from a higher prevalence of low-virulence organisms, premature antibiotic treatment, and failure to use enriched culture media.31 32 An inability to identify causative organisms in cases of PJI represents a serious problem for surgeons and infection control teams because of the uncertainties associated with antimicrobial selection. To reduce the incidence of culture-negative PJI, our institution implemented recommendations published by Tan et al,7 including extending the incubation period, using blood culture bottles and flasks, and collecting an adequate number of separate intraoperative tissue samples from patients with suspected PJI. The incidence of culture-negative PJI at our institution declined; however, this decline was not statistically significant (P=0.186).
 
Limitations
This study had several limitations. First, it included patients treated at a single academic centre in Hong Kong; therefore, the findings may not accurately reflect changing trends in PJI incidence and bacteriology across the region. Further multicentre studies are warranted to better understand these trends. Second, the duration of patient recruitment differed between the present and former studies (7 years vs 20 years). Third, the number of patients varied between the two cohorts (2543 vs 2171). Despite this difference, we proceeded with the 7-year recruitment period considering the clinical value of evaluating recent PJI incidence and bacteriology in Hong Kong. Considerable effort was made to standardise patient characteristics and baseline co-morbidities to ensure comparability between cohorts. Fourth, given the relatively short mean follow-up duration (4 years 9 months), some cases of late-onset PJI may have occurred after completion of follow-up. Fifth, inconsistencies in record-keeping over the past decade prevented analysis of all documented risk factors for PJI; this limitation was unavoidable because of the retrospective study design. Sixth, the limited number of PJI cases hindered further subgroup analyses (ie, assessment and comparison of PJI incidence between conventional and robotic-assisted approaches). A similar study with a larger cohort may therefore be beneficial. Despite these limitations, the present study represents the largest series of PJI cases in Hong Kong to compare bacteriological patterns across two time periods. We believe that the findings have important clinical implications for PJI management in local hospitals.
 
Conclusion
This is the first study in Hong Kong to assess changes in the incidence and microbiological patterns of PJI after TKA across two time periods. Our findings have substantial clinical implications, as they demonstrate the effectiveness of interventional measures implemented at our institution in reducing the incidence of PJI, the rate of culture-negative PJI, and the number of early-onset cases. Prevention of PJI improves patient outcomes and reduces the economic burden on the healthcare system. Larger, multicentre, prospective studies are required to further elucidate bacteriological trends in PJI in Hong Kong.
 
Author contributions
Concept and design: All authors.
Acquisition of data: JR Khoo.
Analysis or interpretation of data: JR Khoo, PK Chan.
Drafting of the manuscript: JR Khoo.
Critical revision the manuscript for important intellectual content: All authors.
 
All authors had full access to the data, contributed to the study, approved the final version for publication, and take responsibility for its accuracy and integrity.
 
Conflicts of interest
All authors have disclosed no conflicts of interest.
 
Declaration
This manuscript was presented as an oral presentation at the 42nd Annual Congress of the Hong Kong Orthopaedic Association (5-6 November 2022, Hong Kong).
 
Funding/support
This research received no specific grant from any funding agency in the public, commercial, or not-for-profit sectors.
 
Ethics approval
This research was approved by the Institutional Review Board of The University of Hong Kong/Hospital Authority Hong Kong West Cluster, Hong Kong (Ref No.: UW 25-585). The requirement for informed patient consent was waived by the Committee due to the retrospective nature of the research.
 
References
1. Pulido L, Ghanem E, Joshi A, Purtill JJ, Parvizi J. Periprosthetic joint infection: the incidence, timing, and predisposing factors. Clin Orthop Relat Res 2008;466:1710-5. Crossref
2. Zimmerli W, Trampuz A, Ochsner PE. Prosthetic-joint infections. N Engl J Med 2004;351:1645-54. Crossref
3. Premkumar A, Kolin DA, Farley KX, et al. Projected economic burden of periprosthetic joint infection of the hip and knee in the United States. J Arthroplasty 2021;36:148-49.e3. Crossref
4. Siu KT, Ng FY, Chan PK, Fu H, Yan CH, Chiu KY. Bacteriology and risk factors associated with periprosthetic joint infection after primary total knee arthroplasty: retrospective study of 2543 cases. Hong Kong Med J 2018;24:152-7. Crossref
5. Chan VW, Chan PK, Fu H, et al. Preoperative optimization to prevent periprosthetic joint infection in at-risk patients. J Orthop Surg (Hong Kong) 2020;28:2309499020947207. Crossref
6. Chan PK, Hwang YY, Cheung A, et al. Blood transfusions in total knee arthroplasty: a retrospective analysis of a multimodal patient blood management programme. Hong Kong Med J 2020;26:201-7. Crossref
7. Tan TL, Kheir MM, Shohat N, et al. Culture-negative periprosthetic joint infection: an update on what to expect. JB JS Open Access 2018;3:e0060. Crossref
8. Roberts SC, Zembower TR. Global increases in antibiotic consumption: a concerning trend for WHO targets. Lancet Infect Dis 2021;21:10-1. Crossref
9. Workgroup Convened by the Musculoskeletal Infection Society. New definition for periprosthetic joint infection. J Arthroplasty 2011;26:1136-8. Crossref
10. Parvizi J, Zmistowski B, Berbari EF, et al. New definition for periprosthetic joint infection: from the Workgroup of the Musculoskeletal Infection Society. Clin Orthop Relat Res 2011;469:2992-4. Crossref
11. Tande AJ, Patel R. Prosthetic joint infection. Clin Microbiol Rev 2014;27:302-45. Crossref
12. Wang Q, Goswami K, Shohat N, Aalirezaie A, Manrique J, Parvizi J. Longer operative time results in a higher rate of subsequent periprosthetic joint infection in patients undergoing primary joint arthroplasty. J Arthroplasty 2019;34:947-53. Crossref
13. The University of Hong Kong. HKUMed introduces the latest robotic arm assisted joint replacement technology for enhancing surgical precision [press release]. 2020 May 28. Available from: https://www.hku.hk/press/press-releases/detail/21111.html%2Dspecific%20planning. Accessed 1 Apr 2026.
14. Deckey DG, Rosenow CS, Verhey JT, et al. Robotic-assisted total knee arthroplasty improves accuracy and precision compared to conventional techniques. Bone Joint J 2021;103-B(6 Suppl A):74-80. Crossref
15. Everhart JS, Sojka JH, Mayerson JL, Glassman AH, Scharschmidt TJ. Perioperative allogeneic red blood-cell transfusion associated with surgical site infection after total hip and knee arthroplasty. J Bone Joint Surg Am 2018;100:288-94. Crossref
16. Lu Q, Peng H, Zhou GJ, Yin D. Perioperative blood management strategies for total knee arthroplasty. Orthop Surg 2018;10:8-16. Crossref
17. Ferraris VA, Hochstetler M, Martin JT, Mahan A, Saha SP. Blood transfusion and adverse surgical outcomes: the good and the bad. Surgery 2015;158:608-17. Crossref
18. Loftus TJ, Spratling L, Stone BA, Xiao L, Jacofsky DJ. A patient blood management program in prosthetic joint arthroplasty decreases blood use and improves outcomes. J Arthroplasty 2016;31:11-4. Crossref
19. Kunutsor SK, Whitehouse MR, Blom AW, Beswick AD; INFORM Team. Patient-related risk factors for periprosthetic joint infection after total joint arthroplasty: a systematic review and meta-analysis. PLoS One 2016;11:e0150866. Crossref
20. Morrison TA, Figgie M, Miller AO, Goodman SM. Periprosthetic joint infection in patients with inflammatory joint disease: a review of risk factors and current approaches to diagnosis and management. HSS J 2013;9:183-94. Crossref
21. Duensing I, Anderson MB, Meeks HD, Curtin K, Gililland JM. Patients with type-1 diabetes are at greater risk of periprosthetic joint infection: a population-based, retrospective, cohort study. J Bone Joint Surg Am 2019;101:1860-7. Crossref
22. Kong L, Cao J, Zhang Y, Ding W, Shen Y. Risk factors for periprosthetic joint infection following primary total hip or knee arthroplasty: a meta-analysis. Int Wound J 2017;14:529-36. Crossref
23. Triffault-Fillit C, Ferry T, Laurent F, et al. Microbiologic epidemiology depending on time to occurrence of prosthetic joint infection: a prospective cohort study. Clin Microbiol Infect 2019;25:353-8. Crossref
24. Zeller V, Kerroumi Y, Meyssonnier V, et al. Analysis of postoperative and hematogenous prosthetic joint-infection microbiological patterns in a large cohort. J Infect 2018;76:328-34. Crossref
25. Benito N, Franco M, Ribera A, et al. Time trends in the aetiology of prosthetic joint infections: a multicentre cohort study. Clin Microbiol Infect 2016;22:732.e1-8. Crossref
26. Kherabi Y, Zeller V, Kerroumi Y, et al. Streptococcal and Staphylococcus aureus prosthetic joint infections: are they really different? BMC Infect Dis 2022;22:555. Crossref
27. Sendi P, Rohrbach M, Graber P, Frei R, Ochsner PE, Zimmerli W. Staphylococcus aureus small colony variants in prosthetic joint infection. Clin Infect Dis 2006;43:961-7. Crossref
28. Diekema DJ, Pfaller MA, Shortridge D, Zervos M, Jones RN. Twenty-year trends in antimicrobial susceptibilities among Staphylococcus aureus from the SENTRY Antimicrobial Surveillance Program. Open Forum Infect Dis 2019;6(Suppl 1):S47-53. Crossref
29. Ravi S, Zhu M, Luey C, Young SW. Antibiotic resistance in early periprosthetic joint infection. ANZ J Surg 2016;86:1014-8. Crossref
30. Bejon P, Berendt A, Atkins BL, et al. Two-stage revision for prosthetic joint infection: predictors of outcome and the role of reimplantation microbiology. J Antimicrob Chemother 2010;65:569-75. Crossref
31. Berbari EF, Marculescu C, Sia I, et al. Culture-negative prosthetic joint infection. Clin Infect Dis 2007;45:1113-9. Crossref
32. Malekzadeh D, Osmon DR, Lahr BD, Hanssen AD, Berbari EF. Prior use of antimicrobial therapy is a risk factor for culture-negative prosthetic joint infection. Clin Orthop Relat Res 2010;468:2039-45. Crossref

Prevalence of mild and major neurocognitive disorders in community and residential care homes in Hong Kong: considerations for multidimensional risk factor evaluation and intervention in primary care

Hong Kong Med J 2026 Apr;32(2):98–113 | Epub 17 Apr 2026
© Hong Kong Academy of Medicine. CC BY-NC-ND 4.0
 
ORIGINAL ARTICLE  CME
Prevalence of mild and major neurocognitive disorders in community and residential care homes in Hong Kong: considerations for multidimensional risk factor evaluation and intervention in primary care
Linda CW Lam, MD, FHKAM (Psychiatry)1; WC Chan, MB, ChB, FHKAM (Psychiatry)2; Allen TC Lee, MD, FHKAM (Psychiatry)1; Zhaohua Huo, MSc, PhD1; Vicky C Lin, MSSc, MPhil1; Ada WT Fung, MSc, PhD3; SL Ma, MPhil, PhD1; Calvin PW Cheng, MB, BS, FHKAM (Psychiatry)2; ST Cheng, PhD4; Frank HY Lai, MSc, PhD5; Benjamin HK Yip, BSc, PhD6; Samuel YS Wong, MD, FHKAM (Community Medicine)6
1 Department of Psychiatry, The Chinese University of Hong Kong, Hong Kong SAR, China
2 Department of Psychiatry, The University of Hong Kong, Hong Kong SAR, China
3 Department of Applied Social Sciences, Hong Kong Baptist University, Hong Kong SAR, China
4 Department of Health and Physical Education, The Education University of Hong Kong, Hong Kong SAR, China
5 Department of Social Work, Education and Community Wellbeing, Faculty of Health and Life Sciences, Northumbria University, Newcastle, United Kingdom
6 The Jockey Club School of Public Health and Primary Care, The Chinese University of Hong Kong, Hong Kong SAR, China
 
Corresponding author: Prof Linda CW Lam (cwlam@cuhk.edu.hk)
 
 Full paper in PDF
 
Abstract
Introduction: Given the rapid population ageing, the cognitive healthcare needs of older adults warrant attention. This study reports on the findings of the Hong Kong Mental Morbidity Survey for Older People (HKMMSOP), which evaluated the prevalence of neurocognitive disorders (NCD) and associated health factors that may inform primary care risk assessment and intervention.
 
Methods: The HKMMSOP recruited 4871 participants aged 60 years or above through random sampling in Hong Kong during 2019 and 2023, including 4368 community-dwelling and 503 residential care home residents. Participants were assessed for cognitive function and mental status and completed health and lifestyle questionnaires. The prevalence of NCD and associated factors were evaluated with reference to the 2022 Hong Kong population.
 
Results: The age- and gender-adjusted prevalences of mild and major NCD were 21.8% and 9.7%, respectively, among adults aged 60 years or above in Hong Kong. Approximately 70% of residents in long-term care (LTC) institutions had major NCD. Chronic diseases, sarcopenia risk, sensory impairments, and specific lifestyle habits were associated with cognitive function in logistic regression analyses adjusted for demographic confounders (P<0.05). Specialised medical services, including psychiatric care, were used by approximately 40% of community participants with major NCD.
 
Conclusion: A range of NCD is prevalent in both community and LTC settings, with the highest rates observed among the oldest-old. To improve functional independence, community primary healthcare should prioritise early cardiovascular disease management, physical health maintenance, correction of sensory impairments, and promotion of intellectual and social engagement. For effective healthcare planning for frail older adults living in LTC institutions, the complex needs of nursing home residents with NCD should be addressed.
 
 
New knowledge added by this study
  • The study revealed that 9.7% of older adults had major neurocognitive disorders (NCD), and nearly one in five older adults had mild NCD in Hong Kong. The high prevalence of mild NCD warrants attention, particularly from the perspective of early management to reduce progression from functionally independent mild NCD to dependent states of major NCD.
  • The lifestyle evaluation from the study highlighted that regular participation in physical and intellectual activities, being socially active, and maintaining good sleep quality were associated with better cognitive function.
  • Specialised medical services utilisation among community-dwelling participants with major NCD was relatively low (<40%). Promoting awareness of early assessment may help reduce the risk of secondary complications and improve long-term health outcomes associated with NCD.
Implications for clinical practice or policy
  • Primary care platforms focused on early detection and management of chronic diseases should adopt a multidimensional approach—particularly addressing cardiovascular health, stroke prevention, sensorimotor function, physical activity, sleep hygiene, and leisure engagement—to achieve long-term cognitive benefits.
  • Over 70% of residents in long-term care had major NCD. To improve quality of life and the caregiving environment, service provision and planning should be integrated to address the combined physical, cognitive, and mental health needs of these residents.
 
 
Introduction
Ageing, characterised by a progressive loss of physiological integrity leading to impaired function and increased vulnerability to death, is a major health concern for global populations.1 The older population (threshold defined by the World Health Organization as aged ≥60 years) in Hong Kong, one of the most rapidly ageing communities worldwide, is expected to increase from 2.28 million (30.5% of the total population) in 2023 to 3.31 million (40.4%) in 2046, with the steepest growth occurring in advanced old age.2 Major neurocognitive disorders (NCD) [also referred to as dementia] are the most common neurodegenerative disorders associated with ageing and exert a substantial impact on healthcare systems. A global projection estimated that the number of people living with dementia would increase almost threefold, from 57.4 million cases in 2019 to 152.8 million in 2050.3 In the most recent epidemiological study of dementia in Hong Kong conducted in 2008, over 8.9% of community-dwelling older adults had mild dementia, and 8.5% had mild cognitive impairment (MCI), a synonym for mild NCD.4 Given that these estimates are over a decade old, demographic changes (eg, higher educational attainment and evolving health conditions among older adults) warrant re-evaluation of prevalences and associated factors.5
 
Factors affecting cognitive decline are best understood through a life-course perspective. While genetic and early-life predisposing factors are not readily modifiable, mid- and late-life health and lifestyle factors are increasingly recognised as modulators of cognitive impairment. A 2024 Lancet review6 suggested that 14 potentially modifiable lifestyle and health factors, including cardiovascular risk, hearing and vision loss, air pollution, and mental health and lifestyle factors (eg, smoking, alcohol consumption, physical inactivity, social isolation, and depression), accounted for 45% of the population-attributable risk of dementia. Growing research interest has also focused on other potential risk factors, such as sleep, diet, dental disease, and frailty, which are also important determinants of cognitive health.6
 
Investigating secular trends in dementia is essential to understand the full spectrum of the condition in general populations and to identify risk factors across populations and life stages.7 Recent estimates from various populations have reported lower-than-expected prevalence rates, possibly due to improvements in education, environmental enrichment, and healthcare, with resulting reductions in cerebrovascular risk.6 8 In the local context, an updated prevalence study facilitates systematic evaluation of the evolving occurrence and modulating factors of cognitive decline from physical health to psychosocial perspectives.6 Such evaluation is essential for developing context-, culture-, and practice-tailored preventive strategies targeting the identified risk factors, as well as for optimising treatment and management.6 7 Particularly with advancing age and rising rates of physical and mental co-morbidities among older adults in Hong Kong, the burden of care and service demands related to cognitive impairment require more comprehensive assessment and practical guidance.
 
This study aimed to estimate the current prevalence of mild and major NCD in Hong Kong and to identify their multidimensional associated factors, based on the Hong Kong Mental Morbidity Survey for Older People (HKMMSOP). We also discuss how these findings may inform healthcare interventions for early risk modification, reduction of cognitive decline, and optimisation of care.
 
Methods
Study design and setting
The HKMMSOP was a commissioned study funded by the Advisory Committee on Mental Health through the Health and Medical Research Fund. Conducted from January 2019 to January 2023, it was designed as a territory-wide, population-based, cross-sectional survey to examine the prevalence and modulating factors of NCD among older adults in Hong Kong. The study settings of HKMMSOP included both community households and long-term care (LTC) institutions. For clinical assessments, HKMMSOP adopted a two-phase design. Phase 1 interviews comprised cognitive assessments for mild and major NCD, evaluation of neuropsychiatric syndromes and functioning, as well as physical health and psychosocial measurements. Phase 2 involved clinician interviews for diagnostic assessment and subtyping of NCD.
 
Study size calculation
Sample size was determined based on previous prevalence studies of dementia (2008)4 and common mental disorders (2010-2013)9 in Hong Kong. For an estimated NCD prevalence of approximately 2% among adults aged 60 to 74 years, 3012 participants were required to achieve a recommended precision of 0.005. For an estimated prevalence of approximately 5% among those aged 75 years or above, 1168 participants were required to achieve a recommended precision of 0.0125. The HKMMSOP ultimately recruited and completed assessments for 3560 participants aged 60 to 74 years and 1311 participants aged 75 years or above.
 
Sampling and subject recruitment
To recruit a representative sample of the older adult population in Hong Kong, we adopted a multi-stage random sampling method commonly used in household surveys. A random list of addresses (sampling frame) was generated by the Census and Statistics Department of the Hong Kong SAR Government, then stratified by geographical location and residential type (private versus public housing). For each address, an invitation letter introducing the survey and a consent form for assessment were enclosed. A telephone hotline, designated website, and email contact were provided for enquiries and to document refusals. Up to three invitation letters were sent within 6 months to improve recruitment success and reduce response bias; participants who responded to the third contact had higher rates of active employment compared with the rest of the sample (P<0.05).
 
When households responded and included residents aged 60 years or above, we invited them for interviews; there could be one or more eligible residents per household. If individuals agreed to participate but were unable to provide complete information (eg, due to profound sensory deficits), data were obtained from their first-degree relatives and categorised as proxy. Households with no eligible participants (ie, all residents aged under 60 years) were invited to notify the research team of their ineligibility through convenient contact channels (email, text messages, or direct phone calls). From January 2019 to January 2023, a total of 39 772 invitation letters were sent to randomly generated addresses. Of these, 3352 households with 4369 eligible community-dwelling participants consented to and completed the survey. Eligibility and demographic characteristics were unknown for the remaining 36 420 households. The flow of participant sampling, recruitment, and assessment is depicted in the Figure.
 

Fig. Recruitment process in community households
 
To obtain representative statistics for people residing in LTC institutions, we adopted a two-stage cluster sampling method. Superintendents of 600 residential care homes for the elderly (ie, LTC institutions), randomly selected from the master list of registered old age homes in Hong Kong, were first approached for participation. When residential care homes agreed to assist with recruitment, eligible residents were randomly selected. Following institutional consent and consent from participants and/or their family members, assessments were completed for 503 residents from 51 registered old age homes across Hong Kong. The prison population was not included in this survey.
 
Data collection and measurements
Phase 1 study
Phase 1 assessments were conducted by trained research assistants during visits to participants’ residential addresses or at the department’s research centre. Due to social distancing and infection control policies during the COVID-19 pandemic, phone assessments were offered as an alternative and were utilised by 28.7% of community participants. Proxy-based assessments were conducted for participants with profound physical or mental deficits (2.7% of community participants and 34.2% of LTC participants).
 
Socio-demographic information was collected, including age, gender, birthplace, housing type, education level, marital status, household composition, current employment status, family income, receipt of government financial subsidies, and religious affiliation.
 
Cognitive function was assessed using two locally validated tools: the Chinese Abbreviated MCI test10 and the Hong Kong version of Montreal Cognitive Assessment (HK-MoCA).11 12 For participants with moderate to severe major NCD in both domiciliary and institutional settings, an abridged version of the cognitive and mental state assessment was used based on the HK-MoCA 5-minute protocol. All interviewers were trained to administer the Clinical Dementia Rating (CDR) to each participant, and satisfactory concordance was achieved between interviewer-rated and clinician-rated results (Spearman’s correlation: 0.668; P<0.001).13 Neuropsychiatric symptoms were screened in all participants using the Neuropsychiatric Inventory Questionnaire.14
 
Physical health was assessed using questionnaires on chronic disease burden (Cumulative Illness Rating Scale [CIRS]),15 along with health screening measures including blood pressure, body mass index, oral health, grip strength, hearing and vision, postural balance, and sarcopenia (SARC-F: Strength, Assistance with walking, Rising from a chair, Climbing stairs, and Falls).16 Activities of daily living were evaluated using the Chinese version of the Disability Assessment for Dementia.17
 
Lifestyle factors were assessed using questionnaires covering smoking and alcohol consumption, physical and non-physical leisure activities, sleep quality (Pittsburgh Sleep Quality Index), use of drugs and vitamins, dietary intake of fruits and vegetables, loneliness, and quality of life.18 19 20 21
 
Phase 2 study
Among the 1020 participants whose scores crossed the threshold for mild or major NCD, clinician interviews were conducted for NCD subtyping, including assessment of cerebrovascular risk and neuroimaging. Of these, 457 participants (response rate: 44.8%) completed face-to-face structured assessments at the department’s research centre, where blood sampling facilities were available (Fig). For consenting participants, fasting lipid profiles, glycated haemoglobin, and apolipoprotein E4 genotypes were analysed. Diagnoses and subtypes of NCD were established according to the DSM-5 (Diagnostic and Statistical Manual of Mental Disorders, Fifth Edition)22 through clinician assessment supplemented by laboratory results and structural magnetic resonance imaging of the brain.
 
Additionally, 201 participants with negative NCD screening results (CDR=0) were interviewed by research team psychiatrists to evaluate the sensitivity and specificity of Phase 1 assessments. The sensitivity of the Phase 1 screening tools for detecting mild or major NCD was 96.7%, while the specificity for correctly identifying participants without NCD was 81%. The positive predictive value was 90% and the negative predictive value was 93%.
 
Supplementary study for long-term care institutions
Due to strict COVID-19 visitor policies in place during the fieldwork period (2022-2023), videoconference assessments were conducted with participants in some LTC facilities (62.6%). Individual health assessments were not performed because of infection control policies in effect during data collection in 2022.
 
Statistical analysis
Sample representativeness
In the two-phase prevalence study design, selection bias could potentially arise if heterogeneity in characteristics (eg, age, education level, family structure, physical and mental morbidity) existed between responders and non-responders. During the study invitation and Phase 1 assessment, demographic and clinical information for non-responders and non-completers was unavailable. Therefore, we compared Phase 2 completers (n=457) and non-completers (n=563) among participants with positive NCD screening results in Phase 1. Non-completers were more likely to be older (>75 years: 49.9% vs 36.1%; P<0.001), have a higher burden of chronic conditions (CIRS score: 4.8 ± 3.0 vs 4.4 ± 2.4; P=0.007), show greater levels of cognitive impairment (CDR ≥1: 20.5% vs 12.2%; P<0.001), exhibit more impaired daily functioning (score of the Chinese version of the Disability Assessment for Dementia: 90.6 ± 20.5 vs 96.0 ± 9.6; P<0.001), and have a prior diagnosis of dementia before joining the study (5.9% vs 1.6%; P=0.001). The potential impact of participant imbalance in Phase 2 on study findings is addressed in the Discussion section. No imputation was performed for missing data.
 
Prevalences of mild and major neurocognitive disorders
Prevalence estimates of NCD were stratified by age-group, gender and recruitment setting. Weighted prevalence was calculated using sampling weights that reflected the proportion of participants in each stratum, with reference to the population distribution by age and gender, as well as community and LTC statistics (year-end population, 2022).23 24 Diagnoses included mild NCD and major NCD. For each disorder, prevalence was expressed as the rate per 100 persons, with corresponding 95% confidence interval (95% CI). Sampling errors were estimated using a bootstrap strategy implemented in Stata software (StataCorp, College Station [TX], US). One thousand samples were randomly drawn from the original dataset through sampling with replacement. The standard error of weighted prevalence was calculated as the square root of the sample variance across these resamples.
 
Factors associated with neurocognitive disorders
The psychosocial, physical health, and lifestyle correlates of NCD were evaluated. Crude and adjusted associations (odds ratios) between the prevalence of NCD and three categories of associated factors were examined: (1) demographic characteristics, including age, gender, years of education, marital status (married, co-habiting, widowed, divorced, separated or single), monthly household income (<HK$6000, HK$6000-14 999, HK$15 000-29 999, ≥HK$30 000), and housing type (owned or rented); (2) physical health status, including history of hypertension, postural balance test (pass or fail), corrected vision (normal or abnormal), corrected hearing (normal or abnormal), oral health problems (yes or no), sarcopenia (SARC-F score), and chronic disease burden (CIRS score); and (3) lifestyle habits, including smoking and alcohol consumption (never, former, current), fruit intake (≥two portions/day or not), vegetable intake (≥three portions/day or not),18 25 sleep quality (score of the Pittsburgh Sleep Quality Index21), regular participation (once or more per week) in aerobic, resistance, and intellectual activities,20 and social loneliness.19 Multivariable logistic regression analyses were conducted to identify independent associations between physical health and lifestyle factors and NCD, adjusting for confounders previously linked to NCD, including age, gender, years of education, marital status, and socio-economic status.5 6 8 All analyses were performed using SPSS (Windows version 22.0; IBM Corp, Armonk [NY], US), and differences were considered statistically significant at P<0.05.
 
Results
Participant characteristics
Basic characteristics of participants living in the community and in LTC settings are presented in Table 1. The mean age was 69.6 ± 7.5 years (range, 60-105). Just over half of the respondents (53.6%) were born in Hong Kong. A large proportion had attained a secondary school education or above (66.1%) and were married or co-habiting (67.5%). Most older adults were economically inactive (retired, homemaker, or never worked) [78.1%].
 

Table 1. Socio-economic and health characteristics of participants in the Hong Kong Mental Morbidity Survey for Older People (n=4871)
 
Of the 503 participants residing in LTC facilities, 274 (54.5%) were women and the mean age was 80.3 ± 11.0 years (range, 60-106). More than half (54.6%) were born in Chinese Mainland; 30.4% had attained secondary education or above; and 50.4% were widowed, divorced or separated. Compared with the LTC sample, the community sample included a higher proportion of women (56.3% vs 54.5%) and younger-old adults (aged <75 years: 77.7% vs 32.6%), whereas the LTC sample included more men (45.5% vs 43.7%) and adults aged ≥75 years (67.4% vs 22.2%). After sample weighting by age and gender, both samples were comparable with the overall older population in Hong Kong (Table 1).
 
Cognitive function and neuropsychiatric symptoms
The distribution of CDR before sample weighting is presented by 5-year age intervals and gender in both community and LTC settings (Table 2). Older age was associated with a higher prevalence and greater severity of NCD, as measured by CDR (P<0.001). Montreal Cognitive Assessment scores stratified by gender and grouped into 5-year age intervals are also presented for community-dwelling participants (Table 3). Older age was associated with lower HK-MoCA scores (P<0.001), while men had higher HK-MoCA scores within 5-year age-groups >70 years (P<0.05).
 

Table 2. Distribution of Clinical Dementia Rating by age-group, gender, and setting (unweighted) [n=4871]
 

Table 3. Montreal Cognitive Assessment total scores by age and gender among community-dwelling participants (unweighted)
 
The proportion of neuropsychiatric symptoms increased with worsening cognitive impairment. Among community-dwelling participants, the prevalence of psychotic symptoms rose from 2.1% in those with normal cognition to 6.3% in those with mild NCD, and 21.3% in those with major NCD (P<0.001). Similarly, the prevalence of depression and anxiety also increased with higher CDR scores (P<0.001). Sleep disturbances were common across all cognitive groups, affecting 32.2% of participants with normal cognition, 43.5% with mild NCD, and 40.2% with major NCD.
 
Prevalence of neurocognitive disorders
The unweighted prevalence of mild and major NCD is presented in online supplementary Table. As shown in Table 4, the weighted prevalence of mild NCD was 21.8% among community-dwelling older adults, 24.3% among those living in LTC facilities, and 21.8% overall in Hong Kong. For major NCD, prevalence was 7.4% in the community, significantly higher at 68.8% in LTC settings, and 9.7% overall.
 

Table 4. Weighted prevalence of neurocognitive disorders in the Hong Kong older population (n=4871)
 
Among Phase 2 community-dwelling participants with mild or major NCD, 22.0% met the DSM-5 criteria for Alzheimer’s disease, 23.7% had mixed vascular NCD and AD, and 43.5% had vascular NCD. Neurocognitive disorders due to Lewy body disease and frontotemporal lobar degeneration accounted for 1.2% and 0.5% of cases, respectively. The apolipoprotein E4 genotype was identified in 17% of cognitively normal participants, 19% of those with mild NCD, and 22% of those with major NCD. No significant differences in apolipoprotein E4 distribution were observed across cognitive function groups.
 
Physical health and lifestyle correlates of neurocognitive disorders
Mild neurocognitive disorders
In unadjusted analyses, older age, fewer years of education, being widowed, divorced or separated, living in rented housing, and lower household income were significantly associated with a higher prevalence of mild NCD. These factors were subsequently controlled for in the logistic regression analyses.
 
After controlling for the above demographic confounders, hypertension, diabetes mellitus, history of stroke, poor postural balance, higher SARC-F scores, visual or hearing impairment, and dental problems were associated with significantly higher adjusted ORs for mild NCD (P<0.05). Physical exercise (mind-body and resistance), engagement in intellectual activities, and better subjective sleep quality were associated with lower adjusted ORs for mild NCD (P<0.05). In contrast, individuals with mild NCD had significantly higher loneliness scores (P<0.05) [Table 5].
 

Table 5. Psychosocial and physical health correlates of neurocognitive disorders (unweighted)
 
Major neurocognitive disorders
Similar demographic risk factors, such as older age, female gender, fewer years of education, being widowed, divorced, separated or never married, living in rented housing, and lower household income level were associated with a higher prevalence of major NCD. These factors were controlled for in the logistic regression analyses (Table 5).
 
After controlling for demographic confounders, hypertension, diabetes mellitus, history of stroke, poor postural balance, abnormal vision or hearing, edentulism, high SARC-F scores (≥2), and multiple co-morbidities (≥4 chronic diseases) were associated with higher adjusted ORs for major NCD (P<0.05) [Table 5].
 
Less loneliness, participation in mind-body physical exercise, engagement in intellectual activities, and consumption of three portions of vegetables or more per day were associated with a lower likelihood of major NCD after adjustment for demographic confounders (P<0.05). Poor sleep quality was associated with a higher risk of major NCD in unadjusted analyses (Table 5).
 
Family history
A family history of dementia was reported by 27% of cognitively normal participants, 25% of those with mild NCD, and 23% of those with major NCD. Pearson Chi squared test showed no significant differences across groups.
 
Service use
Self-reported service utilisation among community-dwelling participants with NCD was assessed in 488 individuals who completed the Phase 2 assessment. Participants with mild and major NCD reported higher use of inpatient, accident and emergency, and outpatient services compared with those with normal cognition. Notably, participants with major NCD reported significantly more psychiatric (15.7%) and neurological (23.0%) consultations in the preceding 3 months than those with normal cognition (2.5% and 2.7%, respectively) and those with mild NCD (6.3% and 4.2%, respectively) [P<0.001].
 
Discussion
Main findings
Prevalence of neurocognitive disorders in Hong Kong compared with other Asian economies
As population ageing accelerates, the Asia-Pacific region is projected to experience more than a threefold increase in the number of people living with dementia over the next three decades, rising from 23 million in 2015 to 71 million by 2050.26 This territory-wide, population-based study provides up-to-date prevalence estimates of NCD among adults aged ≥60 years in Hong Kong in 2022. The prevalence of mild NCD was 21.8% (21.8% in the community; 24.3% in LTC settings), while the prevalence of major NCD was 9.7% (7.4% in the community; 68.8% in LTC settings).26
 
A nationwide population-based study conducted in Chinese Mainland in 2020 reported overall age- and gender-adjusted prevalences of 15.5% (95% CI=15.2-15.9) for MCI and 6.0% (95% CI=5.8-6.3) for dementia.5 The relatively higher prevalence observed in Hong Kong may be related to differences in population demographics and healthcare systems. First, the present study included older adults residing in residential care homes in both recruitment and prevalence estimates. The higher proportion of older adults living in LTC facilities in Hong Kong (3.7% of the older population)24 compared with Chinese Mainland (<1%),27 combined with the high prevalence of major NCD among LTC residents (68.8%), contributed to an increased overall prevalence of major NCD in Hong Kong. Second, even after excluding LTC residents, the prevalence of NCD among community-dwelling older adults in Hong Kong remained higher. This difference may be attributed to longer life expectancy (83.7 vs 78.6 years) and an age structure characterised by a greater proportion of the oldest-old (population aged ≥80 years: 5.3% vs 2.3%) in Hong Kong28 29 compared with the Chinese Mainland. Nevertheless, comparison of age-specific prevalence rates revealed a lower prevalence of major NCD in younger-old groups in Hong Kong28 29 (age 60-69 years: 1.0% vs 2.9%; age 70-79 years: 4.7% vs 8.4%5), but a higher prevalence among the oldest-old (age ≥80 years: 33.7% vs 16.1%5). In contrast, the prevalence of mild NCD was consistently higher across all age-groups in Hong Kong (age 60-69 years: 14.5% vs 11.8%; age 70-79 years: 28.8% vs 19.2%; age ≥80 years: 33.1% vs 25.0%).5 These patterns may reflect better management of cardiovascular diseases and other risk factors (eg, lower rates of smoking and alcohol consumption) among the younger-old population, the approximately twofold higher proportion of the oldest-old among older adults (age ≥85 years: 10.7% vs 4.9%5), and longer survival following dementia onset in Hong Kong.
 
Compared with other developed Asian economies, including Japan, South Korea, Taiwan, and Singapore, the prevalence of dementia in Hong Kong is also relatively high, particularly among those aged 80 years or above (online supplementary Fig).30 Although the high proportion of oldest-old individuals partly contributes to this observation (Hong Kong: 10.7%, Japan: 15.2%, Taiwan: 7.7%, Singapore: 6.6%, South Korea: 6.5%), another important explanation may be the substantial burden of cerebrovascular disease, which is associated with a higher prevalence of dementia (online supplementary Fig).30 In Hong Kong, cerebrovascular risk factors strongly contribute to dementia cases (eg, 43.5% vs 26.7% in Chinese Mainland5), whereas among the oldest-old population, cerebral small vessel disease is highly prevalent.
 
Trends in the prevalence of neurocognitive disorders in Hong Kong
In comparison with the 2008 community-based prevalence study in Hong Kong,4 a decrease in the overall prevalence of mild dementia (mild stage of major NCD) was observed (from 5.4% in 2008 to 3.8% in 2022 [Table 4]), with reductions noted across all age-groups. This decline may be attributed to improved management of physical health risk factors, enabling more older adults to remain within the mild NCD range. Contributing factors may include higher educational attainment, reduced smoking and alcohol consumption, and better control of cerebrovascular disease.
 
Regarding mild NCD (MCI or CDR=0.5), the prevalences of very mild dementia (5.8%) and MCI (23.8%) reported in 20084 are not directly comparable to the prevalence of mild NCD observed in HKMMSOP (21.8%). First, different cognitive screening tools were employed. The 2008 study utilised the CMMSE and AMT,4 whereas HKMMSOP adopted the HK-MoCA as the primary screening instrument. The HK-MoCA was designed to be more sensitive in detecting early executive dysfunction associated with vascular or non-Alzheimer’s pathology.12 In practice, the HK-MoCA12 demonstrates comparable sensitivity (97%) but higher specificity (81% vs 72%) and negative predictive value (93% vs 81%) compared with the CMMSE.4 Second, the diagnostic threshold for mild NCD, labelled as very mild dementia (CDR=0.5) in the 2008 study,4 has shifted over the past decade in favour of an early-detection paradigm. Advances in screening accuracy and diagnostic algorithms may have contributed to a higher detection rate of mild NCD in HKMMSOP. Finally, due to methodological limitations in the 2008 study,4 comparisons across the full spectrum of cognitive impairment are restricted. The CDR assessments were only conducted among participants who screened positive for cognitive impairment and proceeded to Phase 2 clinician evaluation. In contrast, CDR scores in HKMMSOP were determined for all participants during Phase 1 by trained research assistants and subsequently corroborated by experienced psychiatrists.
 
Finally, optimisation of dementia risk management, along with changes in the population age structure, may also help explain the increased concentration of moderate and severe cases among the oldest-old participants in HKMMSOP.
 
Multidimensional associated factors
This study identified several risk factors associated with NCD, many of which were common to both mild and major NCD. These included increasing age, lower educational attainment, being widowed, divorced or separated, and poorer socio-economic status as indicated by living in rented housing and reporting a lower household income. These findings are consistent with previous studies.5 8 31 Female gender was associated with major NCD, but not with mild NCD, among older adults in Hong Kong.
 
Regarding physical health conditions, in addition to cardiovascular disease, poorer postural balance, higher sarcopenia scores, visual and hearing impairment, and oral health problems were associated with the presence of NCD. A greater number of co-morbidities was associated with major NCD, while poor sleep quality was associated with an increased risk of mild NCD. With respect to potentially modifiable lifestyle factors, consuming three portions of vegetables or more per day was associated with a lower prevalence of major NCD. Regular physical exercise, engagement in intellectual activities, and lower levels of loneliness were associated with a reduced prevalence of NCD. The cross-sectional associations observed between potentially modifiable factors and NCD in this study may enrich the existing evidence base and provide converging directions for future research into causal relationships. These findings may also inform policy development aimed at the dementia prevention worldwide.
 
Limitations
The findings of HKMMSOP should be interpreted in light of several limitations. First, this was a cross-sectional study; therefore, causal relationships between NCD and associated factors cannot be inferred. Second, sampling bias is an inherent limitation in prevalence studies, as individuals with an existing diagnosis and ongoing treatment may be less likely to participate (due to reduced activity levels resulting in underestimation) or more motivated to enrol, potentially leading to overestimation). Hard-to-reach populations may also have been underrepresented due to factors such as poor physical or cognitive function, limited mobility, or the absence of family caregivers. The COVID‑19 pandemic likely exacerbated sample bias in this study: the household response rate was merely 8.4%, and the sample over‑represented women and younger‑old adults, potentially underestimating NCD severity among the oldest‑old.
 
Third, participants who did not attend Phase 2 assessments were older and had a greater burden of physical morbidity. The main reasons for non-participation among individuals with positive screening results in Phase 1 included ‘assessment centre too far from home’, ‘too old or too frail’, ‘no accompanying caregiver’, and ‘no perceived necessity’. While Phase 1 assessments demonstrated satisfactory positive and negative predictive values for NCD diagnosis (90% and 93%, respectively), differences in participation profiles between those who did and did not complete Phase 2 may have influenced prevalence estimates.
 
Finally, HKMMSOP was conducted during periods when Hong Kong was affected by various phases of the COVID-19 pandemic. Infection control measures adversely impacted participant recruitment (low household response rate: 8.4%) and interview arrangements. Surveys involving residents of care homes and hostels were particularly restricted due to stringent lockdown policies. As a result, only a limited number of in-person, telephone, or online assessments could be conducted with older participants. Most information was obtained from family caregivers or formal carers within the respective institutions, which may have influenced the reliability and validity of the assessment instruments.
 
Implications
Despite these limitations, the findings of this study remain valuable for informing future clinical practice, public health interventions, and research priorities. First, the HKMMSOP revealed that nearly one in five older adults in Hong Kong had mild NCD. This pattern is likely not unique to Hong Kong and may also apply to other Asian metropolitan cities characterised by increasing life expectancy and a high burden of physical co-morbidities among older populations. Mild NCD represents an at-risk state with variable clinical trajectories. In a 5-year prospective study of Chinese older adults with MCI, approximately 30% progressed to dementia, while others either remained stable or improved to normal cognitive function.32 Given the spectrum from normal cognition to mild and major NCD encountered in primary care, prevention and timely intervention should address a broad range of associated health factors, particularly common and modifiable ones operating across the life course of cognitive health, such as educational attainment, socio-economic status, sensorimotor function, physical exercise, and intellectual activity.7 33 Although the cross-sectional design of the HKMMSOP does not permit causal inference, early intervention and management of these modifiable health risks may help reduce progression to major NCD, improve quality of life and functional capacity among individuals living with MCI, and yield meaningful clinical and economic benefits.
 
Within Hong Kong, the development of District Health Centres provides an opportunity to support primary care providers in planning screening and early intervention programmes for cognitive and mental health. Optimal management of cardiovascular disease and related risk factors from midlife is essential as cerebral small vessel disease contributes to—and may play a causal role in—a substantial proportion of vascular and mixed dementia cases.34 Additionally, sensory function, oral health, and musculoskeletal integrity should be emphasised and integrated into primary healthcare screening. Lifestyle interventions also warrant attention, as clinicians may promote cognitive benefits through various forms of physical exercise and intellectual activities, as well as interventions targeting sleep hygiene and social connectedness.25 35 36 37
 
Second, considering the high prevalence of major NCD (dementia) among the oldest-old population, an integrated medico-social support system should be established. Among participants with major NCD in the HKMMSOP, utilisation rates of specialist services (psychiatric, neurological, and psychological outpatient care) were far from optimal (<40%). This gap may substantially hinder the timely treatment and management of cognitive or behavioural complications, thereby increasing family, economic, and societal burdens.38 At present, primary care consultations specifically addressing cognitive decline are not well established in Hong Kong. While not all individuals with NCD require specialist medical attention, the observed 60% service gap underscores the importance of strengthening primary care management to optimise cognitive function in the community.38 Given that NCD comprises heterogeneous neurodegenerative conditions, appropriate and tiered medical assessments and interventions across both primary and specialist settings play a critical role in accurate subtype diagnosis, personalised management planning, and monitoring of disease progression.
 
Third, approximately 70% of residents in LTC facilities were affected by major NCD. Coordinated efforts and the integration of multidisciplinary care are essential to recognise and address the complex cognitive, physical, and mental health needs of individuals living in LTC facilities, as well as those of their caregivers.
 
Finally, considering the limitations of this cross-sectional prevalence study, further research is warranted in the following two areas: (1) investigation of potentially modifiable health and lifestyle factors for healthy cognitive ageing through longitudinal, cohort, and clinical trial designs to elucidate causal relationships; and (2) focused evaluation of cognitive impairment among the oldest-old population, individuals with complex socio-medical conditions (eg, hard-to-reach groups, those living alone, those with high co-morbidity burden, or limited access to health and social resources), and residents of LTC facilities.
 
Conclusion
The HKMMSOP study provides updated estimates of NCD prevalence among community-dwelling adults aged 60 years or above in Hong Kong during the COVID-19 pandemic period. The weighted prevalence of major NCD in Hong Kong was estimated at 9.7%, with the greatest increase observed among the oldest-old. Given the steep rise in the proportion of the population reaching advanced age, the total number of people living with major NCD is expected to continue increasing over the coming decade. Approximately one in five adults aged 60 years or above had mild NCD. Public health education for older adults should focus on optimising the management of chronic medical and cerebrovascular diseases, promoting regular physical exercise, correcting sensory impairments, and encouraging active engagement in intellectual and social enrichment activities. Equally important, the complex needs of older adults residing in residential care homes should not be overlooked—nearly seven in ten LTC residents were affected by major NCD.
 
Author contributions
Concept or design: LCW Lam, WC Chan, ATC Lee, AWT Fung, SL Ma, CPW Cheng, ST Cheng, FHY Lai, BHK Yip, SYS Wong.
Acquisition of data: LCW Lam, WC Chan, ATC Lee, Z Huo, VC Lin.
Analysis or interpretation of data: LCW Lam, WC Chan, ATC Lee, Z Huo, VC Lin.
Drafting of the manuscript: All authors.
Critical revision of the manuscript for important intellectual content: All authors.
 
All authors had full access to the data, contributed to the study, approved the final version for publication, and take responsibility for its accuracy and integrity.
 
Conflicts of interest
All authors have disclosed no conflicts of interest.
 
Acknowledgement
The authors thank the participants, their family members, and staff of the participating long-term care homes for the generous support they offered. Special thanks are extended to the Hospital Authority psychogeriatric teams for encouraging selected old age homes to participate.
 
Declaration
Part of this study was presented as oral presentation at the 2024 International Congress on Neuropsychiatry in Melbourne, Australia, 27-29 October 2024.
 
Funding/support
This commissioned study was funded by the Health and Medical Research Fund of the Hong Kong SAR Government (Ref No.: MHS-P1 Part 3). The funder had no role in study design, data collection, analysis, interpretation, or manuscript preparation.
 
Ethics approval
This research was approved by the Survey and Behavioural Research Ethics Committee (Ref No.: SBRE 18-628) and the Clinical Research Ethics Committee of The Chinese University of Hong Kong, Hong Kong (Ref No.: CREC NTEC CUHK 2018-0529). Written consent was obtained from each participant or their first-degree relative (for those with profound cognitive impairments or sensory deficits) before joining the study.
 
References
1. López-Otín C, Blasco MA, Partridge L, Serrano M, Kroemer G. The hallmarks of aging. Cell 2013;153:1194–217. Crossref
2. Census and Statistics Department, Hong Kong SAR Government. Hong Kong Population Projections 2022-2046. Aug 2023. Available from: https://www.censtatd.gov.hk/en/data/stat_report/product/B1120015/att/B1120015092023XXXXB01.pdf. Accessed 17 Mar 2025.
3. GBD 2019 Dementia Forecasting Collaborators. Estimation of the global prevalence of dementia in 2019 and forecasted prevalence in 2050: an analysis for the Global Burden of Disease Study 2019. Lancet Public Health 2022;7:e105-25. Crossref
4. Lam LC, Tam CW, Lui VW, et al. Prevalence of very mild and mild dementia in community-dwelling older Chinese people in Hong Kong. Int Psychogeriatr 2008;20:135-48. Crossref
5. Jia L, Du Y, Chu L, et al. Prevalence, risk factors, and management of dementia and mild cognitive impairment in adults aged 60 years or older in China: a cross-sectional study. Lancet Public Health 2020;5:e661-71. Crossref
6. Livingston G, Huntley J, Liu KY, et al. Dementia prevention, intervention, and care: 2024 report of the Lancet standing Commission. Lancet 2024;404:572-628. Crossref
7. Brayne C, Davis D. Making Alzheimer’s and dementia research fit for populations. Lancet 2012;380:1441-3. Crossref
8. Livingston G, Huntley J, Sommerlad A, et al. Dementia prevention, intervention, and care: 2020 report of the Lancet Commission. Lancet 2020;396:413-46. Crossref
9. Fung AW, Chan WC, Wong CS, et al. Prevalence of anxiety disorders in community dwelling older adults in Hong Kong. Int Psychogeriatr 2017;29:259-67. Crossref
10. Lam LC, Tam CW, Lui VW, et al. Screening of mild cognitive impairment in Chinese older adults—a multistage validation of the Chinese abbreviated mild cognitive impairment test. Neuroepidemiology 2008;30:6-12. Crossref
11. Wong A, Law LS, Liu W, et al. Montreal Cognitive Assessment: one cutoff never fits all. Stroke 2015;46:3547-50. Crossref
12. Yeung PY, Wong LL, Chan CC, Leung JL, Yung CY. A validation study of the Hong Kong version of Montreal Cognitive Assessment (HK-MoCA) in Chinese older adults in Hong Kong. Hong Kong Med J 2014;20:504-10. Crossref
13. Morris JC, Ernesto C, Schafer K, et al. Clinical Dementia Rating training and reliability in multicenter studies: the Alzheimer’s Disease Cooperative Study experience. Neurology 1997;48:1508-10. Crossref
14. Kaufer DI, Cummings JL, Ketchel P, et al. Validation of the NPI-Q, a brief clinical form of the Neuropsychiatric Inventory. J Neuropsychiatry Clin Neurosci 2000;12:233-9. Crossref
15. Conwell Y, Forbes NT, Cox C, Caine ED. Validation of a measure of physical illness burden at autopsy: the Cumulative Illness Rating Scale. J Am Geriatr Soc 1993;41:38-41. Crossref
16. Malmstrom TK, Morley JE. SARC-F: a simple questionnaire to rapidly diagnose sarcopenia. J Am Med Dir Assoc 2013;14:531-2. Crossref
17. Mok CC, Siu AM, Chan WC, Yeung KM, Pan PC, Li SW. Functional disabilities profile of Chinese elderly people with Alzheimer’s disease—a validation study on the Chinese version of the Disability Assessment for Dementia. Dement Geriatr Cogn Disord 2005;20:112-9. Crossref
18. Lee AT, Richards M, Chan WC, Chiu HF, Lee RS, Lam LC. Lower risk of incident dementia among Chinese older adults having three servings of vegetables and two servings of fruits a day. Age Ageing 2017;46:773-9. Crossref
19. Leung GT, de Jong Gierveld J, Lam LC. Validation of the Chinese translation of the 6-item De Jong Gierveld Loneliness Scale in elderly Chinese. Int Psychogeriatr 2008;20:1262-72. Crossref
20. Leung GT, Fung AW, Tam CW, et al. Examining the association between late-life leisure activity participation and global cognitive decline in community-dwelling elderly Chinese in Hong Kong. Int J Geriatr Psychiatry 2011;26:39-47. Crossref
21. Tsai PS, Wang SY, Wang MY, et al. Psychometric evaluation of the Chinese version of the Pittsburgh Sleep Quality Index (CPSQI) in primary insomnia and control subjects. Qual Life Res 2005;14:1943-52. Crossref
22. American Psychiatric Association, DSM-5 Task Force. Diagnostic and Statistical Manual of Mental Disorders: DSM-5. 5th Edition. American Psychiatric Publishing; 2013. Crossref
23. Census and Statistics Department, Hong Kong SAR Government. Population by sex and age group 2022. Available from: https://www.censtatd.gov.hk/en/web_table.html?id=1A. Accessed 10 Jul 2025.
24. Census and Statistics Department, Hong Kong SAR Government. Thematic Report: Older Persons. Feb 2023. Available from: https://www.censtatd.gov.hk/en/data/stat_report/product/B1120118/att/B11201182021XXXXB0100.pdf. Accessed 23 Dec 2024.
25. Lee AT, Richards M, Chan WC, Chiu HF, Lee RS, Lam LC. Intensity and types of physical exercise in relation to dementia risk reduction in community-living older adults. J Am Med Dir Assoc 2015;16:899.e1-7. Crossref
26. Alzheimer’s Disease International. Dementia in the Asia Pacific Region. Nov 2014. Available from: https://www.alzint.org/resource/dementia-in-the-asia-pacific-region/. Accessed 18 Mar 2026.
27. Ministry of Civil Affairs, National Working Committee on Aging. 2024 National Bulletin on the Development of Aging Affairs [in Chinese]. Jul 2025. Available from: https://www.mca.gov.cn/n152/n165/c1662004999980006089/part/21508.pdf. Accessed 17 Mar 2026.
28. Statista. Share of population aged 60 and older in China from 1950 to 2020 with forecasts until 2100. Available from: https://www.statista.com/statistics/251529/share-of-persons-aged-60-and-older-in-the-chinese-population/. Accessed 17 Dec 2024.
29. Census and Statistics Department, Hong Kong SAR Government. Hong Kong Population Census—Summary Results. Available from: https://www.censtatd.gov.hk/en/data/stat_report/product/B1120106/att/B11201062021XXXXB01.pdf. Accessed 17 Dec 2024.
30. Institute for Health Metrics and Evaluation, University of Washington. Global Burden of Disease Results 2021. Available from: https://vizhub.healthdata.org/gbd-results/. Accessed 2 Mar 2025.
31. Kalaria RN, Maestre GE, Arizaga R, et al. Alzheimer’s disease and vascular dementia in developing countries: prevalence, management, and risk factors. Lancet Neurol 2008;7:812-26. Crossref
32. Wong CH, Leung GT, Fung AW, Chan WC, Lam LC. Cognitive predictors for five-year conversion to dementia in community-dwelling Chinese older adults. Int Psychogeriatr 2013;25:1125-34. Crossref
33. Flodgren GM, Berg RC. Primary and secondary prevention interventions for cognitive decline and dementia [internet]. Available from: https://pubmed.ncbi.nlm.nih.gov/29553642/. Accessed 18 Mar 2026.
34. Lam BY, Cai Y, Akinyemi R, et al. The global burden of cerebral small vessel disease in low- and middle-income countries: a systematic review and meta-analysis. Int J Stroke 2023;18:15-27. Crossref
35. Lam LC, Tam CW, Lui VW, et al. Modality of physical exercise and cognitive function in Hong Kong older Chinese community. Int J Geriatr Psychiatry 2009;24:48-53. Crossref
36. Lam LC, Chau RC, Wong BM, et al. A 1-year randomized controlled trial comparing mind body exercise (Tai Chi) with stretching and toning exercise on cognitive function in older Chinese adults at risk of cognitive decline. J Am Med Dir Assoc 2012;13:568.e15-20. Crossref
37. Lee AT, Luo Y, Huo Z, Shi L, Chu WC, Lam LC. Effect of increasing cognitive activity participation on default mode network in older adults with subjective cognitive decline: a randomised controlled trial. EBioMedicine 2024;102:105082. Crossref
38. Huo Z, Yip BH, Lee AT, et al. Healthcare utilization and economic costs of neurocognitive disorders in community-dwelling older Chinese adults: a comparison with 9 Asian economies. J Alzheimers Dis 2025;107:515-28. Crossref

Development and optimisation strategies for a nomogram-based predictive model of malignancy risk in thyroid nodules

Hong Kong Med J 2026 Feb;32(1):30–40 | Epub 30 Jan 2026
© Hong Kong Academy of Medicine. CC BY-NC-ND 4.0
 
ORIGINAL ARTICLE (HEALTHCARE IN CHINA)  CME
Development and optimisation strategies for a nomogram-based predictive model of malignancy risk in thyroid nodules
Peng He, MD, PhD1 #; Yu Liang, MD2 #; Yuan Zou, MD1; Zhou Zou, BM3; Bo Ren, MD1; Shan Peng, MD4; Hongmei Yuan, MD, PhD1; Qin Chen, MD2
1 Department of Ultrasound Medicine and Ultrasonic Medical Engineering Key Laboratory of Nanchong City, Affiliated Hospital of North Sichuan Medical College, Nanchong, China
2 Department of Ultrasound, Sichuan Academy of Medical Sciences and Sichuan Provincial People’s Hospital, School of Medicine, University of Electronic Science and Technology of China, Chengdu, China
3 Department of Orthopedics, Sichuan Academy of Medical Sciences and Sichuan Provincial People’s Hospital, School of Medicine, University of Electronic Science and Technology of China, Chengdu, China
4 Department of Rehabilitation, Second Clinical College of North Sichuan Medical College, Nanchong, China
# Equal contribution
 
Corresponding author: Dr Yuan Zou (zouyuanxiao@163.com)
 
 Full paper in PDF
 
Abstract
Introduction: This study aimed to develop and validate a clinical prediction model to assist radiologists in optimising the diagnostic classification of the Chinese Thyroid Imaging Reporting and Data System (C-TIRADS).
 
Methods: A total of 1659 patients from two hospitals were included in this study. The derivation cohort comprised 909 patients for model development and internal validation, while 750 patients formed the external validation cohort. A binary logistic regression model was constructed. Model performance in the derivation set was evaluated using receiver operating characteristic (ROC) curves and visualised with a nomogram. In the external validation set, ROC and calibration curves were used to assess discrimination and calibration.
 
Results: The original C-TIRADS category, abnormal cervical lymph node sonographic findings, and changes in thyroid nodule size emerged as significant predictors of C-TIRADS optimisation. The optimised nomogram demonstrated an area under the ROC curve (AUC) of 0.730 (95% confidence interval=0.697-0.762), with a sensitivity of 63.2%, specificity of 74.9%, and overall accuracy of 67.7% for predicting optimisation. Using probability thresholds of ≥60% to recommend an upgrade and <30% to recommend a downgrade, the calibration curve showed good agreement, and decision curve analysis demonstrated a favourable net clinical benefit. External validation confirmed excellent discrimination (AUC=0.865; 95% confidence interval=0.839-0.891).
 
Conclusion: An optimised C-TIRADS model that integrates imaging features of thyroid nodules with clinical risk factors may aid radiologists in improving the diagnostic efficiency and clinical utility of the TIRADS classification.
 
 
New knowledge added by this study
  • This is the first study to integrate clinical risk factors with imaging features to optimise the Chinese Thyroid Imaging Reporting and Data System (C-TIRADS) classification.
  • This work established a risk threshold–based decision-making framework to guide C-TIRADS classification adjustments.
  • External validation demonstrated the model’s generalisability across diverse clinical settings.
Implications for clinical practice or policy
  • Our model improved diagnostic precision through the integration of imaging and clinical risk factors.
  • This research has the potential to optimise resource allocation and reduce interobserver diagnostic variability.
 
 
Introduction
Thyroid nodules are a common clinical finding, with a prevalence of approximately 4% to 7% in the general population, and are most often detected by ultrasonography.1 2 Although most thyroid nodules are benign, distinguishing malignant from benign nodules remains a clinical priority to avoid unnecessary procedures and ensure timely intervention.3 To standardise risk stratification, various Thyroid Imaging Reporting and Data Systems (TIRADS) have been developed,4 5 including the ACR-TIRADS (American College of Radiology),6 the K-TIRADS (Korean Society of Thyroid Radiology),7 and the European Thyroid Association.8 Recognising the need for a system tailored to the Chinese healthcare context, the Chinese Artificial Intelligence Alliance for Thyroid and Breast Ultrasound proposed the Chinese TIRADS (C-TIRADS) in 2021.2 However, existing TIRADS models primarily focus on sonographic characteristics and often overlook relevant clinical risk factors (eg, patient age, sex, and cervical lymph node [LN] involvement).9 In clinical practice, radiologists frequently incorporate such clinical information into their assessments, contributing to inconsistency and variability in TIRADS classification.
 
Papillary thyroid carcinoma accounts for approximately 80% to 90% of all thyroid cancers and is typically characterised by indolent behaviour.10 11 A substantial proportion of new cases involve papillary thyroid microcarcinoma, defined as tumours measuring less than 10 mm in diameter, which generally carry a favourable clinical prognosis.12 Increasing recognition of the indolent nature of papillary thyroid microcarcinoma has raised concerns regarding potential overdiagnosis and overtreatment. However, current risk stratification strategies that rely solely on imaging features may either overestimate or underestimate malignancy risk, depending on the patient’s broader clinical context. Approaches that incorporate clinical risk factors into TIRADS classification could address these limitations and enhance diagnostic accuracy, supporting more individualised patient management.
 
This study aimed to develop and externally validate a predictive model that integrates both imaging characteristics and clinical risk factors to refine the C-TIRADS classification system. To our knowledge, this is the first nomogram-based model to incorporate clinical risk factors into the C-TIRADS framework. The tool is designed to assist radiologists in improving diagnostic consistency and supporting more informed and individualised clinical decision making in the management of thyroid nodules.
 
Methods
Study design and population
This retrospective diagnostic study included patients with thyroid nodules who underwent surgical resection at two tertiary hospitals in China. The derivation cohort comprised patients treated at Sichuan Provincial People’s Hospital from January to December 2022, while the external validation cohort was drawn from Affiliated Hospital of North Sichuan Medical College during the same period. Inclusion criteria were: (1) thyroid nodules confirmed by postoperative pathology and (2) preoperative ultrasonography of the thyroid and cervical LNs with complete imaging and clinical records. Exclusion criteria were: (1) unclear pathological diagnosis; (2) incomplete clinical data; or (3) poor-quality ultrasound images.
 
Imaging evaluation and classification
Two junior radiologists, blinded to clinical and pathological information, independently classified all nodules according to the C-TIRADS criteria. Subsequently, two senior radiologists re-evaluated the cases and adjusted the classifications based on additional clinical risk factors, including patient demographics and cervical LN findings. Any modification from the initial C-TIRADS classification was defined as ‘classification optimisation’ (*C-TIRADS), encompassing both upgrades and downgrades.
 
Data collection
Structured data collection forms were used to record clinical and sonographic variables. The collected data included patient sex, age, nodule size, number of nodules, C-TIRADS classification, and the presence of abnormal cervical LNs on ultrasonography.
 
Predictor variables
Sonographic features that directly determine the C-TIRADS score (such as solidity, echogenicity, aspect ratio, microcalcification, and margin irregularity) were not included independently in the multivariable analysis to avoid collinearity. Based on clinical relevance and univariate regression analysis, six predictors were selected for model development, namely, patient sex, age-group (≤40, 40-60, and >60 years),13 14 nodule size, number of nodules (single vs multiple), presence of abnormal cervical LNs, and original C-TIRADS classification.
 
Model development and internal validation
A binary logistic regression model was developed using the derivation cohort from Sichuan Provincial People’s Hospital (n=909). For categorical variables with more than two levels, dummy variables were created. The C-TIRADS category 5 was used as the reference group as it represents the highest level of suspicion and the most definitive management pathway (surgical resection), making it an appropriate clinical baseline to estimate relative malignancy risk and the need for reclassification. Model performance in the derivation cohort was evaluated using the area under the receiver operating characteristic (ROC) curve (AUC), and calibration was assessed by comparing predicted probability (PP) with observed outcomes using calibration plots.
 
We emphasise that the primary outcome variable for model training was the pathological diagnosis (binary: malignant vs benign). The C-TIRADS optimisation, defined as upgrading or downgrading the original category based on PP thresholds, was a post-model clinical decision rule applied to the model output, not the outcome used for model development.
 
Internal validation was performed using bootstrap resampling with 1000 samples to obtain bias-corrected estimates of model performance and 95% confidence intervals (95% CIs). A fixed random seed was set to ensure reproducibility. The bias-corrected C-statistic was 0.728, compared with the original apparent performance of 0.730 (a difference of 0.002), confirming the model’s stable discriminative ability (online supplementary Table 1).
 
External validation
The final model was applied to the external cohort from Affiliated Hospital of North Sichuan Medical College (n=750) to evaluate its generalisability. Model discrimination was evaluated by calculating the AUC in the validation set, and calibration was assessed using calibration curves.
 
Nomogram construction
A nomogram was developed based on the final multivariable regression model to provide a visual tool for clinical application. Each predictor was assigned a score, and the total score corresponded to the PP of C-TIRADS classification optimisation.
 
Decision curve analysis and risk thresholds
Decision curve analysis and clinical impact curves were used to evaluate the clinical utility of the nomogram by quantifying the net benefit across a range of threshold probabilities. Specifically, the nomogram generates a PP indicating whether a nodule’s original C-TIRADS classification should be modified after integrating clinical information. For clinical decision making, we pre-specified probability cut-offs: PP ≥60% (upgrade), PP <30% (downgrade), and PP ≥30% but <60% (unchanged). Based on these thresholds, the model’s recommendations were translated into optimised C-TIRADS categories, which were then compared with radiologists’ optimisation decisions and surgical pathology findings, as appropriate. These thresholds are reported in the Results section and were applied consistently across all performance tables
 
Model performance evaluation
To ensure consistent ROC analysis, all AUCs were calculated using continuous PPs rather than ordinal risk categories. For the original C-TIRADS system, the five-level ordinal classification was transformed into a continuous malignancy probability score using proportional-odds (ordinal logistic) regression. This standard statistical method was employed to model the ordered nature of the C-TIRADS categories and to derive a continuous probability of malignancy for each category, enabling fair comparison in ROC analysis against other models. For the optimised *C-TIRADS system, PPs were directly obtained from the final multivariable logistic regression model. The ROC curves and corresponding AUCs were constructed using these continuous predictions.
 
Statistical analysis
Statistical analyses and data visualisation were performed using SPSS (Windows version 26.0; IBM Corp, Armonk [NY], United States) and RStudio (version 2022). Categorical variables were reported as number of cases or percentages, with group comparisons conducted using Chi squared test or Fisher’s exact test, as appropriate. Multivariable logistic regression analysis was conducted to identify independent predictors. Model discrimination was evaluated using ROC curves, while calibration curves were used to assess model accuracy. Clinical decision and impact curves were established to assess practical clinical utility. A two-tailed P value of <0.05 was considered statistically significant.
 
Results
Baseline characteristics
All models were trained to predict pathological malignancy. The optimised *C-TIRADS classifications presented here were derived by applying predefined probability thresholds to the model’s malignancy predictions.
 
A total of 1659 patients with thyroid nodules were included in the study, comprising 909 patients in the derivation cohort and 750 in the external validation cohort. In the derivation cohort, 71.8% of patients were women, and the majority (90.8%) had nodules measuring ≤30 mm. Approximately 81.7% of patients showed no abnormal cervical LNs on ultrasonography. The rate of C-TIRADS optimisation was 60.6%. In the external validation cohort, similar distributions were observed, with a higher proportion of nodules >30 mm (Table 1).
 

Table 1. Patient and nodule characteristics (n=1659)
 
Univariate analysis
Univariate binary regression analysis revealed that several variables were either significantly associated (P<0.05) or showed a trend towards association (0.05 < P < 0.1) with C-TIRADS optimisation. These variables included patient sex, age, nodule size (10-30 mm), number of nodules, solid composition, blurred margins, aspect ratio >1, abnormal cervical LNs, and C-TIRADS category (Table 2 and online supplementary Table 2).
 

Table 2. Predictor distribution and univariate logistic regression odds ratios for malignancy (n=909)
 
Multivariable model development
A multivariable binary logistic regression model was developed to identify independent predictors associated with C-TIRADS optimisation. Six predictors were independently associated with the outcome. The key predictors of C-TIRADS optimisation were male sex, age 40 to 60 years, thyroid nodule size (per 1-mm increase), multiple thyroid nodules, presence of abnormal cervical LNs, and original C-TIRADS 4A category (online supplementary Table 3). A nomogram model was constructed based on these six independent predictors (Fig 1).
 

Figure 1. Nomogram prediction model to aid radiologists in optimising the Chinese Thyroid Imaging Reporting and Data System classification
 
Model performance in the derivation cohort
The model demonstrated good discrimination, with an AUC of 0.730 (95% CI=0.697-0.762) in the derivation cohort (online supplementary Fig a). Internal validation using 1000 bootstrap samples yielded a bias-corrected C-statistic of 0.728, indicating stable model performance (online supplementary Table 1). Calibration curves showed good agreement between PPs and observed outcomes (online supplementary Fig b).
 
Diagnostic thresholds were evaluated to stratify risk. A PP of ≥60% or <30% was considered indicative of a high likelihood of classification change: a PP of ≥60% suggested upgrading, while a PP of <30% suggested downgrading; PPs between 30% and 60% indicated that the classification was likely to remain unchanged. A detailed summary of sensitivity, specificity, and overall accuracy across these thresholds is presented in online supplementary Table 4.
 
External validation
When applied to the external cohort, the model achieved an AUC of 0.865 (95% CI=0.839-0.891) [online supplementary Fig c], demonstrating excellent generalisability. Calibration plots again confirmed close agreement between predicted and observed probabilities (online supplementary Fig d). At the 60% probability threshold, sensitivity was 85.0%, specificity was 69.0%, and overall accuracy was 79.7% in the external validation cohort. Diagnostic performance metrics across various risk thresholds of the final prediction model were analysed in the external validation population (online supplementary Table 5).
 
Clinical utility
Decision curve analysis (Fig 2a) demonstrated that the nomogram model provided greater net clinical benefit across a wide range of threshold probabilities compared with treating all or no patients. The clinical impact curve (Fig 2b) showed that the number of true positives closely approximated the predicted number across relevant thresholds. The observed distribution of histopathological outcomes was as follows: in the derivation cohort, 769 nodules (84.6%) were confirmed malignant and 140 (15.4%) were benign; in the validation cohort, 434 nodules (57.9%) were malignant and 316 (42.1%) were benign.
 

Figure 2. Comparison of the diagnostic efficacy of the Chinese Thyroid Imaging Reporting and Data System (C-TIRADS) and optimised C-TIRADS (*C-TIRADS) in the diagnosis of benign and malignant thyroid nodules. (a) Clinical decision curve of the predictive model for radiologist-optimised *C-TIRADS classification in the derivation cohort. (b) Comparison of the diagnostic efficacy of C-TIRADS and *C-TIRADS for the diagnosis of benign and malignant thyroid nodules in the derivation cohort. (c) Clinical impact curves of the predictive model for radiologist-optimised C-TIRADS classification in the derivation cohort, showing the number of patients classified as high risk (solid curve) and the number of true positives among them (dashed curve) across probability thresholds. (d) Comparison of the diagnostic efficacy of C-TIRADS and *C-TIRADS for the diagnosis of benign and malignant thyroid nodules in the validation cohort
 
Comparison of diagnostic efficacy between the original C-TIRADS and optimised C-TIRADS classifications demonstrated superior performance of the optimised model in both the derivation and validation cohorts (Fig 2c and d, respectively). The optimised classification achieved higher AUC values for differentiating benign from malignant nodules (AUC=0.97 vs 0.94 in the derivation cohort; AUC=0.97 vs 0.95 in the external validation cohort). The predictive model tended to improve C-TIRADS classification by upgrading category 4A nodules to category 4B or 4C, reflecting enhanced clinical utility (Table 3 and Fig 2).
 

Table 3. Clinical diagnostic performance of the final predictive model in thyroid nodules (n=1659)
 
Application example of the nomogram model
A 55-year-old man underwent ultrasound examination, which revealed a solid hypoechoic thyroid nodule in the right lobe measuring approximately 7.1 × 6.4 mm2 (Fig 3a). Simultaneously, abnormal LNs were detected on the ipsilateral side of the neck, characterised by indistinct corticomedullary differentiation and suspected microcalcifications (Fig 3b). According to the conventional C-TIRADS system, the nodule was initially classified as category 4B. However, application of the nomogram model yielded a cumulative score of 155 points, corresponding to a malignancy risk of >90%. Based on this result, the TIRADS category was optimised and upgraded to category 5 (Fig 3c). Subsequent histopathological examination confirmed the diagnosis of papillary thyroid microcarcinoma with cervical LN metastasis.
 

Figure 3. Representative case demonstrating the diagnostic utility of the nomogram-assisted model. (a) A 55-year-old man presenting with a solid hypoechoic nodule in the right lobe of the thyroid gland (arrow). (b) Ultrasound revealing abnormal cervical lymph node architecture, characterised by poorly defined corticomedullary borders and suspected microcalcifications (arrow). (c) Application of the predictive model to the thyroid nodule described above. By summing the scores assigned to six individual indicators, the final total score is approximately 155 points, corresponding to a malignancy risk of >90%. According to the optimised classification system, the lesion should be upgraded from category 4B to category 5
 
Discussion
This study retrospectively analysed the sonographic characteristics and clinical risk factors of 1659 thyroid nodules from two large tertiary hospitals in western China, with the aim of optimising the C-TIRADS classification. A predictive model integrating clinical parameters and imaging features was developed and externally validated, demonstrating high diagnostic performance (AUC=0.865 in external validation) and clinical benefit, as evidenced by decision curve analysis.
 
Despite the widespread adoption of various TIRADS frameworks globally,2 4 5 6 7 8 fundamental methodological limitations persist. Current models, such as ACR-TIRADS,6 primarily focus on ultrasound features and rely heavily on consensus-driven rather than statistically validated risk stratification systems.6 15 Although TIRADS demonstrates robust sensitivity in clinical settings, its specificity remains relatively limited.16 Interobserver variability is another key concern—radiologists’ subjective interpretation of ultrasound features can result in inconsistent classification outcomes.17 To address these limitations, various strategies have been proposed, including the integration of artificial intelligence techniques to reduce observer subjectivity.18 19 20 Artificial intelligence has shown promise in matching or even surpassing the specificity achieved by radiologists; however, their clinical implementation remains constrained by challenges in interpretability and low acceptance in routine practice.
 
Integrating clinical risk factors may enhance risk stratification for thyroid nodules, as suggested by a growing body of evidence.21 In alignment with this, our study incorporated clinical variables including patient age, sex, number of nodules, and cervical LN status into the predictive model, thereby more accurately reflecting routine clinical diagnostic workflows. While previous studies22 23 24 suggested that male patients with thyroid nodules, particularly those with indeterminate fine-needle aspiration cytology undergoing molecular testing, exhibit a higher malignancy risk,25 our study did not identify a significant difference in thyroid cancer incidence between sexes. This discrepancy may be attributable to methodology differences, as molecular testing was not performed in our cohort and all diagnoses were confirmed through postoperative histopathology. The absence of statistical significance for male sex may reflect population-specific characteristics, such as regional variation in risk factor distribution or age composition.26 These methodological and demographic differences may have attenuated the observed sex-related effect. Nonetheless, male patients in our study were assigned higher risk scores, suggesting an association with malignancy risk, despite the lack of statistical significance.
 
Compared with previous models that primarily focused on intrinsic ultrasound features of thyroid nodules,27 28 29 our nomogram offers a more comprehensive assessment. Although the individual contributions of factors such as sex and age were relatively modest, they reflected subtle clinical patterns often considered by radiologists during decision making. The C-TIRADS optimisation approach demonstrated clear advantages, particularly in reducing unnecessary invasive procedures without compromising diagnostic accuracy, achieving an AUC of 0.972. Furthermore, the new model indicated that a risk threshold of ≥60% favoured the recommendation for C-TIRADS optimisation, whereas a threshold of <30% favoured exclusion. The integration of complex imaging data with clinical information represents a core competency for radiologists.30 With appropriate standardised training and communication frameworks in place, radiologists are well positioned to leverage quantitative metrics generated by the new model into routine diagnostic workflows. This advancement holds promise for improving diagnostic consistency and accuracy in clinical practice.
 
Limitations
This study has several limitations that should be acknowledged. First, the optimisation of the TIRADS classification was influenced by radiologists’ subjective judgement, which may have contributed to interobserver variability. Second, although data collection was conducted by trained junior radiologists, observer variation and the subjective nature of ultrasound interpretation may have affected the model’s performance.31 Third, internal validation using bootstrap resampling may have overestimated model performance due to potential overfitting; therefore, external validation was essential to confirm generalisability. Fourth, owing to the retrospective design, only a limited set of clinical parameters (eg, sex, age, and cervical LN status) was included. Other relevant factors such as body mass index, environmental exposures, nodule location, family history of thyroid cancer, and radiation exposure history,32 33 were not assessed. Finally, the study cohort exclusively comprised cases confirmed by surgical pathology, resulting in a relatively low proportion of benign lesions, which may have introduced selection bias. The exclusion of patients diagnosed solely by fine-needle aspiration was intentional but may have affected the generalisability of the findings.
 
Future directions
To address the limitations of the present study, future research should aim to standardise the application of TIRADS by adopting unified classification frameworks and implementing regular training programmes to enhance interobserver consistency. Prospective multicentre studies involving broader and more diverse populations are warranted, incorporating a wider range of clinical risk factors to improve predictive accuracy. In particular, data regarding family history, radiation exposure, and other relevant variables across centres would support more comprehensive risk assessment and enhance the generalisability of prediction models. In addition, including patients with fine-needle aspiration–confirmed benign nodules may help achieve a more balanced representation of benign and malignant cases. The development and application of nomogram-based structured training programmes for radiologists could also be explored to further improve diagnostic consistency and clinical utility. While the widespread adoption of a revised classification system will require time, we hope that the findings of this study may contribute to that transition.
 
Conclusion
We developed and externally validated a nomogram-based predictive model that integrates imaging features and clinical risk factors to optimise C-TIRADS classification for thyroid nodules. The model demonstrated good discrimination and calibration across internal and external cohorts, offering a practical tool to assist radiologists in refining diagnostic assessments and improving clinical decision making. Future research incorporating additional clinical variables and prospective validation is warranted to further strengthen the model’s applicability across diverse clinical settings.
 
Author contributions
Concept or design: Y Liang, Y Zou, P He, Q Chen.
Acquisition of data: Y Liang, Y Zou, Z Zou, B Ren.
Analysis or interpretation of data: Y Liang, S Peng, Y Zou.
Drafting of the manuscript: Y Liang, Y Zou, HM Yuan, Z Zou.
Critical revision of the manuscript for important intellectual content: P He, Y Zou.
 
All authors had full access to the data, contributed to the study, approved the final version for publication, and take responsibility for its accuracy and integrity.
 
Conflicts of interest
The authors have disclosed no conflicts of interest.
 
Declaration
This manuscript was initially posted as a preprint entitled ‘Development and validation of a clinical prediction model to aid radiologists optimize thyroid C-TIRADS classification’ on Research Square (DOI: 10.21203/rs.3.rs-3831900/v1). After peer feedback and extensive revisions undertaken collaboratively by the author team, the current version has substantially evolved and markedly differs from the preprint version.
 
Funding/support
This research was supported by Sichuan Science and Technology Program (Ref Nos.:2025ZNSFSC1751, 2026YFHZ0039), the University-Industry Collaborative Education Program (Ref No.: 250505236300920), the University-level Project of North Sichuan Medical College (Ref Nos.: CXSY24-06, CBY22-QNA48), and the Hospital-level Projects of the Affiliated Hospital of North Sichuan Medical College, China (Ref Nos.: 210930, 2023-2GC013, 2025LC010). The funders had no role in the study design, data collection/analysis/interpretation, or manuscript preparation.
 
Ethics approval
This research was approved by the Ethics Committee of Sichuan Provincial People’s Hospital (Ref No.: ER20210347) and the Ethics Committee of Affiliated Hospital of North Sichuan Medical College, China (Ref No.: 2021ER436-1). The requirement for informed patient consent was waived by both Committees due to the retrospective nature of the research.
 
Supplementary material
The supplementary material was provided by the authors, and some information may not have been peer reviewed. Accepted supplementary material will be published as submitted by the authors, without any editing or formatting. Any opinions or recommendations discussed are solely those of the author(s) and are not endorsed by the Hong Kong Academy of Medicine and the Hong Kong Medical Association. The Hong Kong Academy of Medicine and the Hong Kong Medical Association disclaim all liability and responsibility arising from any reliance placed on the content.
 
References
1. Haugen BR, Alexander EK, Bible KC, et al. 2015 American Thyroid Association management guidelines for adult patients with thyroid nodules and differentiated thyroid cancer: the American Thyroid Association guidelines task force on thyroid nodules and differentiated thyroid cancer. Thyroid 2016;26:1-133. Crossref
2. Zhou J, Song Y, Zhan W, et al. Thyroid imaging reporting and data system (TIRADS) for ultrasound features of nodules: multicentric retrospective study in China. Endocrine 2021;72:157-70. Crossref
3. Trimboli P. Complexity in the interpretation and application of multiple guidelines for thyroid nodules: the need for coordinated recommendations for “small” lesions. Rev Endocr Metab Disord 2025;26:223-7. Crossref
4. Park JY, Lee HJ, Jang HW, et al. A proposal for a thyroid imaging reporting and data system for ultrasound features of thyroid carcinoma. Thyroid 2009;19:1257-64. Crossref
5. Horvath E, Majlis S, Rossi R, et al. An ultrasonogram reporting system for thyroid nodules stratifying cancer risk for clinical management. J Clin Endocrinol Metab 2009;94:1748-51. Crossref
6. Tessler FN, Middleton WD, Grant EG, et al. ACR Thyroid Imaging, Reporting and Data System (TI-RADS): white paper of the ACR TI-RADS Committee. J Am Coll Radiol 2017;14:587-95. Crossref
7. Shin JH, Baek JH, Chung J, et al. Ultrasonography diagnosis and imaging-based management of thyroid nodules: revised Korean Society of Thyroid Radiology consensus statement and recommendations. Korean J Radiol 2016;17:370-95. Crossref
8. Russ G, Bonnema SJ, Erdogan MF, Durante C, Ngu R, Leenhardt L. European Thyroid Association guidelines for ultrasound malignancy risk stratification of thyroid nodules in adults: the EU-TIRADS. Eur Thyroid J 2017;6:225-37. Crossref
9. Chen Z, Wang JJ, Du JB, et al. Development and validation of a dynamic nomogram for predicting central lymph node metastasis in papillary thyroid carcinoma patients based on clinical and ultrasound features. Quant Imaging Med Surg 2025;15:1555-70. Crossref
10. Boucai L, Zafereo M, Cabanillas ME. Thyroid cancer: a review. JAMA 2024;331:425-35. Crossref
11. Zhang J, Xu S. High aggressiveness of papillary thyroid cancer: from clinical evidence to regulatory cellular networks. Cell Death Discov 2024;10:378. Crossref
12. Ma T, Semsarian CR, Barratt A, et al. Rethinking low-risk papillary thyroid cancers <1 cm (papillary microcarcinomas): an evidence review for recalibrating diagnostic thresholds and/or alternative labels. Thyroid 2021;31:1626-38. Crossref
13. Kwong N, Medici M, Angell TE, et al. The influence of patient age on thyroid nodule formation, multinodularity, and thyroid cancer risk. J Clin Endocrinol Metab 2015;100:4434-40. Crossref
14. Pizzato M, Li M, Vignat J, et al. The epidemiological landscape of thyroid cancer worldwide: GLOBOCAN estimates for incidence and mortality rates in 2020. Lancet Diabetes Endocrinol 2022;10:264-72. Crossref
15. Tessler FN, Middleton WD, Grant EG, Hoang JK. Re: ACR Thyroid Imaging, Reporting and Data System (TI-RADS): white paper of the ACR TI-RADS Committee. J Am Coll Radiol 2018;15(3 Pt A):381-2. Crossref
16. Angelopoulos N, Goulis DG, Chrisogonidis I, et al. Diagnostic performance of European and American College of Radiology Thyroid Imaging Reporting and Data System classification systems in thyroid nodules over 20 mm in diameter. Endocr Pract 2025;31:72-9. Crossref
17. Jin Z, Pei S, Shen H, et al. Comparative study of C-TIRADS, ACR-TIRADS, and EU-TIRADS for diagnosis and management of thyroid nodules. Acad Radiol 2023;30:2181-91. Crossref
18. Wildman-Tobriner B, Buda M, Hoang JK, et al. Using artificial intelligence to revise ACR TI-RADS risk stratification of thyroid nodules: diagnostic accuracy and utility. Radiology 2019;292:112-9. Crossref
19. Wu SH, Li MD, Tong WJ, et al. Adaptive dual-task deep learning for automated thyroid cancer triaging at screening US. Radiol Artif Intell 2025;7:e240271. Crossref
20. Trimboli P, Colombo A, Gamarra E, Ruinelli L, Leoncini A. Performance of computer scientists in the assessment of thyroid nodules using TIRADS lexicons. J Endocrinol Invest 2025;48:877-83. Crossref
21. Kobaly K, Kim CS, Mandel SJ. Contemporary management of thyroid nodules. Annu Rev Med 2022;73:517-28. Crossref
22. Xu L, Li G, Wei Q, El-Naggar AK, Sturgis EM. Family history of cancer and risk of sporadic differentiated thyroid carcinoma. Cancer 2012;118:1228-35. Crossref
23. Iglesias ML, Schmidt A, Ghuzlan AA, et al. Radiation exposure and thyroid cancer: a review. Arch Endocrinol Metab 2017;61:180-7. Crossref
24. Saenko V, Mitsutake N. Radiation-related thyroid cancer. Endocr Rev 2024;45:1-29. Crossref
25. Figge JJ, Gooding WE, Steward DL, et al. Do ultrasound patterns and clinical parameters inform the probability of thyroid cancer predicted by molecular testing in nodules with indeterminate cytology? Thyroid 2021;31:1673-82. Crossref
26. Li X, Xing M, Tu P, et al. Urinary iodine levels and thyroid disorder prevalence in the adult population of China: a large-scale population-based cross-sectional study. Sci Rep 2025;15:14273. Crossref
27. Xiao J, Xiao Q, Cong W, et al. Discriminating malignancy in thyroid nodules: the nomogram versus the Kwak and ACR TI-RADS. Otolaryngol Head Neck Surg 2020;163:1156-65. Crossref
28. Xin Y, Liu F, Shi Y, Yan X, Liu L, Zhu J. A scoring system for assessing the risk of malignant partially cystic thyroid nodules based on ultrasound features. Front Oncol 2021;11:731779. Crossref
29. Zhou T, Hu T, Ni Z, et al. Comparative analysis of machine learning-based ultrasound radiomics in predicting malignancy of partially cystic thyroid nodules. Endocrine 2024;83:118-26. Crossref
30. Bluethgen C, Van Veen D, Zakka C, et al. Best practices for large language models in radiology. Radiology 2025;315:e240528. Crossref
31. He Z, Li Y, Zeng W, et al. Can a computer-aided mass diagnosis model based on perceptive features learned from quantitative mammography radiology reports improve junior radiologists’ diagnosis performance? An observer study. Front Oncol 2021;11:773389. Crossref
32. Kim Y, Roh J, Song DE, et al. Risk factors for posttreatment recurrence in patients with intermediate-risk papillary thyroid carcinoma. Am J Surg 2020;220:642-7. Crossref
33. Zhao J, Wen J, Wang S, Yao J, Liao L, Dong J. Association between adipokines and thyroid carcinoma: a meta-analysis of case-control studies. BMC Cancer 2020;20:788. Crossref

Utilisation trends and early outcomes of robotic arm–assisted total hip arthroplasty in a tertiary joint replacement centre in Hong Kong

Hong Kong Med J 2026 Feb;32(1):23–9 | Epub 2 Feb 2026
© Hong Kong Academy of Medicine. CC BY-NC-ND 4.0
 
ORIGINAL ARTICLE
Utilisation trends and early outcomes of robotic arm–assisted total hip arthroplasty in a tertiary joint replacement centre in Hong Kong
KL Fong1; Amy Cheung, FHKAM (Orthopaedic Surgery), FHKCOS2; Michelle Hilda Luk, FHKAM (Orthopaedic Surgery), FHKCOS2; Thomas KC Leung, FHKAM (Orthopaedic Surgery), FHKCOS2; Lawrence CM Lau, FHKAM (Orthopaedic Surgery), FHKCOS2; PK Chan, FHKAM (Orthopaedic Surgery), FHKCOS1; KY Chiu, FHKAM (Orthopaedic Surgery), FHKCOS1; Henry Fu, FHKAM (Orthopaedic Surgery), FHKCOS1
1 Department of Orthopaedics and Traumatology, The University of Hong Kong, Hong Kong SAR, China
2 Department of Orthopaedics and Traumatology, Queen Mary Hospital, Hong Kong SAR, China
 
Corresponding author: Prof Henry Fu (drhfu@ortho.hku.hk)
 
 Full paper in PDF
 
Abstract
Introduction: This study evaluated utilisation trends and early outcomes of robotic arm–assisted primary total hip arthroplasty (rTHA) compared with conventional THA (cTHA) in Hong Kong.
 
Methods: This retrospective cohort study included all patients who underwent primary THA in public hospitals under the Hong Kong West Cluster (HKWC) from 2019 to 2024. Data were retrieved from the Hospital Authority’s electronic databases. The primary outcome was the percentage utilisation of rTHA relative to cTHA. Secondary outcomes included operating time (skin-to-skin), length of stay (LOS), 30- and 90-day reoperation rates, and 30- and 90-day emergency department attendance. Differences in these outcomes between rTHA and cTHA were examined.
 
Results: In total, there were 311 and 242 cases of rTHA and cTHA, respectively. Robotic utilisation increased from 32.0% in 2019 to 62.2% in 2024. Regarding patient outcomes, rTHA increased operating time by 14.59 minutes (142.02 ± 53.88 vs 127.43 ± 53.34; P=0.002). There was no significant difference in median LOS between the two groups. Robotic surgery was also associated with a lower 30-day reoperation rate (0.32% vs 2.07%; P=0.049). One reoperation due to dislocation was performed in the rTHA group. In the cTHA group, one dislocation, two periprosthetic fractures, and two infections required revision surgery.
 
Conclusion: Given the increasing use of rTHA in the HKWC, the present findings suggest that rTHA is associated with a lower 30-day reoperation rate. As the first local study on early outcomes of rTHA, these results may serve as reference data for other centres.
 
 
New knowledge added by this study
  • Utilisation of robotic arm–assisted primary total hip arthroplasty (rTHA) nearly doubled between 2019 and 2024.
  • Robotic arm–assisted primary total hip arthroplasty was associated with a lower 30-day reoperation rate.
Implications for clinical practice or policy
  • Early results suggested that rTHA was associated with fewer postoperative complications requiring reoperation.
  • Long-term data are needed to further evaluate trends in operating time and length of stay, and to determine how these outcomes translate into improved functional outcomes.
 
 
Introduction
In Hong Kong, robotic surgery has gained popularity across various specialties, with the Da Vinci robot becoming the standard of care in urology and seeing widespread use in general surgery.1 Orthopaedic robotic systems are often semi-active and partially controlled by the surgeon.2 In total hip replacement, an image-based, semi-active, haptic-constrained robotic arm system is commonly used. The Mako Robotic Arm Assisted Surgical System (Stryker Corp, Fort Lauderdale [FL], US) is a surgical system for total hip replacement approved by the US Food and Drug Administration.3 Surgical planning is performed using three-dimensional computed tomography scans, enabling accurate, patient-specific planning. Bone removal is performed under haptic control by the robotic arm, with component implantation angles also guided by the robot, enhancing precision and accuracy.4 5 Western literature has shown that robotic arm–assisted primary total hip arthroplasty (rTHA) yields better radiological and clinical outcomes.6 7 8 However, local data on the early clinical outcomes of robotic total hip replacement remain limited. Robotics was first introduced locally by the Hong Kong West Cluster (HKWC) in 2019, and its use has been increasing. Our cluster has since accumulated substantial experience and moved beyond the learning curve. This study aimed to evaluate utilisation trends and patient outcomes of rTHA compared with conventional THA (cTHA).
 
Methods
Objective
The primary outcome was the percentage utilisation of rTHA relative to cTHA in the HKWC from 2019 to 2024. Secondary outcomes included operating time (skin-to-skin), length of stay (LOS), 30-day and 90-day reoperation, and 30-day and 90-day emergency department attendance. Length of stay was defined as the duration of inpatient admission following THA. Discharge criteria included the ability to ambulate with a walking aid and the absence of impending medical conditions. Reoperation was defined as undergoing another hip procedure, such as revision or implant removal, within 30 or 90 days of surgery. Emergency department attendance was defined as presentation to the accident and emergency department within 30 or 90 days following discharge.
 
Additionally, postoperative complication rates were examined in terms of reoperation, emergency department attendance, and the corresponding diagnoses. Complications of interest included dislocation, periprosthetic fracture, and periprosthetic joint infection. The study adhered to the STROBE (Strengthening the Reporting of Observational Studies in Epidemiology) guideline.
 
Surgical technique
Total hip arthroplasty in both groups was performed via a posterior approach with the patient in the left lateral decubitus position. All patients received a cementless, proximally coated femoral stem (Accolade II; Stryker Corp, Mahwah [NJ], US) and a porous acetabular shell (Trident Acetabular System; Stryker Corp, Mahwah [NJ], US).3
 
In the cTHA group, the femoral osteotomy site was marked based on a predetermined distance from the lesser and greater trochanters. The acetabulum was reamed freehand, down to the true floor and healthy bleeding bone. Cup impaction was guided by an alignment guide and intraoperative landmarks, including the transverse acetabular ligament and the anterior and posterior acetabular walls, to determine the orientation of the acetabular component.9 10
 
All rTHAs were performed using the Mako Robotic Arm Assisted Surgical System, which guided acetabular reaming and component placement within haptically confined boundaries. A trial cup was inserted at the appropriate abduction angle, with anteversion guided by the robotic arm.10
 
Study design and patient selection
This was a retrospective cohort study. Data were retrieved from the Clinical Data Analysis and Reporting System (CDARS) and the Clinical Management System (CMS). The CDARS is a database containing medical information for research purposes, whereas the CMS is primarily used for day-to-day clinical management. The function to distinguish between rTHA and cTHA was introduced in CDARS in 2021. Therefore, data from 1 January 2021 to 31 December 2024 were collected via CDARS, while data from 2019 to 2020 were obtained through CMS chart review. Both systems follow standardised data protocols and can be used concurrently.
 
All patients who underwent primary unilateral rTHA or cTHA in the HKWC were included. Diagnoses included osteoarthritis, avascular necrosis, aseptic necrosis, developmental dysplasia of the hip, dislocation, and fractures. Patients with diagnoses of bone malignancy, chronic osteomyelitis, or complex primary THA—such as Crowe type III/IV hip dysplasia or post-traumatic osteoarthritis with retained hardware—were excluded. Patients who had staged bilateral procedures were included as separate cases. During the initial learning phase in 2019, all surgeries were performed by a single surgeon (corresponding author). From 2020 onwards, other surgeons within the division began performing rTHA.
 
Statistical analysis
All analyses were conducted using SPSS (Windows version 29.0; IBM Corp, Armonk [NY], US). A two-tailed significance threshold was set at P<0.05. The normality of continuous variables was assessed using skewness and kurtosis, as well as the Shapiro–Wilk and Kolmogorov–Smirnov tests. Normally distributed continuous variables, such as operating time, were compared using independent samples t tests. The non–parametric continuous variable, LOS, was analysed using the Mann-Whitney U test. Categorical data were compared via the Chi squared test.
 
Results
From 2019 to 2024, a total of 311 and 242 THAs were performed in the rTHA and cTHA groups, respectively. Patient demographics are summarised in Table 1. In terms of sex distribution, 61.7% of patients in the rTHA group and 63.6% of those in the cTHA group were women. Patients undergoing rTHA had a lower mean age at the time of surgery compared with those receiving cTHA (62.48 ± 12.88 vs 66.10 ± 10.52 years; P=0.002). There was a tendency for rTHA to be performed in younger patients, although the distribution of diagnostic categories was similar between groups.
 

Table 1. Baseline characteristics
 
Osteoarthritis was the most common diagnosis in both groups, accounting for 58.5% of rTHA cases and 51.2% of cTHA cases. The second most common diagnosis was avascular necrosis, representing 15.1% of rTHA cases and 21.1% of cTHA cases (Table 1).
 
Utilisation trends
The primary outcome was the utilisation rate of rTHA in the HKWC. As shown in Table 2, a steady increase in robotic cases was observed, from 32.0% in 2019 to 62.2% in 2024. Notably, the highest proportion was recorded in 2023, at 75.2%. In contrast, the proportion of conventional cases steadily declined, almost halving from 68.0% in 2019 to 37.8% in 2024. The substantial increase in rTHA proportion illustrates a clear shift from cTHA to rTHA as the predominant surgical approach over the study period.
 

Table 2. Utilisation trends of robotic arm–assisted primary total hip arthroplasty and conventional total hip arthroplasty from 2019 to 2024
 
Operating time (skin-to-skin)
The secondary outcomes are presented in Table 3. Robotic arm–assisted primary total hip arthroplasty had a mean operating time of 142.02 minutes, which was 14.59 minutes longer than that of cTHA (127.43 minutes). For rTHA, the mean operating time was 131.53 minutes in 2019, increased to 139.58 minutes in 2020 with more surgeons beginning their learning curve, and then reached a plateau over the next 2 years (2021: 146.99 minutes; 2022: 152.79 minutes). In the final 2 years of the study, operating time decreased to 142.00 minutes in 2023 and 133.83 minutes in 2024, reflecting passing of learning curve by the whole surgical team. In contrast, cTHA operating times ranged from 111 to 139 minutes, without a clear trend. In the first 2 years, operating times were similar (2019: 131.04 minutes; 2020: 131.75 minutes), followed by a slight increase to 139.38 minutes in 2022, then dropped to 111.16 minutes in 2023, with a moderate increase to 120.04 minutes in 2024.
 

Table 3. Secondary outcomes (n=553)
 
Length of stay
Discharge criteria remained consistent throughout the study period and included the ability to ambulate independently with a walking aid, effective pain control, absence of immediate wound complications, and no major medical issues. Most patients were discharged directly under the enhanced recovery after surgery protocol; only those undergoing complex primary THA (<10% of the cohort) were transferred to rehabilitation hospitals. The median LOS was the same in both groups (6.00 vs 6.00 days; P=0.260) [Table 3]. When rTHA was first introduced in 2019, all procedures were performed by a single surgeon, which may have influenced early outcomes. In 2020 and 2021, more surgeons began performing rTHA, which may partly explain the longer LOS observed during this learning-curve period.
 
Reoperation and emergency department attendance
Robotic arm–assisted primary total hip arthroplasty was associated with a lower 30-day reoperation rate compared with cTHA (0.32% vs 2.07%; P=0.049). Similarly, a trend towards a lower 90-day reoperation rate was observed for rTHA (0.64% vs 2.48%; P=0.072) [Table 3].
 
All 30-day reoperations were hip-related. As shown in Table 4, one reoperation was performed in the rTHA group and five in the cTHA group. In the rTHA group, reoperation was required for a hip dislocation, which was managed by closed reduction. In the cTHA group, two periprosthetic fractures of the proximal femur were treated with open reduction and internal fixation. Two additional reoperations were performed for wound infections, and one hip dislocation was managed by closed reduction.
 

Table 4. Reoperation and emergency department attendance causes (n=553)
 
All 90-day reoperations were also hip-related. In the rTHA group, one additional case of dislocation was noted. In the cTHA group, one new case of periprosthetic fracture was identified (Table 4).
 
Discussion
The number of THAs utilising robotic assistance increased over the study period. The proportion of robotic cases relative to cTHA also rose, with rTHA accounting for 56.2% of all THAs when all years were combined. These findings indicate a shift in the primary surgical approach within the HKWC from conventional to robotic techniques. At present, four public hospitals in Hong Kong have acquired robotic systems, with several additional systems available on loan. Brinkman et al11 reported that public interest in rTHA substantially increased between 2011 and 2020. Compared with online search volumes for conventional arthroplasty, this growth was statistically significant.
 
Clement et al12 reported that, despite the higher costs associated with robotics, rTHA was a cost-effective intervention compared with cTHA owing to greater gains in health-related quality of life, as measured by the EuroQol 5-Dimension. In addition, the rising popularity of rTHA may be attributed to its favourable clinical, functional, and radiological outcomes, which are discussed further below.
 
Robotic THA was associated with an increase in operating time of approximately 15 minutes, which is slightly less than the 20-minute increase reported by Han et al (20.72 minutes; P=0.002).13 This difference may be attributable to the need for system registration or placement of positioning pins, as well as the effects of the learning curve. When rTHA was first introduced in Hong Kong in 2019, only one experienced surgeon was using the procedure, with an average operating time of 131 minutes. As more surgeons began using the robotic system, a learning-curve effect was suggested by an increase in operating time over the next 3 years (139.6, 147.0, and 152.8 minutes, respectively). Notably, robotic operating time then decreased by 11 minutes from 2022 to 2023, and by a further 8 minutes to 133.83 minutes, suggesting increased familiarity with the system and the possible completion of the learning curve. Kayani et al14 similarly reported that robot-assisted acetabular cup positioning during THA was associated with a learning curve of 12 cases.
 
There were no statistically significant differences in LOS between the rTHA and cTHA groups; both had a median LOS of 6.00 days. In a retrospective study, Remily et al15 matched patients in a 1:1 ratio between robotic and conventional groups (4630 patients per group) and reported a significantly shorter mean LOS in the rTHA group (3.4 vs 3.7 days; P=0.001). These findings may reflect the ability of robotic technology to execute preoperative plans tailored to each patient’s unique anatomy. The results may also be related to reduced iatrogenic trauma and faster postoperative rehabilitation. Similarly, Heng et al16 found that the mean LOS in the robotic group was approximately 1 day shorter. Nevertheless, differences in data distribution and reporting methods should be noted. While previous authors reported mean LOS, we reported the median LOS due to the non-parametric distribution of our data.
 
Social and cultural factors may also influence LOS. Western patients often have access to more spacious home environments, whereas patients in Hong Kong may reside in more confined living spaces, potentially reducing their willingness or readiness for early discharge. Furthermore, patients and their families in Hong Kong often adopt a more conservative approach to discharge, preferring extended care under medical supervision and a self-perceived burden to their family members if they return home early.17 These factors may contribute to a prolonged LOS.
 
It was evident that rTHA was associated with a lower 30-day reoperation rate, with a trend towards a lower 90-day reoperation rate. Our findings are consistent with those of Shaw et al18 who reported significantly lower dislocation rates with rTHA compared with cTHA (0.6% vs 2.5%; P<0.046). Notably, all cases of unstable rTHA were successfully managed conservatively in the absence of component malposition, whereas 46% of unstable cTHA cases required revision surgery for recurrent instability due to malalignment.18 A previous postoperative analysis in Hong Kong19 showed that 96% of robotically positioned acetabular cups fell within the Lewinnek safe zone (inclination 30°-50°, anteversion 5°-25°).
 
Although rTHA improves the accuracy of implant positioning and reduces outliers in acetabular cup placement,20 21 there remains a lack of data concerning how these improved radiological outcomes translate into differences in long-term clinical recovery, functional outcomes, implant survivorship, and complication rates when compared with cTHA.22
 
Limitations
To our knowledge, this is the first territory-wide study in Asia comparing cTHA and rTHA. However, several limitations should be acknowledged. First, the use of big data analysis through the CDARS precluded adjustment for certain confounding factors, such as surgeon- and hospital-related variables. Second, the dataset was confined to the HKWC as ethics approval could not be obtained for multi-cluster or private hospital data. Although other public-sector clusters are also managed by the Hospital Authority, caution should be exercised when comparing our findings to other settings. Nevertheless, the inclusion of multiple surgeons reflects real-world clinical practice. Finally, functional outcomes and patient-reported outcome measures were not assessed; as such, the impact of rTHA from the patient’s perspective could not be evaluated.
 
Evaluation of longer-term outcomes and registry data from additional clusters will be essential to develop optimal THA strategies, those that achieve key technical objectives, enhance patient outcomes, and reduce complications.
 
Conclusion
The use of rTHA nearly doubled between 2019 and 2024 and was associated with a lower 30-day reoperation rate compared with cTHA. However, as this study focused solely on early patient outcomes, further research is warranted to determine whether these findings translate into improved long-term functional outcomes.
 
Author contributions
Concept or design: KL Fong, H Fu.
Acquisition of data: KL Fong, H Fu.
Analysis or interpretation of data: KL Fong, H Fu.
Drafting of the manuscript: All authors.
Critical revision of the manuscript for important intellectual content: All authors.
 
All authors had full access to the data, contributed to the study, approved the final version for publication, and take responsibility for its accuracy and integrity.
 
Conflicts of interest
All authors have disclosed no conflicts of interest.
 
Declaration
The results of this study were presented as an oral presentation at the 44th Annual Congress of Hong Kong Orthopaedic Association, Hong Kong, 2-3 November 2024.
 
Funding/support
This research received no specific grant from any funding agency in the public, commercial, or not-for-profit sectors.
 
Ethics approval
This research was approved by the Institutional Review Board of The University of Hong Kong/Hospital Authority Hong Kong West Cluster, Hong Kong (Ref No.: UW 24-128). The requirement for informed patient consent was waived by the Board due to the retrospective nature of the study.
 
References
1. Ng AT, Tam PC. Current status of robot-assisted surgery. Hong Kong Med J 2014;20:241-50. Crossref
2. Smith A, Picheca L, Mahood Q. Robotic Surgical Systems for Orthopedics. Ottawa: Canadian Agency for Drugs and Technologies in Health; 2022. Available from: https://www.ncbi.nlm.nih.gov/books/NBK602663/. Accessed 12 Mar 2025.
3. Stryker. Available from: https://www.stryker.com. Accessed 12 Mar 2025.
4. Inabathula A, Semerdzhiev DI, Srinivasan A, Amirouche F, Puri L, Piponov H. Robots on the stage: a snapshot of the American robotic total knee arthroplasty market. JB JS Open Access 2024;9:e24.00063. Crossref
5. Jahng KH, Kamara E, Hepinstall MS. Haptic robotics in total hip arthroplasty. In: Minim Invasive Surg Orthopaedics. New York: Springer; 2015: 1-15. Crossref
6. Salášek M, Pavelka T, Rezek J, et al. Mid-term functional and radiological outcomes after total hip replacement performed for complications of acetabular fractures. Injury 2023;54:110916. Crossref
7. De Santis V, Bonfiglio N, Basilico M, et al. Clinical and radiographic outcomes after total hip arthroplasty with the NANOS neck preserving hip stem: a 10 to 16-year followup study. BMC Musculoskelet Disord 2022;22(Suppl 2):1061. Crossref
8. Perets I, Walsh JP, Close MR, Mu BH, Yuen LC, Domb BG. Robot-assisted total hip arthroplasty: clinical outcomes and complication rate. Int J Med Robot 2018;14:e1912. Crossref
9. Fontalis A, Kayani B, Plastow R, et al. A prospective randomized controlled trial comparing CT-based planning with conventional total hip arthroplasty versus robotic arm-assisted total hip arthroplasty. Bone Joint J 2024;106-B:324-35. Crossref
10. Domb BG, El Bitar YF, Sadik AY, Stake CE, Botser IB. Comparison of robotic-assisted and conventional acetabular cup placement in THA: a matched-pair controlled study. Clin Orthop Relat Res 2014;472:329-36. Crossref
11. Brinkman JC, Christopher ZK, Moore ML, Pollock JR, Haglin JM, Bingham JS. Patient interest in robotic total joint arthroplasty is exponential: a 10-year Google trends analysis. Arthroplast Today 2022;15:13-8. Crossref
12. Clement ND, Gaston P, Hamilton DF, et al. A cost-utility analysis of robotic arm-assisted total hip arthroplasty: using robotic data from the private sector and manual data from the National Health Service. Adv Orthop 2022:2022:5962260. Crossref
13. Han PF, Chen CL, Zhang ZL, et al. Robotics-assisted versus conventional manual approaches for total hip arthroplasty: a systematic review and meta-analysis of comparative studies. Int J Med Robot 2019;15:e1990. Crossref
14. Kayani B, Konan S, Huq SS, Ibrahim MS, Ayuob A, Haddad FS. The learning curve of robotic-arm assisted acetabular cup positioning during total hip arthroplasty. Hip Int 2021;31:311-9. Crossref
15. Remily EA, Nabet A, Sax OC, Douglas SJ, Pervaiz SS, Delanois RE. Impact of robotic assisted surgery on outcomes in total hip arthroplasty. Arthroplast Today 2021;9:46-9. Crossref
16. Heng YY, Gunaratne R, Ironside C, Taheri A. Conventional vs robotic arm assisted total hip arthroplasty (THA) surgical time, transfusion rates, length of stay, complications and learning curve. J Arthritis 2018;7:1000272. Crossref
17. Bayer-Oglesby L, Zumbrunn A, Bachmann N; SIHOS Team. Social inequalities, length of hospital stay for chronic conditions and the mediating role of comorbidity and discharge destination: a multilevel analysis of hospital administrative data linked to the population census in Switzerland. PLoS One 2022;17:e0272265. Crossref
18. Shaw JH, Rahman TM, Wesemann LD, Jiang CZ, G Lindsay-Rivera K, Davis JJ. Comparison of postoperative instability and acetabular cup positioning in robotic-assisted versus traditional total hip arthroplasty. J Arthroplasty 2022;37(8S):S881-9. Crossref
19. Fu CH, Cheung YL, Cheung MH, et al. Robotic arm-assisted total hip replacement: early experience in Hong Kong. In: Proceedings of the 40th Annual Congress of the Hong Kong Orthopaedic Association; 2020 Oct 31-Nov 1; Hong Kong. Hong Kong: Hong Kong Academy of Medicine Press; 2020: 71. Available from: https://hub.hku.hk/handle/10722/305989. Accessed 12 Mar 2025.
20. Beverland DE, O’Neill CK, Rutherford M, Molloy D, Hill JC. Placement of the acetabular component. Bone Joint J 2016;98-B(1 Suppl A):37-43. Crossref
21. Kayani B, Konan S, Thakrar RR, Huq SS, Haddad FS. Assuring the long-term total joint arthroplasty: a triad of variables. Bone Joint J 2019;101-B(1_Supple_A):11-8. Crossref
22. Kayani B, Konan S, Ayuob A, Ayyad S, Haddad FS. The current role of robotics in total hip arthroplasty. EFORT Open Rev 2019;4:618-25. Crossref

Validation of diagnosis codes for pleural diseases and procedure codes for relevant respiratory procedures in a healthcare database in Hong Kong: a single tertiary centre study

Hong Kong Med J 2026 Feb;32(1):13–22 | Epub 30 Jan 2026
© Hong Kong Academy of Medicine. CC BY-NC-ND 4.0
 
ORIGINAL ARTICLE
Validation of diagnosis codes for pleural diseases and procedure codes for relevant respiratory procedures in a healthcare database in Hong Kong: a single tertiary centre study
Ken KP Chan, MB, ChB, FRCP1,2; Timothy CC Ng, BSc1; CY Sze, BSc1; KC Ling, MPH1; Christopher Chan, MB, ChB, MRCP1; Charlotte HY Lau, MB, ChB, MRCP1; Stephanie WT Ho, MB, ChB, MRCP1; Joyce KC Ng, MB, ChB, FHKCP1; Rachel LP Lo, MB, ChB, FHKCP1; WH Yip, MB, ChB, FHKCP1; Jenny CL Ngai, MB, ChB, FRCP1; KW To, MB, ChB, FRCP1; Fanny WS Ko, MD, FRCP1; David SC Hui, MD, FRCP1
1 Department of Medicine and Therapeutics, Faculty of Medicine, The Chinese University of Hong Kong, Hong Kong SAR, China
2 Li Ka Shing Institute of Health Sciences, Faculty of Medicine, The Chinese University of Hong Kong, Hong Kong SAR, China
 
Corresponding author: Prof David SC Hui (dschui@cuhk.edu.hk)
 
 Full paper in PDF
 
Abstract
Introduction: There are insufficient population-based epidemiological data on various pleural diseases in Hong Kong. We aimed to validate ICD-9-CM (International Classification of Diseases, Ninth Revision, Clinical Modification) codes for pleural diseases and relevant procedures prior to conducting epidemiological analyses using local electronic health records.
 
Methods: Hospitalisation episodes coded as ‘pneumothorax’, ‘pleural effusion’, and trauma-related pleural events, as well as procedures beginning with ICD-9-CM codes 33 and 34 between 2013 and 2022, were retrieved from the Hospital Authority. Paediatric patients and uninterrupted hospitalisation episodes were excluded. The cohort was filtered to include those hospitalised at Prince of Wales Hospital (PWH). Up to 50 hospitalisation episodes were randomly selected for manual validation. Positive predictive values (PPVs) with 95% confidence intervals of individual codes were calculated; successful validation was defined as a PPV ≥0.700. The primary endpoint was the PPV of individual diagnosis and procedure codes.
 
Results: A total of 26 757, 218 018, 1269, 185 154, and 106 450 hospitalisation episodes with non-traumatic pneumothorax, non-traumatic pleural effusion, trauma-related pleural events, procedures with code 33, and procedures with code 34, respectively, were retrieved. Within the PWH cohort, PPVs for these diagnosis and procedure codes were 0.853 (0.787-0.904), 0.928 (0.903-0.948), 0.957 (0.907-0.981), 0.932 (0.913-0.948), and 0.933 (0.916-0.948), respectively. Procedures involving indwelling pleural catheterisation and open drainage of the pleural cavity failed validation due to frequent miscoding.
 
Conclusion: This is the first validation study of clinical codes for pleural diseases and related procedures in Hong Kong. All diagnosis codes and most procedure codes were successfully validated.
 
 
New knowledge added by this study
  • This is the first validation study of clinical codes (International Classification of Diseases, Ninth Revision, Clinical Modification) for pleural diseases and relevant procedures in Hong Kong.
  • All diagnosis codes and most procedure codes were successfully validated.
  • Duplication of codes for similar diagnoses or procedures was identified.
Implications for clinical practice or policy
  • With the emergence of new respiratory procedures, diagnosis and procedure codes should be updated regularly.
  • Removal or consolidation of duplicated subcodes in the Hospital Authority system is necessary to facilitate accurate future research and analysis using clinical codes.
  • Researchers should be reminded to search all relevant diagnosis and procedure codes to minimise missing data when identifying specific diseases or procedures.
 
 
Introduction
Pleural diseases are common respiratory conditions that often require hospital admission and have shown an increasing incidence.1 2 In the United States, approximately 1.5 million patients experience pleural effusion annually, with most cases attributed to congestive heart failure, pneumonia, and cancer.3 4 A recent multicentre, cross-sectional study in China estimated the prevalence of pleural effusion at 4684 per 1 million Chinese adults.5 In that study, the most common causes were parapneumonic effusion and empyema (25.1%), malignant neoplasms (23.7%), and tuberculosis (12.3%).5 The median hospitalisation cost was ¥15 534.5 (interquartile range, 9447.2-29 000.0).5 Additionally, an increasing trend in admissions for spontaneous pneumothorax has been observed in England, highlighting the prevalence of the disease and its associated healthcare burden.2
 
Management of pleural diseases involves various diagnostic and therapeutic procedures that extend beyond the pleural space to include the airway and lung parenchyma. Whether closed or open, these procedures substantially contribute to the overall healthcare burden. However, information about pleural diseases and related respiratory procedures in Hong Kong remains limited, highlighting the need for contemporary, population-based epidemiological data.
 
The Hospital Authority, which provides healthcare services to over 90% of Hong Kong’s population, maintains extensive healthcare databases. These include the Clinical Management System (CMS) and the Clinical Data Analysis and Reporting System (CDARS), which capture a wide range of longitudinal clinical data. Examples include hospital discharge records, diagnosis and procedure codes for each hospitalisation episode, radiological findings, and laboratory parameters, particularly blood and pleural fluid analyses. This comprehensive dataset provides valuable insights into the burden of pleural diseases and accurately represents the local population.
 
Before analysing diseases and procedures using administrative data, it is essential to validate the accuracy of diagnosis and procedure codes within the healthcare database. These codes are typically entered by attending physicians, interventionists, or surgeons performing the procedures, which suggests a high degree of reliability. However, no prior local validation study has been conducted. Therefore, we aimed to assess whether diagnosis codes for pleural diseases and procedure codes for relevant respiratory procedures are accurately recorded for each hospitalisation episode within the Hospital Authority systems.
 
Methods
This retrospective, observational validation study of diagnosis and procedure codes utilised data from a territory-wide healthcare database in Hong Kong. Clinical data were obtained from CDARS, provided by the Hospital Authority. Hospitalisation episodes with the targeted diagnosis and procedure codes between 1 January 2013 and 31 December 2022 were retrieved from the system. Each observation represented a hospitalisation episode rather than a unique patient, and no patient recruitment was involved.
 
Diagnosis and procedure codes were defined using the International Classification of Diseases, Ninth Revision, Clinical Modification (ICD-9-CM). The basic format of an ICD-9-CM code consists of three to six digits. The Hospital Authority further extends these codes with additional characters after the decimal point to specify particular diagnoses or procedures within an ICD-9-CM code subgroup (‘subcodes’). These subcodes are displayed in CDARS but are not typically accessible to frontline CMS users. All hospitalisation episodes in acute hospitals with a discharge diagnosis code of pneumothorax (codes starting with 512), pleural effusion (codes starting with 012, 197.2, 220.4, 510, or 511), traumatic pneumothorax or haemothorax (trauma-related pleural events, codes starting with 860), or procedure codes for relevant respiratory procedures (codes starting with 33 or 34) were retrieved, regardless of their position in the coding list. Hospitalisation episodes for patients younger than 18 years old or from paediatric departments were excluded from subsequent validation analyses. Uninterrupted hospitalisation episodes following the index episodes, including those in acute or convalescent hospitals with the same diagnosis code of interest, were also excluded, as these may represent duplicate entries for the same clinical event. The remaining hospitalisation episodes after exclusions were grouped as the main cohort.
 
Manual verification of a proportion of the retrieved diagnosis and procedure codes, down to the subcode level, was conducted to ensure data accuracy. The main cohort was first filtered to include only hospitalisation episodes at the authors’ affiliated institution, Prince of Wales Hospital (PWH), forming the PWH cohort. A maximum of 50 hospitalisation episodes for each diagnosis or procedure code were randomly extracted from the PWH cohort to estimate the true positive predictive values (PPVs) within a 13% margin of error at a 95% confidence interval (95% CI). This precision level was chosen pragmatically to balance statistical rigour with the substantial manual effort required for chart review in this validation study. Prince of Wales Hospital is a tertiary care centre with a complex case mix, encompassing a wide range of pleural diseases and advanced respiratory procedures. Within the PWH cohort, the types of pleural disease (pleural effusion, pneumothorax, and trauma-related pleural events) and their underlying aetiologies (eg, non-tuberculous infection, tuberculosis, and malignancy) were determined through retrospective review of clinical notes, discharge summaries, radiological findings, and blood and pleural fluid analysis results using the CMS. Procedure codes were verified by reviewing procedure records within the corresponding hospitalisation episodes. All cases were independently reviewed by two board-certified respiratory physicians. Discrepancies were resolved through joint case review until consensus was reached. Coding accuracy was expressed as PPVs with 95% CIs. The PPV was calculated by dividing the number of true positives (ie, hospitalisation episodes in the PWH cohort where diagnosis and procedure codes were confirmed by manual verification) by the total number of true positives and false positives (ie, episodes where codes were rejected upon manual review). The 95% CI was calculated using the exact binomial method.
 
We hypothesised that the PPVs for the accuracy of diagnosis and procedure codes would be equal to or greater than 0.700, a commonly used threshold for successful validation.6 7 8 The primary endpoint was the determination of PPVs for the listed diagnosis and procedure codes. All statistical analyses were performed using Python (version 3.12.6).
 
Results
A total of 26 757 non-traumatic pneumothorax, 218 018 non-traumatic pleural effusion, and 1269 trauma-related pleural events were retrieved from CDARS between 2013 and 2022. Following the exclusion of paediatric patients and uninterrupted hospitalisation episodes, 20 888 non-traumatic pneumothorax, 199 323 non-traumatic pleural effusion, and 1127 trauma-related pleural events remained in the main cohort. Of these, 2451 (11.7%), 24 938 (12.5%), and 251 (22.3%) diagnosis codes for non-traumatic pneumothorax, non-traumatic pleural effusion, and trauma-related pleural events, respectively, were identified from PWH (Fig). Additionally, 185 154 and 106 450 relevant respiratory procedures with ICD-9-CM codes starting with 33 and 34, respectively, were retrieved. After exclusions, 181 770 and 101 336 procedure codes remained, of which 16 078 (8.8%) and 17 299 (17.1%) procedure codes, respectively, were identified from PWH (Fig). Tables 1, 2, and 3 list the diagnosis codes included in the validation analysis for non-traumatic pneumothorax (Table 1), non-traumatic pleural effusion (Table 2) and trauma-related pleural events (Table 3), while Tables 4 and 5 present the procedure codes starting with ‘33’ and ‘34’, respectively; the breakdown of hospitalisation episodes retrieved using these codes, and the numbers remaining after screening, are also shown.
 

Figure. Number of diagnosis and procedure codes identified, from retrieval in the Clinical Data Analysis and Reporting System to inclusion in the Prince of Wales Hospital cohort
 

Table 1. Diagnosis codes for non-traumatic pneumothorax included in the validation analysis
 

Table 2. Diagnosis codes for non-traumatic pleural effusion included in the validation analysis
 

Table 3. Diagnosis codes for trauma-related pleural events included in the validation analysis
 

Table 4. Procedure codes starting with 33 included in the validation analysis
 

Table 5. Procedure codes starting with 34 included in the validation analysis
 
The overall PPVs (95% CIs) for pneumothorax, pleural effusion, trauma-related pleural events, and all diagnosis codes were 0.853 (0.787-0.904), 0.928 (0.903-0.948), 0.957 (0.907-0.981), and 0.919 (0.898-0.936), respectively. The overall PPVs (95% CIs) for procedure codes starting with 33, starting with 34, and for all procedure codes were 0.932 (0.913-0.948), 0.933 (0.916-0.948), and 0.933 (0.920-0.944), respectively.
 
The PPVs for diagnosis codes related to pneumothorax, pleural effusion, and trauma-related pleural events were all equal to or greater than 0.700, with ranges of 0.700-1.000, 0.833-1.000, and 0.857-1.000, respectively. The lowest PPV (95% CI) was observed for postoperative pneumothorax (procedure code 512.1.2) at 0.700 (0.560-0.812). The highest PPVs were seen for iatrogenic pneumothorax (procedure code 512.1.0) and postoperative haemothorax (procedure code 511.8.7), both at 1.000, with 95% CIs of 0.933-1.000 and 0.762-1.000, respectively. The reasons for false-positive diagnosis codes are summarised in online supplementary Tables 1 to 3, with inappropriate coding of alternative diseases being the most common cause.
 
The PPVs for procedure codes starting with 33 ranged from 0.700 to 1.000. Procedure codes starting with 34 met the PPV benchmark, except for 34.04.3 (indwelling pleural catheterisation) and 34.09.3 (drainage of the pleural cavity, open). The reasons for false-positive procedure codes are listed in online supplementary Tables 4 and 5, with inappropriate coding of alternative but similar procedures being the most common cause. The low PPV for procedure code 34.04.3 (indwelling pleural catheterisation) arose from its misuse to represent non-tunnelled pleural catheter insertion, or to document the presence of an indwelling pleural catheter (IPC) inserted during prior hospitalisations. Procedure code 34.09.3 (drainage of the pleural cavity, open) failed to meet the PPV benchmark because it was misused to represent closed pleural drainage by drain insertion, rather than an open procedure.
 
Discussion
This study is the first to validate diagnosis and procedure codes for pleural diseases using a healthcare database in Hong Kong. All diagnosis codes for pleural diseases and the majority of procedure codes for relevant respiratory procedures met the PPV benchmark of 0.700 or higher. Only procedure codes 34.04.3 (indwelling pleural catheterisation) and 34.09.3 (drainage of the pleural cavity, open) failed to meet the validation criteria.
 
In 2008, the Hong Kong Thoracic Society reported the burden of lung disease in Hong Kong using local data from various governmental sources; however, pleural diseases were not included in the report.9 Over the subsequent decade, the incidence rates of individual pleural diseases were studied in Hong Kong. However, these studies were limited in scope as they focused on single pleural diseases (eg, empyema,10 11 12 malignant mesothelioma,13 and spontaneous pneumothorax14) or were restricted to single-centre settings.10 11
 
There is a pressing need for contemporary, population-based epidemiological data covering various pleural diseases in Hong Kong. A recent local survey highlighted heterogeneous practices in the management of pleural diseases among medical clinicians and reflected a lack of awareness and dedicated service infrastructure for pleural diseases.15 Given the rapid advancements in diagnostic strategies and therapeutic options for pleural diseases,16 an accurate and up-to-date assessment of their clinical burden is crucial. Such data provide a foundation for guiding future research, benchmarking healthcare standards in Hong Kong against those of other countries, informing the allocation of future healthcare resources for pleural diseases, and estimating the workload of healthcare professionals managing these conditions. All such service developments should be based on an accurate estimation of the current burden and projected future demand. The use of existing healthcare databases offers a practical approach; however, relevant diagnosis and procedure codes must first be validated. A similar research pathway was followed by Arnold et al,17 who validated diagnosis codes prior to assessing the epidemiology of pleural empyema in English hospitals.17 18
 
Nearly all PPVs of the diagnosis and procedure codes studied exceeded the benchmark of 0.700. Notably, PPVs for procedure codes were generally higher than those for diagnosis codes. This is because diagnosis codes can be carried over from previous hospitalisation episodes, enabling attending physicians to select active or inactive diagnosis codes regardless of their relevance to the current episode. In contrast, procedure codes cannot be carried over and must be entered manually to reflect procedures performed during the corresponding hospitalisation episode. This requirement contributes to the higher accuracy for procedure codes.
 
The PPV for procedure code 34.04.3 (indwelling pleural catheterisation) was unexpectedly low due to misuse. The absence of a specific diagnosis code indicating the presence of an IPC, combined with the inclusion of the term ‘pleural’ in the code description, contributed to its incorrect use, particularly during searches for non-tunnelled pleural catheter insertion. Updated diagnosis codes to indicate the status ‘presence of IPC’, or a new procedure code for ‘pleural fluid drainage using an existing IPC’, would accurately reflect the clinical scenario. Once available, such codes should be validated before any analyses of IPC use in territory-wide healthcare databases. Alternatively, establishing a clinical registry for IPC use could facilitate more accurate tracking of patients with both malignant and benign causes of pleural effusion.
 
Some diagnosis codes (eg, hydrothorax related to dialysis [511.8.3] and hydrothorax as complication of peritoneal dialysis [551.8.8]) and procedure codes (eg, video-assisted thoracoscopy for haemostasis [34.09.4] and injection into thoracic cavity [34.92.0]) were used in other hospitals but not at PWH; therefore, they could not be validated in this study. Within the PWH cohort, alternative diagnosis or procedure codes were used and validated. However, the number of hospitalisation episodes associated with these codes was small, and their impact would be minimal in a territory-wide healthcare data analysis where similar codes are grouped together.
 
Duplication of subcodes for similar diagnoses or procedures was also noted. Several diagnoses and procedures were represented by different codes, including:
  • Hydrothorax related to dialysis (511.8.3) and hydrothorax as complication of peritoneal dialysis (511.8.8);
  • Fibreoptic bronchoscopy (33.22.0) and bronchoscopy (33.23.0);
  • Endoscopic ultrasonography of bronchus (33.23.3) and endobronchial ultrasonography (33.23.5);
  • Closed endoscopic biopsy of bronchus (33.24.0), bronchoscopic biopsy (33.24.1), fibreoptic bronchoscopy with biopsy (33.24.2), and flexible bronchoscopy with biopsy of bronchus (33.24.7);
  • Lung biopsy via endoscopy (33.27.0), bronchoscopic biopsy under fluoroscopic guidance (33.27.1), and flexible bronchoscopy with biopsy of lung (33.27.2);
  • Video-assisted thoracoscopy for haemostasis (34.09.4) and video-assisted thoracoscopy, haemostasis (34.21.5); and
  • Chemical pleurodesis (34.92.1) and pleurodesis, chemical (34.92.2).
  •  
    Researchers should be reminded to search all relevant diagnosis and procedure codes to minimise the risk of missing data for specific diseases or procedures during code searches. In the long term, reconciling similar codes may help reduce ambiguity and improve data consistency.
     
    Strengths and limitations
    This study has several strengths, notably its status as the first validation study conducted using a large healthcare database in Hong Kong. It successfully validated codes for a wide range of pleural diseases and respiratory procedures, thereby laying the foundation for future epidemiological research. However, several limitations should be acknowledged. Not all codes could be adequately validated due to their small case volumes in the PWH cohort. For example, codes for Meigs’ syndrome (220.4), traumatic pneumothorax with open wound into thorax (860.1), and traumatic haemothorax with open wound into thorax (860.3) had small numbers even in the overall cohort, and some codes were duplicated. As such, future research incorporating patient searches based on these diagnosis and procedure codes should take these limitations into account. The single-centre nature of the study represents a further limitation, as disease patterns and coding practices may vary across district general hospitals.
     
    Conclusion
    This is the first validation study of diagnosis codes for pleural diseases and procedure codes for relevant respiratory procedures using a territory-wide healthcare database in Hong Kong. All diagnosis codes and the majority of procedure codes demonstrated high PPVs, indicating accurate coding. Given the emergence of new respiratory procedures, diagnosis and procedure codes should be regularly updated. The removal or consolidation of duplicated subcodes within the Hospital Authority system is also necessary to facilitate accurate future research and analysis using clinical codes. Further evaluation and harmonisation of coding practices across different hospitals would be beneficial. These measures will pave the way for future territory-wide studies and enable monitoring of the overall burden of pleural diseases in Hong Kong.
     
    Author contributions
    Concept or design: KKP Chan.
    Acquisition of data: KKP Chan, TCC Ng, CY Sze, KC Ling.
    Analysis or interpretation of data: KKP Chan, TCC Ng, CY Sze, KC Ling.
    Drafting of the manuscript: KKP Chan.
    Critical revision of the manuscript for important intellectual content: KKP Chan, TCC Ng, C Chan, CHY Lau, SWT Ho, JKC Ng, RLP Lo, WH Yip, JCL Ngai, KW To, FWS Ko, DSC Hui.
     
    All authors had full access to the data, contributed to the study, approved the final version for publication, and take responsibility for its accuracy and integrity.
     
    Conflicts of interest
    All authors have disclosed no conflicts of interest.
     
    Acknowledgement
    The authors thank Prof Terry CF Yip from the Department of Medicine and Therapeutics of The Chinese University of Hong Kong for providing statistical support.
     
    Funding/support
    This research received no specific grant from any funding agency in the public, commercial, or not-for-profit sectors.
     
    Ethics approval
    This research was approved by the Joint Chinese University of Hong Kong–New Territories East Cluster Clinical Research Ethics Committee, Hong Kong (Ref No.: 2022.031). The requirement for patient consent was waived by the Committee due to the retrospective nature of the study.
     
    Supplementary material
    The supplementary material was provided by the authors and some information may not have been peer reviewed. Accepted supplementary material will be published as submitted by the authors, without any editing or formatting. Any opinions or recommendations discussed are solely those of the author(s) and are not endorsed by the Hong Kong Academy of Medicine and the Hong Kong Medical Association. The Hong Kong Academy of Medicine and the Hong Kong Medical Association disclaim all liability and responsibility arising from any reliance placed on the content.
     
    References
    1. Bodtger U, Hallifax RJ. Epidemiology: why is pleural disease becoming more common? In: Maskell NA, Laursen CB, Lee YCG, et al, editors. Pleural Disease. Vol 87. Schweiz, Switzerland: European Respiratory Society; 2020: 1-12. Crossref
    2. Hallifax RJ, Goldacre R, Landray MJ, Rahman NM, Goldacre MJ. Trends in the incidence and recurrence of inpatient-treated spontaneous pneumothorax, 1968-2016. JAMA 2018;320:1471-80. Crossref
    3. Light RW. Pleural effusions. Med Clin North Am 2011;95:1055-70. Crossref
    4. Taghizadeh N, Fortin M, Tremblay A. US hospitalizations for malignant pleural effusions: data from the 2012 National Inpatient Sample. Chest 2017;151:845-54. Crossref
    5. Tian P, Qiu R, Wang M, et al. Prevalence, causes, and health care burden of pleural effusions among hospitalized adults in China. JAMA Netw Open 2021;4:e2120306. Crossref
    6. Kwok WC, Tam TC, Sing CW, Chan EW, Cheung CL. Validation of diagnostic coding for bronchiectasis in an electronic health record system in Hong Kong. Pharmacoepidemiol Drug Saf 2023;32:1077-82. Crossref
    7. Ye Y, Hubbard R, Li GH, et al. Validation of diagnostic coding for interstitial lung diseases in an electronic health record system in Hong Kong. Pharmacoepidemiol Drug Saf 2022;31:519-23. Crossref
    8. Kwok WC, Tam TC, Sing CW, Chan EW, Cheung CL. Validation of diagnostic coding for asthma in an electronic health record system in Hong Kong. J Asthma Allergy 2023;16:315-21. Crossref
    9. Chan-Yeung M, Lai CK, Chan KS, et al. The burden of lung disease in Hong Kong: a report from the Hong Kong Thoracic Society. Respirology 2008;13 Suppl 4:S133-65. Crossref
    10. Chan KP, Ng SS, Ling KC, et al. Phenotyping empyema by pleural fluid culture results and macroscopic appearance: an 8-year retrospective study. ERJ Open Res 2023;9:00534-2022. Crossref
    11. Tsang KY, Leung WS, Chan VL, Lin AW, Chu CM. Complicated parapneumonic effusion and empyema thoracis: microbiology and predictors of adverse outcomes. Hong Kong Med J 2007;13:178-86.
    12. Chan KP, Ma TF, Sridhar S, Lam DC, Ip MS, Ho PL. Changes in etiology and clinical outcomes of pleural empyema during the COVID-19 pandemic. Microorganisms 2023;11:303. Crossref
    13. Chang KC, Leung CC, Tam CM, Yu WC, Hui DS, Lam WK. Malignant mesothelioma in Hong Kong. Respir Med 2006;100:75-82. Crossref
    14. Chan JW, Ko FW, Ng CK, et al. Management and prevention of spontaneous pneumothorax using pleurodesis in Hong Kong. Int J Tuberc Lung Dis 2011;15:385-90.
    15. Lui MM, Yeung YC, Ngai JC, et al. Implementation of evidence on management of pleural diseases: insights from a territory-wide survey of clinicians in Hong Kong. BMC Pulm Med 2022;22:386. Crossref
    16. Lui MM, Lee YC. Twenty-five years of respirology: advances in pleural disease. Respirology 2020;25:38-40. Crossref
    17. Arnold DT, Hamilton FW, Morris TT, et al. Epidemiology of pleural empyema in English hospitals and the impact of influenza. Eur Respir J 2021;57:2003546. Crossref
    18. Hamilton F, Arnold D. Accuracy of clinical coding of pleural empyema: a validation study. J Eval Clin Pract 2020;26:79-80. Crossref

    Clone of Validation of diagnosis codes for pleural diseases and procedure codes for relevant respiratory procedures in a healthcare database in Hong Kong: a single tertiary centre study

    Hong Kong Med J 2026;32:Epub 30 Jan 2026
    © Hong Kong Academy of Medicine. CC BY-NC-ND 4.0
     
    ORIGINAL ARTICLE
    Validation of diagnosis codes for pleural diseases and procedure codes for relevant respiratory procedures in a healthcare database in Hong Kong: a single tertiary centre study
    Ken KP Chan, MB, ChB, FRCP1,2; Timothy CC Ng, BSc1; CY Sze, BSc1; KC Ling, MPH1; Christopher Chan, MB, ChB, MRCP1; Charlotte HY Lau, MB, ChB, MRCP1; Stephanie WT Ho, MB, ChB, MRCP1; Joyce KC Ng, MB, ChB, FHKCP1; Rachel LP Lo, MB, ChB, FHKCP1; WH Yip, MB, ChB, FHKCP1; Jenny CL Ngai, MB, ChB, FRCP1; KW To, MB, ChB, FRCP1; Fanny WS Ko, MD, FRCP1; David SC Hui, MD, FRCP1
    1 Department of Medicine and Therapeutics, Faculty of Medicine, The Chinese University of Hong Kong, Hong Kong SAR, China
    2 Li Ka Shing Institute of Health Sciences, Faculty of Medicine, The Chinese University of Hong Kong, Hong Kong SAR, China
     
    Corresponding author: Prof David SC Hui (dschui@cuhk.edu.hk)
     
     Full paper in PDF
     
    Abstract
    Introduction: There are insufficient population-based epidemiological data on various pleural diseases in Hong Kong. We aimed to validate ICD-9-CM (International Classification of Diseases, Ninth Revision, Clinical Modification) codes for pleural diseases and relevant procedures prior to conducting epidemiological analyses using local electronic health records.
     
    Methods: Hospitalisation episodes coded as ‘pneumothorax’, ‘pleural effusion’, and trauma-related pleural events, as well as procedures beginning with ICD-9-CM codes 33 and 34 between 2013 and 2022, were retrieved from the Hospital Authority. Paediatric patients and uninterrupted hospitalisation episodes were excluded. The cohort was filtered to include those hospitalised at Prince of Wales Hospital (PWH). Up to 50 hospitalisation episodes were randomly selected for manual validation. Positive predictive values (PPVs) with 95% confidence intervals of individual codes were calculated; successful validation was defined as a PPV ≥0.700. The primary endpoint was the PPV of individual diagnosis and procedure codes.
     
    Results: A total of 26 757, 218 018, 1269, 185 154, and 106 450 hospitalisation episodes with non-traumatic pneumothorax, non-traumatic pleural effusion, trauma-related pleural events, procedures with code 33, and procedures with code 34, respectively, were retrieved. Within the PWH cohort, PPVs for these diagnosis and procedure codes were 0.853 (0.787-0.904), 0.928 (0.903-0.948), 0.957 (0.907-0.981), 0.932 (0.913-0.948), and 0.933 (0.916-0.948), respectively. Procedures involving indwelling pleural catheterisation and open drainage of the pleural cavity failed validation due to frequent miscoding.
     
    Conclusion: This is the first validation study of clinical codes for pleural diseases and related procedures in Hong Kong. All diagnosis codes and most procedure codes were successfully validated.
     
     
    New knowledge added by this study
    • This is the first validation study of clinical codes (International Classification of Diseases, Ninth Revision, Clinical Modification) for pleural diseases and relevant procedures in Hong Kong.
    • All diagnosis codes and most procedure codes were successfully validated.
    • Duplication of codes for similar diagnoses or procedures was identified.
    Implications for clinical practice or policy
    • With the emergence of new respiratory procedures, diagnosis and procedure codes should be updated regularly.
    • Removal or consolidation of duplicated subcodes in the Hospital Authority system is necessary to facilitate accurate future research and analysis using clinical codes.
    • Researchers should be reminded to search all relevant diagnosis and procedure codes to minimise missing data when identifying specific diseases or procedures.
     
     
    Introduction
    Pleural diseases are common respiratory conditions that often require hospital admission and have shown an increasing incidence.1 2 In the United States, approximately 1.5 million patients experience pleural effusion annually, with most cases attributed to congestive heart failure, pneumonia, and cancer.3 4 A recent multicentre, cross-sectional study in China estimated the prevalence of pleural effusion at 4684 per 1 million Chinese adults.5 In that study, the most common causes were parapneumonic effusion and empyema (25.1%), malignant neoplasms (23.7%), and tuberculosis (12.3%).5 The median hospitalisation cost was ¥15 534.5 (interquartile range, 9447.2-29 000.0).5 Additionally, an increasing trend in admissions for spontaneous pneumothorax has been observed in England, highlighting the prevalence of the disease and its associated healthcare burden.2
     
    Management of pleural diseases involves various diagnostic and therapeutic procedures that extend beyond the pleural space to include the airway and lung parenchyma. Whether closed or open, these procedures substantially contribute to the overall healthcare burden. However, information about pleural diseases and related respiratory procedures in Hong Kong remains limited, highlighting the need for contemporary, population-based epidemiological data.
     
    The Hospital Authority, which provides healthcare services to over 90% of Hong Kong’s population, maintains extensive healthcare databases. These include the Clinical Management System (CMS) and the Clinical Data Analysis and Reporting System (CDARS), which capture a wide range of longitudinal clinical data. Examples include hospital discharge records, diagnosis and procedure codes for each hospitalisation episode, radiological findings, and laboratory parameters, particularly blood and pleural fluid analyses. This comprehensive dataset provides valuable insights into the burden of pleural diseases and accurately represents the local population.
     
    Before analysing diseases and procedures using administrative data, it is essential to validate the accuracy of diagnosis and procedure codes within the healthcare database. These codes are typically entered by attending physicians, interventionists, or surgeons performing the procedures, which suggests a high degree of reliability. However, no prior local validation study has been conducted. Therefore, we aimed to assess whether diagnosis codes for pleural diseases and procedure codes for relevant respiratory procedures are accurately recorded for each hospitalisation episode within the Hospital Authority systems.
     
    Methods
    This retrospective, observational validation study of diagnosis and procedure codes utilised data from a territory-wide healthcare database in Hong Kong. Clinical data were obtained from CDARS, provided by the Hospital Authority. Hospitalisation episodes with the targeted diagnosis and procedure codes between 1 January 2013 and 31 December 2022 were retrieved from the system. Each observation represented a hospitalisation episode rather than a unique patient, and no patient recruitment was involved.
     
    Diagnosis and procedure codes were defined using the International Classification of Diseases, Ninth Revision, Clinical Modification (ICD-9-CM). The basic format of an ICD-9-CM code consists of three to six digits. The Hospital Authority further extends these codes with additional characters after the decimal point to specify particular diagnoses or procedures within an ICD-9-CM code subgroup (‘subcodes’). These subcodes are displayed in CDARS but are not typically accessible to frontline CMS users. All hospitalisation episodes in acute hospitals with a discharge diagnosis code of pneumothorax (codes starting with 512), pleural effusion (codes starting with 012, 197.2, 220.4, 510, or 511), traumatic pneumothorax or haemothorax (trauma-related pleural events, codes starting with 860), or procedure codes for relevant respiratory procedures (codes starting with 33 or 34) were retrieved, regardless of their position in the coding list. Hospitalisation episodes for patients younger than 18 years old or from paediatric departments were excluded from subsequent validation analyses. Uninterrupted hospitalisation episodes following the index episodes, including those in acute or convalescent hospitals with the same diagnosis code of interest, were also excluded, as these may represent duplicate entries for the same clinical event. The remaining hospitalisation episodes after exclusions were grouped as the main cohort.
     
    Manual verification of a proportion of the retrieved diagnosis and procedure codes, down to the subcode level, was conducted to ensure data accuracy. The main cohort was first filtered to include only hospitalisation episodes at the authors’ affiliated institution, Prince of Wales Hospital (PWH), forming the PWH cohort. A maximum of 50 hospitalisation episodes for each diagnosis or procedure code were randomly extracted from the PWH cohort to estimate the true positive predictive values (PPVs) within a 13% margin of error at a 95% confidence interval (95% CI). This precision level was chosen pragmatically to balance statistical rigour with the substantial manual effort required for chart review in this validation study. Prince of Wales Hospital is a tertiary care centre with a complex case mix, encompassing a wide range of pleural diseases and advanced respiratory procedures. Within the PWH cohort, the types of pleural disease (pleural effusion, pneumothorax, and trauma-related pleural events) and their underlying aetiologies (eg, non-tuberculous infection, tuberculosis, and malignancy) were determined through retrospective review of clinical notes, discharge summaries, radiological findings, and blood and pleural fluid analysis results using the CMS. Procedure codes were verified by reviewing procedure records within the corresponding hospitalisation episodes. All cases were independently reviewed by two board-certified respiratory physicians. Discrepancies were resolved through joint case review until consensus was reached. Coding accuracy was expressed as PPVs with 95% CIs. The PPV was calculated by dividing the number of true positives (ie, hospitalisation episodes in the PWH cohort where diagnosis and procedure codes were confirmed by manual verification) by the total number of true positives and false positives (ie, episodes where codes were rejected upon manual review). The 95% CI was calculated using the exact binomial method.
     
    We hypothesised that the PPVs for the accuracy of diagnosis and procedure codes would be equal to or greater than 0.700, a commonly used threshold for successful validation.6 7 8 The primary endpoint was the determination of PPVs for the listed diagnosis and procedure codes. All statistical analyses were performed using Python (version 3.12.6).
     
    Results
    A total of 26 757 non-traumatic pneumothorax, 218 018 non-traumatic pleural effusion, and 1269 trauma-related pleural events were retrieved from CDARS between 2013 and 2022. Following the exclusion of paediatric patients and uninterrupted hospitalisation episodes, 20 888 non-traumatic pneumothorax, 199 323 non-traumatic pleural effusion, and 1127 trauma-related pleural events remained in the main cohort. Of these, 2451 (11.7%), 24 938 (12.5%), and 251 (22.3%) diagnosis codes for non-traumatic pneumothorax, non-traumatic pleural effusion, and trauma-related pleural events, respectively, were identified from PWH (Fig). Additionally, 185 154 and 106 450 relevant respiratory procedures with ICD-9-CM codes starting with 33 and 34, respectively, were retrieved. After exclusions, 181 770 and 101 336 procedure codes remained, of which 16 078 (8.8%) and 17 299 (17.1%) procedure codes, respectively, were identified from PWH (Fig). Tables 1, 2, and 3 list the diagnosis codes included in the validation analysis for non-traumatic pneumothorax (Table 1), non-traumatic pleural effusion (Table 2) and trauma-related pleural events (Table 3), while Tables 4 and 5 present the procedure codes starting with ‘33’ and ‘34’, respectively; the breakdown of hospitalisation episodes retrieved using these codes, and the numbers remaining after screening, are also shown.
     

    Figure. Number of diagnosis and procedure codes identified, from retrieval in the Clinical Data Analysis and Reporting System to inclusion in the Prince of Wales Hospital cohort
     

    Table 1. Diagnosis codes for non-traumatic pneumothorax included in the validation analysis
     

    Table 2. Diagnosis codes for non-traumatic pleural effusion included in the validation analysis
     

    Table 3. Diagnosis codes for trauma-related pleural events included in the validation analysis
     

    Table 4. Procedure codes starting with ‘33’ included in the validation analysis
     

    Table 5. Procedure codes starting with ‘34’ included in the validation analysis
     
    The overall PPVs (95% CIs) for pneumothorax, pleural effusion, trauma-related pleural events, and all diagnosis codes were 0.853 (0.787-0.904), 0.928 (0.903-0.948), 0.957 (0.907-0.981), and 0.919 (0.898-0.936), respectively. The overall PPVs (95% CIs) for procedure codes starting with 33, starting with 34, and for all procedure codes were 0.932 (0.913-0.948), 0.933 (0.916-0.948), and 0.933 (0.920-0.944), respectively.
     
    The PPVs for diagnosis codes related to pneumothorax, pleural effusion, and trauma-related pleural events were all equal to or greater than 0.700, with ranges of 0.700-1.000, 0.833-1.000, and 0.857-1.000, respectively. The lowest PPV (95% CI) was observed for postoperative pneumothorax (procedure code 512.1.2) at 0.700 (0.560-0.812). The highest PPVs were seen for iatrogenic pneumothorax (procedure code 512.1.0) and postoperative haemothorax (procedure code 511.8.7), both at 1.000, with 95% CIs of 0.933-1.000 and 0.762-1.000, respectively. The reasons for false-positive diagnosis codes are summarised in online supplementary Tables 1 to 3, with inappropriate coding of alternative diseases being the most common cause.
     
    The PPVs for procedure codes starting with 33 ranged from 0.700 to 1.000. Procedure codes starting with 34 met the PPV benchmark, except for 34.04.3 (indwelling pleural catheterisation) and 34.09.3 (drainage of the pleural cavity, open). The reasons for false-positive procedure codes are listed in online supplementary Tables 4 and 5, with inappropriate coding of alternative but similar procedures being the most common cause. The low PPV for procedure code 34.04.3 (indwelling pleural catheterisation) arose from its misuse to represent non-tunnelled pleural catheter insertion, or to document the presence of an indwelling pleural catheter (IPC) inserted during prior hospitalisations. Procedure code 34.09.3 (drainage of the pleural cavity, open) failed to meet the PPV benchmark because it was misused to represent closed pleural drainage by drain insertion, rather than an open procedure.
     
    Discussion
    This study is the first to validate diagnosis and procedure codes for pleural diseases using a healthcare database in Hong Kong. All diagnosis codes for pleural diseases and the majority of procedure codes for relevant respiratory procedures met the PPV benchmark of 0.700 or higher. Only procedure codes 34.04.3 (indwelling pleural catheterisation) and 34.09.3 (drainage of the pleural cavity, open) failed to meet the validation criteria.
     
    In 2008, the Hong Kong Thoracic Society reported the burden of lung disease in Hong Kong using local data from various governmental sources; however, pleural diseases were not included in the report.9 Over the subsequent decade, the incidence rates of individual pleural diseases were studied in Hong Kong. However, these studies were limited in scope as they focused on single pleural diseases (eg, empyema,10 11 12 malignant mesothelioma,13 and spontaneous pneumothorax14) or were restricted to single-centre settings.10 11
     
    There is a pressing need for contemporary, population-based epidemiological data covering various pleural diseases in Hong Kong. A recent local survey highlighted heterogeneous practices in the management of pleural diseases among medical clinicians and reflected a lack of awareness and dedicated service infrastructure for pleural diseases.15 Given the rapid advancements in diagnostic strategies and therapeutic options for pleural diseases,16 an accurate and up-to-date assessment of their clinical burden is crucial. Such data provide a foundation for guiding future research, benchmarking healthcare standards in Hong Kong against those of other countries, informing the allocation of future healthcare resources for pleural diseases, and estimating the workload of healthcare professionals managing these conditions. All such service developments should be based on an accurate estimation of the current burden and projected future demand. The use of existing healthcare databases offers a practical approach; however, relevant diagnosis and procedure codes must first be validated. A similar research pathway was followed by Arnold et al,17 who validated diagnosis codes prior to assessing the epidemiology of pleural empyema in English hospitals.17 18
     
    Nearly all PPVs of the diagnosis and procedure codes studied exceeded the benchmark of 0.700. Notably, PPVs for procedure codes were generally higher than those for diagnosis codes. This is because diagnosis codes can be carried over from previous hospitalisation episodes, enabling attending physicians to select active or inactive diagnosis codes regardless of their relevance to the current episode. In contrast, procedure codes cannot be carried over and must be entered manually to reflect procedures performed during the corresponding hospitalisation episode. This requirement contributes to the higher accuracy for procedure codes.
     
    The PPV for procedure code 34.04.3 (indwelling pleural catheterisation) was unexpectedly low due to misuse. The absence of a specific diagnosis code indicating the presence of an IPC, combined with the inclusion of the term ‘pleural’ in the code description, contributed to its incorrect use, particularly during searches for non-tunnelled pleural catheter insertion. Updated diagnosis codes to indicate the status ‘presence of IPC’, or a new procedure code for ‘pleural fluid drainage using an existing IPC’, would accurately reflect the clinical scenario. Once available, such codes should be validated before any analyses of IPC use in territory-wide healthcare databases. Alternatively, establishing a clinical registry for IPC use could facilitate more accurate tracking of patients with both malignant and benign causes of pleural effusion.
     
    Some diagnosis codes (eg, hydrothorax related to dialysis [511.8.3] and hydrothorax as complication of peritoneal dialysis [551.8.8]) and procedure codes (eg, video-assisted thoracoscopy for haemostasis [34.09.4] and injection into thoracic cavity [34.92.0]) were used in other hospitals but not at PWH; therefore, they could not be validated in this study. Within the PWH cohort, alternative diagnosis or procedure codes were used and validated. However, the number of hospitalisation episodes associated with these codes was small, and their impact would be minimal in a territory-wide healthcare data analysis where similar codes are grouped together.
     
    Duplication of subcodes for similar diagnoses or procedures was also noted. Several diagnoses and procedures were represented by different codes, including:
  • Hydrothorax related to dialysis (511.8.3) and hydrothorax as complication of peritoneal dialysis (511.8.8);
  • Fibreoptic bronchoscopy (33.22.0) and bronchoscopy (33.23.0);
  • Endoscopic ultrasonography of bronchus (33.23.3) and endobronchial ultrasonography (33.23.5);
  • Closed endoscopic biopsy of bronchus (33.24.0), bronchoscopic biopsy (33.24.1), fibreoptic bronchoscopy with biopsy (33.24.2), and flexible bronchoscopy with biopsy of bronchus (33.24.7);
  • Lung biopsy via endoscopy (33.27.0), bronchoscopic biopsy under fluoroscopic guidance (33.27.1), and flexible bronchoscopy with biopsy of lung (33.27.2);
  • Video-assisted thoracoscopy for haemostasis (34.09.4) and video-assisted thoracoscopy, haemostasis (34.21.5); and
  • Chemical pleurodesis (34.92.1) and pleurodesis, chemical (34.92.2).
  •  
    Researchers should be reminded to search all relevant diagnosis and procedure codes to minimise the risk of missing data for specific diseases or procedures during code searches. In the long term, reconciling similar codes may help reduce ambiguity and improve data consistency.
     
    Strengths and limitations
    This study has several strengths, notably its status as the first validation study conducted using a large healthcare database in Hong Kong. It successfully validated codes for a wide range of pleural diseases and respiratory procedures, thereby laying the foundation for future epidemiological research. However, several limitations should be acknowledged. Not all codes could be adequately validated due to their small case volumes in the PWH cohort. For example, codes for Meigs’ syndrome (220.4), traumatic pneumothorax with open wound into thorax (860.1), and traumatic haemothorax with open wound into thorax (860.3) had small numbers even in the overall cohort, and some codes were duplicated. As such, future research incorporating patient searches based on these diagnosis and procedure codes should take these limitations into account. The single-centre nature of the study represents a further limitation, as disease patterns and coding practices may vary across district general hospitals.
     
    Conclusion
    This is the first validation study of diagnosis codes for pleural diseases and procedure codes for relevant respiratory procedures using a territory-wide healthcare database in Hong Kong. All diagnosis codes and the majority of procedure codes demonstrated high PPVs, indicating accurate coding. Given the emergence of new respiratory procedures, diagnosis and procedure codes should be regularly updated. The removal or consolidation of duplicated subcodes within the Hospital Authority system is also necessary to facilitate accurate future research and analysis using clinical codes. Further evaluation and harmonisation of coding practices across different hospitals would be beneficial. These measures will pave the way for future territory-wide studies and enable monitoring of the overall burden of pleural diseases in Hong Kong.
     
    Author contributions
    Concept or design: KKP Chan.
    Acquisition of data: KKP Chan, TCC Ng, CY Sze, KC Ling.
    Analysis or interpretation of data: KKP Chan, TCC Ng, CY Sze, KC Ling.
    Drafting of the manuscript: KKP Chan.
    Critical revision of the manuscript for important intellectual content: KKP Chan, TCC Ng, C Chan, CHY Lau, SWT Ho, JKC Ng, RLP Lo, WH Yip, JCL Ngai, KW To, FWS Ko, DSC Hui.
     
    All authors had full access to the data, contributed to the study, approved the final version for publication, and take responsibility for its accuracy and integrity.
     
    Conflicts of interest
    All authors have disclosed no conflicts of interest.
     
    Acknowledgement
    The authors thank Prof Terry CF Yip from the Department of Medicine and Therapeutics of The Chinese University of Hong Kong for providing statistical support.
     
    Funding/support
    This research received no specific grant from any funding agency in the public, commercial, or not-for-profit sectors.
     
    Ethics approval
    This research was approved by the Joint Chinese University of Hong Kong–New Territories East Cluster Clinical Research Ethics Committee, Hong Kong (Ref No.: 2022.031). The requirement for patient consent was waived by the Committee due to the retrospective nature of the study.
     
    Supplementary material
    The supplementary material was provided by the authors and some information may not have been peer reviewed. Accepted supplementary material will be published as submitted by the authors, without any editing or formatting. Any opinions or recommendations discussed are solely those of the author(s) and are not endorsed by the Hong Kong Academy of Medicine and the Hong Kong Medical Association. The Hong Kong Academy of Medicine and the Hong Kong Medical Association disclaim all liability and responsibility arising from any reliance placed on the content.
     
    References
    1. Bodtger U, Hallifax RJ. Epidemiology: why is pleural disease becoming more common? In: Maskell NA, Laursen CB, Lee YCG, et al, editors. Pleural Disease. Vol 87. Schweiz, Switzerland: European Respiratory Society; 2020: 1-12. Crossref
    2. Hallifax RJ, Goldacre R, Landray MJ, Rahman NM, Goldacre MJ. Trends in the incidence and recurrence of inpatient-treated spontaneous pneumothorax, 1968-2016. JAMA 2018;320:1471-80. Crossref
    3. Light RW. Pleural effusions. Med Clin North Am 2011;95:1055-70. Crossref
    4. Taghizadeh N, Fortin M, Tremblay A. US hospitalizations for malignant pleural effusions: data from the 2012 National Inpatient Sample. Chest 2017;151:845-54. Crossref
    5. Tian P, Qiu R, Wang M, et al. Prevalence, causes, and health care burden of pleural effusions among hospitalized adults in China. JAMA Netw Open 2021;4:e2120306. Crossref
    6. Kwok WC, Tam TC, Sing CW, Chan EW, Cheung CL. Validation of diagnostic coding for bronchiectasis in an electronic health record system in Hong Kong. Pharmacoepidemiol Drug Saf 2023;32:1077-82. Crossref
    7. Ye Y, Hubbard R, Li GH, et al. Validation of diagnostic coding for interstitial lung diseases in an electronic health record system in Hong Kong. Pharmacoepidemiol Drug Saf 2022;31:519-23. Crossref
    8. Kwok WC, Tam TC, Sing CW, Chan EW, Cheung CL. Validation of diagnostic coding for asthma in an electronic health record system in Hong Kong. J Asthma Allergy 2023;16:315-21. Crossref
    9. Chan-Yeung M, Lai CK, Chan KS, et al. The burden of lung disease in Hong Kong: a report from the Hong Kong Thoracic Society. Respirology 2008;13 Suppl 4:S133-65. Crossref
    10. Chan KP, Ng SS, Ling KC, et al. Phenotyping empyema by pleural fluid culture results and macroscopic appearance: an 8-year retrospective study. ERJ Open Res 2023;9:00534-2022. Crossref
    11. Tsang KY, Leung WS, Chan VL, Lin AW, Chu CM. Complicated parapneumonic effusion and empyema thoracis: microbiology and predictors of adverse outcomes. Hong Kong Med J 2007;13:178-86.
    12. Chan KP, Ma TF, Sridhar S, Lam DC, Ip MS, Ho PL. Changes in etiology and clinical outcomes of pleural empyema during the COVID-19 pandemic. Microorganisms 2023;11:303. Crossref
    13. Chang KC, Leung CC, Tam CM, Yu WC, Hui DS, Lam WK. Malignant mesothelioma in Hong Kong. Respir Med 2006;100:75-82. Crossref
    14. Chan JW, Ko FW, Ng CK, et al. Management and prevention of spontaneous pneumothorax using pleurodesis in Hong Kong. Int J Tuberc Lung Dis 2011;15:385-90.
    15. Lui MM, Yeung YC, Ngai JC, et al. Implementation of evidence on management of pleural diseases: insights from a territory-wide survey of clinicians in Hong Kong. BMC Pulm Med 2022;22:386. Crossref
    16. Lui MM, Lee YC. Twenty-five years of respirology: advances in pleural disease. Respirology 2020;25:38-40. Crossref
    17. Arnold DT, Hamilton FW, Morris TT, et al. Epidemiology of pleural empyema in English hospitals and the impact of influenza. Eur Respir J 2021;57:2003546. Crossref
    18. Hamilton F, Arnold D. Accuracy of clinical coding of pleural empyema: a validation study. J Eval Clin Pract 2020;26:79-80. Crossref

    A ten-year evaluation of the incidence of obstetric anal sphincter injury with a reduced episiotomy rate

    Hong Kong Med J 2026 Feb;32(1):6–12 | Epub 30 Jan 2026
    © Hong Kong Academy of Medicine. CC BY-NC-ND 4.0
     
    ORIGINAL ARTICLE  CME
    A ten-year evaluation of the incidence of obstetric anal sphincter injury with a reduced episiotomy rate
    YY Lau, MB, ChB, MRCOG; TW Chau, MB, ChB; WC Tang, MB, BS; Rachel YK Cheung, MD, FHKAM (Obstetrics and Gynaecology); SM Ng, MSc; TM Tso, BN, MSc; Symphorosa SC Chan, MD, FHKAM (Obstetrics and Gynaecology)
    Department of Obstetrics and Gynaecology, The Chinese University of Hong Kong, Hong Kong SAR, China
     
    Corresponding author: Dr YY Lau (yanyanlau@cuhk.edu.hk)
     
     Full paper in PDF
     
    Abstract
    Introduction: The role of episiotomy in preventing obstetric anal sphincter injury (OASIS) remains controversial. Liberal use of episiotomy has been reduced locally. This study aimed to review the incidence of OASIS in our unit over the past decade given the reduced episiotomy rate.
     
    Methods: A retrospective study was conducted in a single tertiary obstetrics and gynaecology unit. All singleton vaginal deliveries, including normal and instrumental deliveries, between 2012 and 2021 were included. Data were retrieved from the hospital electronic delivery database between July 2022 and June 2023. The degree of OASIS was assessed using the Abdul Sultan classification.
     
    Results: In total, 43 732 deliveries were included. The episiotomy rate decreased from 62.8% in 2012 to 44.7% in 2021 (P<0.001), while the OASIS rate increased from 0.3% to 1.4% over the same period (P<0.001). Among nulliparous women, the OASIS rate was significantly lower with episiotomy in both normal vaginal deliveries (0.6% vs 1.7%; P<0.001) and instrumental deliveries with episiotomy than without (1.7% vs 42.9%; P<0.001). Among multiparous women, the OASIS rate was significantly lower in normal vaginal deliveries without episiotomy than with (0.3% vs 0.5%; P=0.026), while in instrumental deliveries, the rate was significantly lower with episiotomy than without (0.5% vs 23.5%; P<0.001). Overall, episiotomy was a protective factor for OASIS (odds ratio=0.273, 95% confidence interval= 0.208-0.358; P<0.001).
     
    Conclusion: Episiotomy was protective against OASIS among nulliparous women with singleton normal vaginal delivery and instrumental delivery in an Asian population. It also conferred protection among multiparous women undergoing instrumental delivery but not in those having normal vaginal delivery.
     
     
    New knowledge added by this study
    • Episiotomy is a protective factor against obstetric anal sphincter injury (OASIS) among nulliparous women undergoing singleton normal vaginal delivery and instrumental delivery in an Asian population.
    • Episiotomy also confers protection against OASIS among multiparous women undergoing instrumental delivery in an Asian population.
    • Conversely, episiotomy may increase the risk of OASIS in multiparous women undergoing normal vaginal delivery.
    Implications for clinical practice or policy
    • It is recommended that women should be informed of these findings to support informed decision-making regarding episiotomy.
    • A more restrictive approach should be adopted in multiparous women undergoing normal vaginal delivery.
     
     
    Introduction
    Obstetric anal sphincter injury (OASIS) is a serious complication of vaginal delivery that can result in faecal incontinence, thereby impairing women’s quality of life. Reported prevalence rates of OASIS range from less than 1% to 11%.1 2 3 In the United Kingdom, the incidence tripled from 1.8% to 5.9% between 2000 and 2012, presumably due to improved detection techniques and increased awareness.4 In Hong Kong, the incidence increased from 0.04% in 2004 to 0.1% in 2009, and to 0.3% in 2014 during normal vaginal deliveries.5 Episiotomy, commonly performed during the second stage of labour to facilitate delivery and prevent excessive stretching of the perineal muscles, may increase intrapartum blood loss and perineal pain.6 The role of episiotomy in mitigating OASIS remains controversial.7 8 Consequently, the liberal use of episiotomy has declined in Hong Kong, with rates falling from 81% in 2004 to 66.2% in 2009 and 47.4% in 2014.5 Ethnic differences in pelvic floor biometry and pelvic organ mobility have been reported,8 9 and studies suggest that Asian women are more prone to OASIS.10 11 This study aimed to review the incidence of OASIS in our unit over the past decade in the context of declining episiotomy rates.
     
    Methods
    This study was conducted in Prince of Wales Hospital, a tertiary obstetrics and gynaecology unit with an annual delivery volume of approximately 4500 to 6000. All singleton vaginal deliveries—including spontaneous vaginal, ventouse, or forceps deliveries—between 1 January 2012 and 31 December 2021 were included. Breech and preterm deliveries were excluded. Maternal demographics were entered into the electronic record either antenatally by midwives or obstetricians if women had received antenatal care in our unit, or by midwives immediately after delivery. Maternal age and body mass index (BMI) were recorded at delivery. Macrosomia was defined as a birth weight of ≥4000 g. Most spontaneous vaginal deliveries were conducted by trained midwives or student midwives under supervision; instrumental deliveries were performed by trained obstetricians or trainees under senior supervision. When indicated, a left mediolateral episiotomy and a hands-on approach to protect the perineum were used by both midwives and doctors. Per vaginal and per rectal examinations were performed immediately after delivery. If OASIS was suspected, assessment was conducted by an obstetric specialist. The degree of OASIS was classified using the Abdul Sultan classification (Table 1).12 Delivery details were documented by midwives immediately after birth. Operative records for instrumental deliveries and OASIS repair, where applicable, were completed immediately after the procedure. Data were extracted from the hospital’s electronic delivery database between July 2022 and June 2023. Statistical analyses were performed using SPSS (Windows version 29.0; IBM Corp, Armonk [NY], United States). Descriptive analyses were used to examine demographics, mode of delivery, and the prevalences of episiotomy and OASIS. Means were compared between groups using the independent samples t test. Frequencies were compared using the Pearson Chi squared test or Fisher’s exact test, as appropriate. Trends were analysed using the Chi squared test for trend (Cochran–Armitage test). All risk factors were included in multivariable logistic regression analysis except epidural analgesia, nulliparity, and neonatal birth weight (justification provided in Results section). A P value of <0.05 was considered statistically significant.
     

    Table 1. Abdul Sultan classification of obstetric anal sphincter injury12
     
    Results
    A total of 43 732 deliveries were included in this study. The mean ± standard deviation maternal age at delivery was 31.5 ± 4.7 years and the median parity was 0 (interquartile range, 1). Of these, 22 566 (51.6%) were nulliparous and 21 166 (48.4%) were multiparous. Among the latter, 2268 (10.7%) had only previously delivered by Caesarean section and were therefore vaginally nulliparous. Data concerning previous delivery mode were missing for 905 women (4.3%). In total, 39 603 women (90.6%) had a normal vaginal delivery, 3528 (8.1%) had ventouse delivery, and 601 (1.4%) had a forceps delivery. Over the 10-year period from 2012 to 2021, the overall instrumental delivery rate and ventouse delivery rate declined significantly, from 13.2% to 12.0% (P<0.001) and from 11.8% to 8.6%, respectively (P<0.001) [Fig 1]. Overall, 23 325 women (53.3%) underwent episiotomy, whereas 20 407 (46.7%) did not; 326 women (0.7%) sustained OASIS, whereas 43 406 (99.3%) did not. The overall episiotomy rate decreased from 62.8% to 44.7% (P<0.001), with reductions observed in both nulliparous (from 89.2% to 68.5%; P<0.001) and multiparous women (from 31.7% to 23.8%; P<0.001). Conversely, the overall OASIS rate increased from 0.3% to 1.4% (P<0.001), with higher rates in nulliparous (from 0.4% to 2.5%; P<0.001) and multiparous women (0.1%-0.5%; P<0.001) [Fig 2].
     

    Figure 1. Ten-year trend in instrumental delivery (n=43 732)
     

    Figure 2. Ten-year trends in obstetric anal sphincter injury and episiotomy rates (n=43 732)
     
    The characteristics of the study population are summarised in Table 2. Episiotomy rates among women with and without OASIS were 51.8% and 53.3%, respectively (P=0.587). A higher proportion of women in the OASIS group were nulliparous (79.1% vs 51.4%; P<0.001) and vaginally nulliparous (85.9% vs 56.5%; P<0.001). Instrumental delivery was also more common in the OASIS group compared with the non-OASIS group (29.1% vs 9.3%; P<0.001). No statistically significant difference was observed between the type of instrumental vaginal delivery and the occurrence of OASIS (P=0.128). Women with OASIS had a lower BMI, a longer duration of labour, and delivered heavier neonates. No significant differences were observed in mean maternal age, ethnicity, gestational age, onset of labour, epidural analgesia, episiotomy, or macrosomia. All risk factors were included in the multivariable logistic regression analysis except epidural analgesia, nulliparity, and neonatal birth weight. Epidural analgesia was excluded because only one delivery with OASIS involved epidural analgesia, while nulliparity and neonatal birth weight were excluded due to their strong correlation with vaginal nulliparity and macrosomia, respectively. Macrosomia was considered to have greater clinical relevance than neonatal birth weight because a standard cut-off value exists. Multivariable logistic regression analysis revealed that vaginal nulliparity and instrumental delivery remained independent risk factors for OASIS, whereas BMI and labour duration did not. Induced labour (odds ratio [OR]=0.734, 95% CI=0.577-0.934; P=0.012) and episiotomy (OR=0.273, 95% CI=0.208-0.358; P<0.001) were identified as protective factors, while macrosomia (OR=2.754, 95% CI=1.435-5.284; P<0.001) was identified as a risk factor for OASIS (Table 3). Missing data were noted for BMI in 543 cases (1.2%) and for onset of labour in 82 cases (0.2%).
     

    Table 2. Characteristics of the study population and comparison between women with and without obstetric anal sphincter injury (n=43 732)
     

    Table 3. Simple and multivariable logistic regression of risk factors for obstetric anal sphincter injury
     
    In the subgroup analysis of nulliparous women, the OASIS rate was significantly lower among those undergoing normal vaginal delivery with episiotomy compared to those without (0.6% vs 1.7%; P<0.001) and those undergoing instrumental delivery with episiotomy (1.7% vs 42.9%; P<0.001). Among multiparous women, the OASIS rate was significantly lower in those undergoing normal vaginal delivery without episiotomy (0.3% vs 0.5%; P=0.026) and those undergoing instrumental delivery with episiotomy (0.5% vs 23.5% without episiotomy; P<0.001). Among vaginally nulliparous women within the multiparous group, no statistically significant difference in OASIS rates was observed between normal vaginal deliveries with and without episiotomy; however, the OASIS rate was significantly lower among those undergoing instrumental deliveries with episiotomy compared with those without (0 vs 37.5%; P<0.001) [Table 4].
     

    Table 4. Rate of obstetric anal sphincter injury according to parity, episiotomy status, and mode of vaginal delivery
     
    Discussion
    In recent years, many obstetric units in Hong Kong have promoted a reduction in episiotomy use in recent years. Our unit achieved substantial reductions in episiotomy rates among nulliparous and multiparous women between 2012 and 2021. Although the overall rate of OASIS remained low, considerable increases were observed in both groups during the study period. Vaginal nulliparity and operative vaginal delivery were identified as independent risk factors for OASIS, consistent with previous findings.7 11 Furthermore, episiotomy was identified as a protective factor against OASIS in multivariable logistic regression analysis (OR=0.273, 95% CI=0.208-0.358) [Table 3].
     
    In nulliparous women, episiotomy was protective against OASIS in both normal and instrumental vaginal deliveries. These findings differ from those of previous large-scale studies.7 11 In a large retrospective study in the Netherlands involving over 281 000 vaginal deliveries,13 and in another study including more than 10 000 women in Australia,14 mediolateral episiotomy was shown to reduce the risk of OASIS in nulliparous women (OR=0.2113 and 0.54,14 respectively). However, Mahgoub et al11 in France reported no association between episiotomy and OASIS. In their cohort of 42 626 women, the overall OASIS rate was 1.2% and the overall episiotomy rate was only 10%.11 Perrin et al7 reported an episiotomy rate of 63.2% in nulliparous women and an OASIS rate of 0.7%, regardless of episiotomy use. In their analysis, episiotomy was not associated with OASIS in normal vaginal delivery but appeared to be protective in nulliparous women undergoing operative vaginal delivery at term.7
     
    The above studies mainly involved women in Western populations. Several studies have indicated that Asian women have a two- to nine-fold increased risk of sustaining OASIS.15 16 17 18 19 In a study conducted in Israel involving over 80 000 women, including 997 of Asian origin, the OASIS rate among Asian women was 9 times higher than that among women of Western descent (3.5% vs 0.4%; P=0.001).16 Asian women also had a higher proportion of fourth-degree tears (17.1% vs 6.6%; P=0.039), despite smaller newborns (mean birth weight: 3318 g vs 3501 g; P=0.004).16 Anatomical differences between ethnic groups may contribute to this disparity. Cheung et al9 reported that pregnant women of East Asian origin had a thicker pubovisceral muscle, a smaller levator hiatus, and reduced pelvic organ mobility compared with pregnant women of Western descent. These factors may contribute to the higher risk of OASIS.9 Moreover, Bates et al20 found that a shorter perineal length measured during the second stage of labour prior to pushing was significantly associated with OASIS. Although a study conducted in Hawaii found no significant difference in perineal body length between Western and Chinese women, measurements were taken during the first stage of labour rather than before pushing.21 Further studies are needed to determine whether perineal body length differs during the second stage of labour. The reasons for the higher OASIS rates among Asian women remain unclear but are likely to be complex and multifactorial.
     
    Another notable point is the higher rate of epidural analgesia use among Western women compared with Asian women (50%-90% vs 0%-2.2%), even within the same hospital setting where epidural analgesia is offered free of charge to all women.7 11 16 20 In the present study, the rate of epidural analgesia was low throughout the study period. In this cohort, epidural analgesia was not associated with OASIS. A meta-analysis examining risk factors for OASIS found no association with epidural analgesia; however, it included only two studies.22 In contrast, Mahgoub et al11 identified epidural analgesia as a protective factor for OASIS, whereas another meta-analysis reported it as a risk factor.19 These conflicting findings suggest that the role of epidural analgesia in OASIS remains unclear.
     
    There is limited literature on the role of episiotomy in normal vaginal delivery among multiparous women. In the present study, episiotomy did not protect multiparous women from OASIS, except in the context of instrumental vaginal delivery. Indeed, episiotomy may increase the risk of OASIS in this group.23 However, we noted that episiotomy was protective against OASIS among multiparous women undergoing instrumental vaginal delivery (OR=0.028). This finding is supported by a Dutch study which reported five-fold and ten-fold reductions in OASIS during vacuum and forceps deliveries, respectively.24 In light of these findings, we recommend a more restrictive approach to episiotomy among multiparous women undergoing normal vaginal delivery.
     
    The rising trend of OASIS over the past decade may also be attributable to improvements in clinical detection following the promotion of more thorough post-delivery assessments by both midwives and obstetricians. Kwok et al25 reported that the prevalence of occult OASIS—detected by endoanal ultrasound but not identified by clinical examination after delivery—was as high as 7.8% after normal vaginal delivery and 3.8% after instrumental delivery. Subsequently, regular OASIS workshops were introduced to train midwives and doctors in performing standardised vaginal and rectal examinations after vaginal delivery. When a major perineal tear is suspected, immediate reassessment by an obstetric specialist is conducted. This practice has been shown to improve the detection rate of OASIS.26 We also analysed trends in instrumental vaginal delivery over the 10-year period. Overall, decreasing trends were observed for both instrumental and ventouse deliveries. The rate of forceps delivery remained similar or showed a slight decrease, except in 2021. Therefore, the rising trend in OASIS is unlikely to be explained by changes in instrumental delivery rates.
     
    Strengths and limitations
    The strengths of this study include its large sample size, 10-year study period, and the documented reduction in episiotomy rates, which allowed evaluation of the role of episiotomy in OASIS. Our unit is a tertiary centre with the highest delivery volume in Hong Kong, and this represents the largest retrospective study to date focusing on an Asian population. However, as a retrospective study, missing data were noted during data collection and entry. In addition, several risk factors previously identified in meta-analyses—such as the duration of the second stage of labour, fetal head position at delivery, history of previous OASIS, and shoulder dystocia—were not analysed in the present study,19 27 representing a key limitation. Furthermore, some cases of OASIS may have been missed on clinical examination. High-quality research is needed to further investigate OASIS, given its substantial impact on women’s quality of life.
     
    Conclusion
    With a substantial reduction in episiotomy rates, a corresponding increase in the rate of OASIS was observed. Episiotomy was protective against OASIS among nulliparous women undergoing singleton normal vaginal delivery and instrumental delivery. It also conferred protection in multiparous women undergoing instrumental delivery but not in those having normal vaginal delivery. Among vaginally nulliparous women within the multiparous group, the OASIS rate was significantly higher in those undergoing instrumental deliveries without episiotomy, similar to the rate observed in nulliparous women. Conversely, the OASIS rate was higher in the episiotomy group during normal vaginal delivery, although this difference was not statistically significant and may have been influenced by the small sample size. Further high-quality research is warranted, and women should be informed of these findings to enable informed decision-making regarding episiotomy.
     
    Author contributions
    Concept or design: SSC Chan, RYK Cheung.
    Acquisition of data: SSC Chan, RYK Cheung, TW Chau, YY Lau, SM Ng, TM Tso.
    Analysis or interpretation of data: SSC Chan, YY Lau.
    Drafting of the manuscript: YY Lau.
    Critical revision of the manuscript for important intellectual content: All authors.
     
    All authors had full access to the data, contributed to the study, approved the final version for publication, and take responsibility for its accuracy and integrity.
     
    Conflicts of interest
    All authors have disclosed no conflicts of interest.
     
    Acknowledgement
    The authors thank Ms LL Lee, their research assistant, for her assistance with data acquisition, analysis, and interpretation.
     
    Declaration
    Findings from this study were partially presented as an e-poster at the Royal College of Obstetricians and Gynaecologists World Congress 2024, Muscat, Oman, 15-17 October 2024.
     
    Funding/support
    This research received no specific grant from any funding agency in the public, commercial, or not-for-profit sectors.
     
    Ethics approval
    This research was approved by the Joint Chinese University of Hong Kong–New Territories East Cluster Clinical Research Ethics Committee, Hong Kong (Ref No.: 2022.259). The requirement for patient consent was waived by the Committee due to the retrospective nature of the research. The study complied with the Declaration of Helsinki and the International Council for Harmonization Guideline for Good Clinical Practice.
     
    References
    1. Tung CW, Cheon WC, Tong WM, Leung HY. Incidence and risk factors of obstetric anal sphincter injuries after various modes of vaginal deliveries in Chinese women. Chin Med J (Engl) 2015;128:2420-5. Crossref
    2. Jangö H, Langhoff-Roos J, Rosthøj S, Sakse A. Modifiable risk factors of obstetric anal sphincter injury in primiparous women: a population-based cohort study. Am J Obst Gynecol 2014;210:59.e1-6. Crossref
    3. Hsieh WC, Liang CC, Wu D, Chang SD, Chueh HY, Chao AS. Prevalence and contributing factors of severe perineal damage following episiotomy-assisted vaginal delivery. Taiwan J Obstet Gynecol 2014;53:481-5. Crossref
    4. Gurol-Urganci I, Cromwell DA, Edozien LC, et al. Third- and fourth-degree perineal tears among primiparous women in England between 2000 and 2012: time trends and risk factors. BJOG 2013;120:1516-25. Crossref
    5. Hong Kong College of Obstetricians and Gynaecologists. Territory-wide Audit in Obstetrics & Gynaecology. 2014. Available from: https://www.hkcog.org.hk/hkcog/Download/Territory-wide_Audit_in_Obstetrics_Gynaecology_2014.pdf. Accessed 1 May 2020.
    6. Woolley RJ. Benefits and risks of episiotomy: a review of the English-language literature since 1980. Part II. Obstet Gynecol Surv 1995;50:821-35. Crossref
    7. Perrin A, Korb D, Morgan R, Sibony O. Effectiveness of episiotomy to prevent OASIS in nulliparous women at term. Int J Gynaecol Obstet 2023;162:632-8. Crossref
    8. Abdool Z, Dietz HP, Lindeque BG. Ethnic differences in the levator hiatus and pelvic organ descent: a prospective observational study. Ultrasound Obstet Gynecol 2017;50:242-6. Crossref
    9. Cheung RY, Shek KL, Chan SS, Chung TK, Dietz HP. Pelvic floor muscle biometry and pelvic organ mobility in East Asian and Caucasian nulliparae. Ultrasound Obstet Gynecol 2015;45:599-604. Crossref
    10. Brown J, Kapurubandara S, Gibbs E, King J. The great divide: country of birth as a risk factor for obstetric anal sphincter injuries. Aust N Z J Obstet Gynaecol 2018;58:79-85. Crossref
    11. Mahgoub S, Piant H, Gaudineau A, Lefebvre F, Langer B, Koch A. Risk factors for obstetric anal sphincter injuries (OASIS) and the role of episiotomy: a retrospective series of 496 cases. J Gynecol Obstet Hum Reprod 2019;48:657-62. Crossref
    12. de Leeuw JW, Struijk PC, Vierhout ME, Wallenburg HC. Risk factors for third degree perineal ruptures during delivery. BJOG 2001;108:383-7. Crossref
    13. Okeahialam NA, Taithongchai A, Thakar R, Sultan AH. The incidence of anal incontinence following obstetric anal sphincter injury graded using the Sultan classification: a network meta-analysis. Am J Obstet Gynecol 2023;228:675-88.e13. Crossref
    14. Hauck YL, Lewis L, Nathan EA, White C, Doherty DA. Risk factors for severe perineal trauma during vaginal childbirth: a Western Australian retrospective cohort study. Women Birth 2015;28:16-20. Crossref
    15. Grobman WA, Bailit JL, Rice MM, et al. Racial and ethnic disparities in maternal morbidity and obstetric care. Obst Gynecol 2015;125:1460-7. Crossref
    16. Baruch Y, Gold R, Eisenberg H, et al. High incidence of obstetric anal sphincter injuries among immigrant women of Asian ethnicity. J Clin Med 2023;12:1044. Crossref
    17. D’Souza JC, Monga A, Tincello DG. Risk factors for perineal trauma in the primiparous population during non-operative vaginal delivery. Int Urogynecol J 2020;31:621-5. Crossref
    18. Yeaton-Massey A, Wong L, Sparks TN, et al. Racial/ethnic variations in perineal length and association with perineal lacerations: a prospective cohort study. J Matern Fetal Neonatal Med 2015;28:320-3. Crossref
    19. Hu Y, Lu H, Huang Q, et al. Risk factors for severe perineal lacerations during childbirth: a systematic review and meta-analysis of cohort studies. J Clin Nurs 2023;32:3248-65. Crossref
    20. Bates LJ, Melon J, Turner R, Chan SS, Karantanis E. Prospective comparison of obstetric anal sphincter injury incidence between an Asian and Western hospital. Int Urogynecol J 2019;30:429-37. Crossref
    21. Tsai PJ, Oyama IA, Hiraoka M, Minaglia S, Thomas J, Kaneshiro B. Perineal body length among different racial groups in the first stage of labor. Female Pelvic Med Reconstr Surg 2012;18:165-7. Crossref
    22. Barba M, Bernasconi DP, Manodoro S, Frigerio M. Risk factors for obstetric anal sphincter injury recurrence: a systematic review and meta-analysis. Int J Gynaecol Obstet 2022;158:27-34. Crossref
    23. Eggebø TM, Rygh AB, von Brandis P, Skjeldestad FE. Prevention of obstetric anal sphincter injuries with perineal support and lateral episiotomy: a historical cohort study. Acta Obstet Gynecol Scand 2024;103:488-97. Crossref
    24. van Bavel J, Hukkelhoven CW, de Vries C, et al. The effectiveness of mediolateral episiotomy in preventing obstetric anal sphincter injuries during operative vaginal delivery: a ten-year analysis of a national registry. Int Urogynecol J 2018;29:407-13. Crossref
    25. Kwok SP, Wan OY, Cheung RY, Lee LL, Chung JP, Chan SS. Prevalence of obstetric anal sphincter injury following vaginal delivery in primiparous women: a retrospective analysis. Hong Kong Med J 2019;25:271-8. Crossref
    26. Andrews V, Sultan AH, Thakar R, Jones PW. Occult anal sphincter injuries—myth or reality? BJOG 2006;113:195-200. Crossref
    27. Pergialiotis V, Bellos I, Fanaki M, Vrachnis N, Doumouchtsis SK. Risk factors for severe perineal trauma during childbirth: an updated meta-analysis. Eur J Obstet Gynecol Reprod Biol 2020;247:94-100. Crossref

    Pages