Predictive factors for length of hospital stay following primary total knee replacement in a total joint replacement centre in Hong Kong
Hong Kong Med J 2017 Oct;23(5):435–40 | Epub 4 Aug 2017
DOI: 10.12809/hkmj166113
© Hong Kong Academy of Medicine. CC BY-NC-ND 4.0
ORIGINAL ARTICLE
Predictive factors for length of hospital stay following primary total knee replacement in a total joint replacement centre in Hong Kong
CK Lo, MB, BS; QJ Lee, FHKCOS, FHKAM (Orthopaedic Surgery); YC Wong, FHKCOS, FHKAM (Orthopaedic Surgery)
Joint Replacement Centre, Yan Chai Hospital, Tsuen Wan, Hong Kong
Corresponding author: Dr CK Lo (lpluswck@live.com)
 Full
paper in PDF
Full
paper in PDF
Abstract
Introduction: The demand for total knee
replacement in Hong Kong places tremendous
economic burden on our health care system.
Shortening hospital stay reduces the associated cost.
The aim of this study was to identify perioperative
predictors of length of hospital stay following
primary total knee replacement performed at a high-volume
centre in Hong Kong.
Methods: We retrospectively reviewed all primary
total knee replacements performed at Yan Chai
Hospital Total Joint Replacement Centre from
October 2011 to October 2015. Perioperative factors
that might influence length of stay were recorded.
Results: A total of 1622 patients were identified. The
mean length of hospital stay was 6.8 days. Predictors
of prolonged hospital stay following primary total
knee replacement were advanced age; American
Society of Anesthesiologists physical status class
3; bilateral total knee replacement; in-patient complications; and the need for blood transfusion,
postoperative intensive care unit admission, and
urinary catheterisation.
Conclusions: Evaluating factors that can predict
length of hospital stay is the starting point to improve
our current practice in joint replacement surgery.
Prediction of high-risk patients who will require a
longer hospitalisation enables proactive discharge
planning.
New knowledge added by this study
- Advanced age; American Society of Anesthesiologists physical status class 3; bilateral operation; in-patient complications; and the need for blood transfusion, postoperative intensive care unit admission, and urinary catheterisation were predictors for length of hospital stay after primary total knee replacement.
- Prediction of high-risk patients who will require longer hospitalisation based on perioperative factors enables proactive discharge planning.
- Establishment of a urinary catheterisation protocol might help to shorten hospital stay following primary total knee replacement.
Introduction
With a rising incidence of degenerative arthritis in
our ageing population, together with an increase in
popularity of joint replacement surgery, the demand
for total knee replacement (TKR) is expected to grow
in Hong Kong.1 This places a tremendous economic
burden on our health care system. The associated
cost of hospital stay can be reduced by shortening
the length of hospital stay (LOS). With more than 3000
TKRs performed in public hospitals in Hong Kong
each year,2 and given the cost per in-patient day of
HK$4000, shortening the LOS by 1 day could save
HK$12 million every year. Identification of factors
that extend hospital stay, which is a starting point for
reducing LOS, can reduce the financial burden on
the health care system.
The aim of this study was to identify
perioperative predictors of LOS following primary
TKR in a high-volume centre in Hong Kong.
Methods
All patients admitted for primary TKR from
October 2011 (when the Joint Replacement Centre
in Yan Chai Hospital in Hong Kong was established)
to October 2015 were included in the study. Data
of patients were collected retrospectively from
the Clinical Management System of the Hospital
Authority. The study was approved by the Kowloon
West Cluster Research Ethics Committee.
Patients who undergo TKR in our centre attend
a preadmission clinic 1 month before operation for their preoperative work-up and anaesthetic
assessment, and to be given information by surgeons
and a specialised nurse about the procedure,
rehabilitation, and benefits and complications of
TKR. Patients were admitted on the day of surgery
or earlier for medical optimisation or social reasons.
All operations were performed by or under the
supervision of a joint surgeon who adopted a
medial parapatellar approach and used a variety of
cemented implants. A tourniquet was applied and
the patella was routinely resurfaced. A standardised
clinical pathway of postoperative monitoring,
investigations, mobilisation, and anticoagulation
was applied in all patients (Fig 1). Physiotherapy
was commenced on the first postoperative day
and continued daily until discharge. Patients were
cleared for discharge when medically stable, walking
independently, and functionally able to return to
their home environment. Independent walking was
defined as walking stably without assistance from
another person with or without a walking aid.
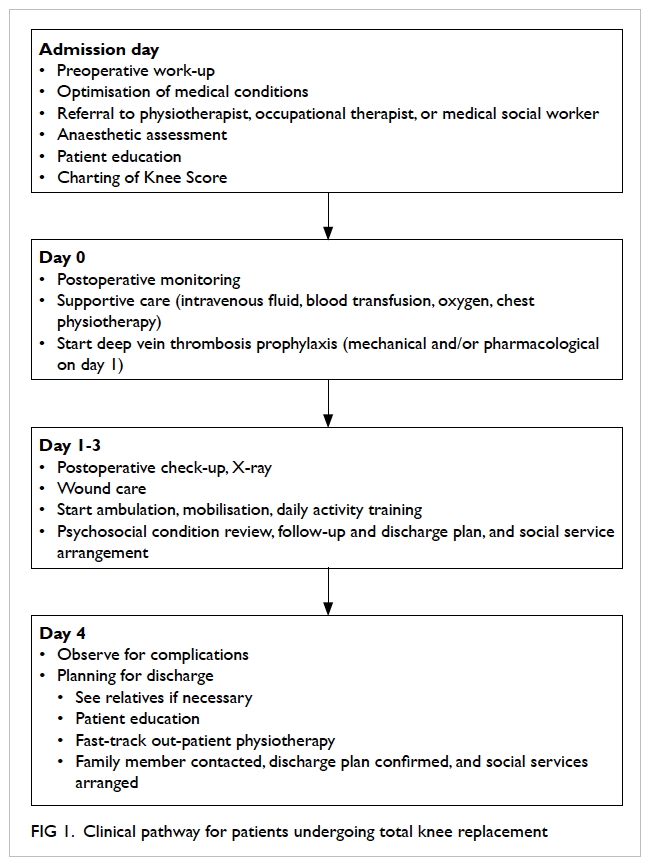
Figure 1. Clinical pathway for patients undergoing total knee replacement
The primary outcome measure of the study was
LOS, defined as the number of days in hospital from
the day of surgery to the day of discharge. The following
factors were analysed: age; gender; body mass index
(BMI); American Society of Anesthesiologists (ASA)
physical status classification; type of operation
(unilateral versus bilateral TKR); preoperative
haemoglobin level; in-patient complications; and
requirement for postoperative transfusion, drain
insertion, postoperative intensive care unit (ICU)
care, and urinary catheterisation for postoperative
urinary retention. Because the ASA classification has
only been documented in the Clinical Management
System since August 2014, such information could
be retrieved for only 467 patients in this study.
The LOS ranged from 3 to 46 days. Since the
distribution was highly skewed, a non-parametric
approach was used in the analysis. A univariate
analysis for all the studied predictive factors was
first performed. Mann-Whitney test was used to
analyse categorical variables. These included gender,
BMI, ASA classification, type of operation, in-patient
complications, drain insertion, postoperative
ICU care, and urinary catheterisation. Spearman’s
rank correlation coefficient was used to analyse
continuous variables including age, preoperative
haemoglobin level, and blood transfusion. Following
univariate analysis, significant predictive factors
were subjected to multivariable linear regression
analysis to test the effect of each significant factor
after adjusting for the others. A P value of ≤0.05 was
considered statistically significant.
Results
A total of 1622 patients were reviewed in this study.
Patients who received total hip replacement and
revision total knee replacement in our centre were excluded. The mean (range) and median LOS were
6.8 (3-46) days and 6 days, respectively. The Table
shows the categories for each predictive factor, the
number of patients in each category, the mean LOS for each category, and the P values for univariate and
multivariate analysis.
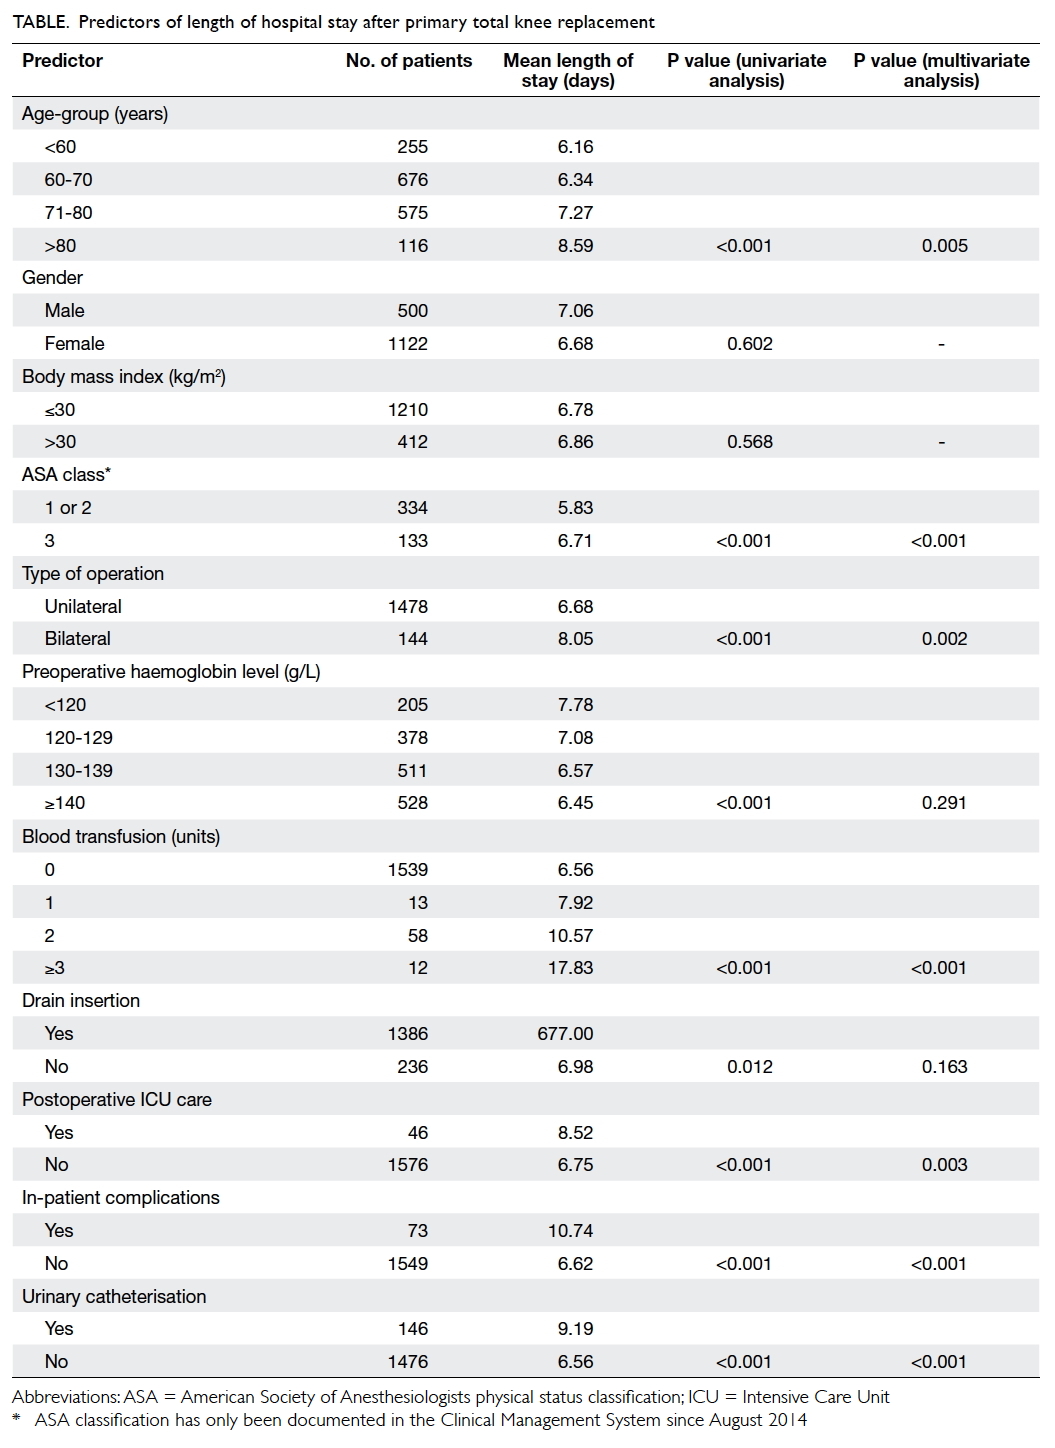
Table. Predictors of length of hospital stay after primary total knee replacement
Age; ASA class; type of operation; preoperative
haemoglobin level; in-patient complications;
requirement for blood transfusion, drain insertion,
postoperative ICU care, and urinary catheterisation
were significant predictive factors in the univariate
analysis. When these significant factors were
adjusted for the effect of the other factors using
multiple linear regression, only advanced age; ASA
class 3; bilateral TKR; in-patient complications;
and the need for blood transfusion, postoperative
ICU care, and urinary catheterisation remained
significant.
Discussion
Several studies of LOS in a Caucasian population
have been published, but the study samples were
usually highly heterogeneous and included patients
with total hip as well as unicompartmental knee
replacement.3 4 This is the first study to exclusively
examine the LOS following TKR in a Chinese
population. We believe both cultural-specific patient
factors and the unique hospital setting in Hong Kong
significantly influence LOS. Identifying the predictive
factors in our own population is important to reduce
LOS and the associated cost. Factors that have been
shown in previous studies to have an influence
include age,5 gender,5 ASA class,6 type of surgery,7 requirement for blood transfusion,8 and in-patient
complications.8 9 Data for the influence of BMI7 8 10 and preoperative haemoglobin level3 8 11 are equivocal.
We also studied factors not previously examined
including the need for drain insertion, postoperative
ICU admission, and Foley catheterisation due to
urinary retention.
This study confirmed other previously
reported risk factors for longer LOS. Age and ASA
class were expected to be predictors of LOS and were
significant in many other studies.3 4 5 6 Classification of
ASA physical status is a measurement of the patient’s
co-morbidity and general fitness. Patients with
advanced age and decreased physical fitness will find
the required intensive rehabilitation difficult and
thus require a longer hospital stay.
The rehabilitation necessary after TKR is
demanding and can account for the longer LOS
required following bilateral TKR.7 Patients who
require bilateral TKR have sequential TKRs
performed in a single anaesthetic session. In our
study, the mean LOS is 1.37 days longer in such
patients. Most patients with degenerative arthritis
have disease affecting both knees. Patients who
undergo unilateral TKR commonly request TKR
for the other side due to significant improvement of
symptoms on the operated side. The combined LOS
for two admissions is obviously longer than that for a
single admission for bilateral TKR. Several previous
studies have demonstrated a comparable safety
profile between bilateral TKR and unilateral TKR in
properly selected patients.12 13 14 15 Patients with bilateral
osteoarthritis of the knee should be encouraged to undergo bilateral TKR provided they can tolerate the
procedure.
Blood management has always been a
contentious issue in TKR. Both preoperative
haemoglobin level and requirement for blood
transfusion were significant predictive factors for
LOS in our univariate analysis. Only requirement
for blood transfusion, however, remained significant
after multivariate analysis. This signifies that the
association between preoperative haemoglobin
level and LOS is due to the requirement for a blood
transfusion rather than the effect itself. It is well
documented that preoperative haemoglobin level is
the single most important predictor of need for blood
transfusion following TKR.16 This is why preoperative
haemoglobin level was a significant predictive factor
for LOS in some studies although it is not in our
study. Raut et al8 reported a significant association
between LOS and both preoperative haemoglobin
level and blood transfusion requirement although
multivariate analysis was not performed. Husted et
al3 reported both preoperative haemoglobin level and
blood transfusion to be significant predictive factors
for LOS, yet more than half of the patients recruited
in their study underwent total hip replacement (THR).
The intrinsic difference between THR and TKR
explains the difference between our and Husted et al’s findings.
Postoperative ICU care delayed rehabilitation
and inevitably prolonged LOS. This factor
remained significant after adjustment for ASA
classification. Most of our patients were admitted
to the ICU for postoperative monitoring of medical
co-morbidities. A commonly encountered reason
for ICU monitoring is obstructive sleep apnoea.17
Patients at risk of obstructive sleep apnoea should
be identified and referred to an ear, nose, and throat
surgeon for assessment and early management.18 The
need for ICU admission and prolonged LOS may
be eliminated if medical conditions are optimised
before TKR.
Patients who develop in-patient complications
were likely to stay longer in hospital; this is consistent
with the findings in the literature.8 9 Patients who
have complications require further work-up and
management, this increases utilisation of resources
and cost in addition to the increased LOS.9 Every
effort should be made to avoid complications. We
classified complications into seven groups based on
our experience. They included deep vein thrombosis,
surgical site infection, periprosthetic fracture,
urinary tract infection, pressure sore, chest infection,
and pulmonary embolism (Fig 2). Any complication
that did not fall into one of these categories was
documented as ‘others’. The top three complications
were deep vein thrombosis, surgical site infection,
and periprosthetic fracture; these altogether account
for 56% of all complications. Patients who developed
deep vein thrombosis required warfarinisation and dose titration prior to discharge. Patients who
developed a wound infection required intravenous
antibiotics, surgical debridement, and close
monitoring of the wound. Those with periprosthetic
fracture required protected weight-bearing that
complicated rehabilitation. We believe strict
adherence to anticoagulation guidelines, meticulous
wound care, and careful implant insertion are key
to avoid complications, prolonged LOS, and more
importantly, patient suffering.
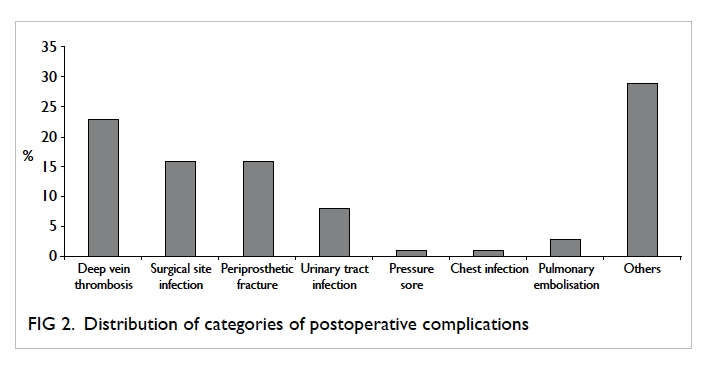
Figure 2. Distribution of categories of postoperative complications
In our centre, a bladder scan is performed in
patients who do not pass urine for 8 hours following
TKR. Those with a urinary volume of ≥500 mL
undergo bladder drainage via a urinary catheter.
If the patient cannot pass urine on reassessment,
a catheter is left in situ. There is, however, no
protocol for catheter removal. The catheter will
usually remain in place for 1 to 2 days. In our study,
the mean duration of urinary catheterisation was
2.35 (range, 1-15) days (Fig 3). If the patient fails
to manage without a urinary catheter, a urological
referral is made. This is not ideal as the patient must
then remain an in-patient while awaiting urological
opinion. We believe close liaison with the urologist
should be established to enable such patients to be
discharged and subsequently assessed in a urology
out-patient clinic.
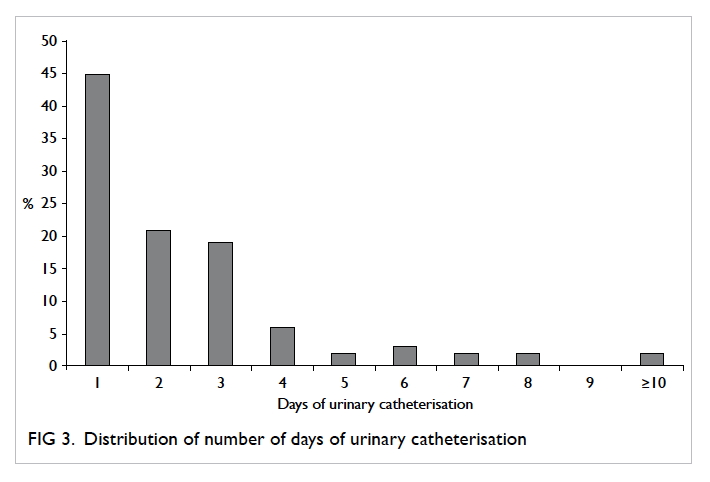
Figure 3. Distribution of number of days of urinary catheterisation
There were some important negative findings
in our study. Most Caucasian studies reveal
that women remain in hospital longer than men
following TKR.3 5 This has been reported to be due
to the different gender roles in the family: men could
go home earlier because they were more likely to
be looked after by their partner.19 The situation in
Hong Kong is different. Children usually live with or
close to their parents for cultural and social reasons.
Patients having TKR are cared for by their children,
not their partner; this eliminates the effect of gender
on LOS.
We did not find a statistically significant
contribution of drain insertion. We hypothesise that
drain insertion decreases haematoma collection and
knee effusion and improves the range of movement
and function. Since adequate knee function is
required for discharge, LOS could be reduced. The
results in this study, however, contradicted this
hypothesis.
Evaluating predictive factors for LOS after
TKR is the starting point to improve our current
practice. Based on this study, we need to establish a
protocol to wean patients off a urinary catheter. Early
prediction of high-risk patients who will require
longer hospitalisation provides the opportunity
for better preoperative counselling, anticipation of
escalated care, and proactive discharge planning.
Our study is limited by its retrospective nature,
with results highly dependent on the accuracy of
documentation. We have not precisely recorded the home care status of the patient and the experience of
the principal surgeon, as a result these are not used
as a covariate in the analysis of our study. The results
also reflect the clinical practice of a single centre
and may not be generalised to represent the whole
population. A territory-wide joint replacement
registry could help to analyse predictors of LOS that
are specific to Hong Kong.
Conclusion
Factors that significantly influence LOS following
TKR are advanced age; ASA class 3; bilateral
operation; in-patient complications; and the need
for blood transfusion, postoperative ICU admission,
and urinary catheterisation. Identifying these factors
will help improve our clinical practice to reduce the
LOS and associated cost.
Acknowledgement
The authors would like to thank Dr Kin-hoi Wong
of North District Hospital for his advice regarding
statistical analysis.
Declaration
All authors have disclosed no conflicts of interest.
References
1. Yan CH, Chiu KY, Ng FY. Total knee arthroplasty for
primary knee osteoarthritis: changing pattern over the past
10 years. Hong Kong Med J 2011;17:20-5.
2. Lee QJ, Mak WP, Wong YC. Mortality following primary
total knee replacement in public hospitals in Hong Kong.
Hong Kong Med J 2016;22:237-41.
3. Husted H, Holm G, Jacobsen S. Predictors of length of stay
and patient satisfaction after hip and knee replacement
surgery: fast-track experience in 712 patients. Acta Orthop
2008;79:168-73. Crossref
4. Ong PH, Pua YH. A prediction model for length of stay
after total and unicompartmental knee replacement. Bone
Joint J 2013;95:1490-6. Crossref
5. Carter EM, Potts HW. Predicting length of stay from an
electronic patient record system: a primary total knee
replacement example. BMC Med Inform Decis Mak
2014;14:26. Crossref
6. van den Belt L, van Essen P, Heesterbeek PJ, Defoort KC.
Predictive factors of length of hospital stay after primary
total knee arthroplasty. Knee Surg Sports Traumatol
Arthrosc 2015;23:1856-62. Crossref
7. Halawi MJ, Vovos TJ, Green CL, Wellman SS, Attarian
DE, Bolognesi MP. Preoperative predictors of extended
hospital length of stay following total knee arthroplasty. J
Arthroplasty 2015;30:361-4. Crossref
8. Raut S, Mertes SC, Muniz-Terrera G, Khanduja V. Factors
associated with prolonged length of stay following a total
knee replacement in patients aged over 75. Int Orthop
2012;36:1601-8. Crossref
9. El Bitar YF, Illingworth KD, Scaife SL, Horberg JV, Saleh
KJ. Hospital length of stay following primary total knee
arthroplasty: data from the nationwide inpatient sample
database. J Arthroplasty 2015;30:1710-5. Crossref
10. Lozano LM, Tió M, Rios J, et al. Severe and morbid obesity
(BMI ≥ 35 kg/m2) does not increase surgical time and
length of hospital stay in total knee arthroplasty surgery.
Knee Surg Sports Traumatol Arthrosc 2015;23:1713-9. Crossref
11. Jonas SC, Smith HK, Blair PS, Dacombe P, Weale AE.
Factors influencing length of stay following primary total
knee replacement in a UK specialist orthopaedic centre.
Knee 2013;20:310-5. Crossref
12. Cohen RG, Forrest CJ, Benjamin JB. Safety and efficacy
of bilateral total knee arthroplasty. J Arthroplasty
1997;12:497-502. Crossref
13. Jain S, Wasnik S, Mittal A, Sohoni S, Kasture S. Simultaneous
bilateral total knee replacement: a prospective study of 150
patients. J Orthop Surg (Hong Kong) 2013;21:19-22. Crossref
14. Spicer E, Thomas GR, Rumble EJ. Comparison of the
major intraoperative and postoperative complications
between unilateral and sequential bilateral total knee
arthroplasty in a high-volume community hospital. Can J
Surg 2013;56:311-7. Crossref
15. Sheth DS, Cafri G, Paxton EW, Namba RS. Bilateral
simultaneous vs staged total knee arthroplasty: a
comparison of complications and mortality. J Arthroplasty
2016;31:212-6. Crossref
16. Guerin S, Collins C, Kapoor H, McClean I, Collins D. Blood
transfusion requirement prediction in patients undergoing
primary total hip and knee arthroplasty. Transfus Med
2007;17:37-43. Crossref
17. Kaw R, Pasupuleti V, Walker E, Ramaswamy A, Foldvary-Schafer N. Postoperative complications in patients with
obstructive sleep apnea. Chest 2012;141:436-41. Crossref
18. Auckley D, Bolden N. Preoperative screening and
perioperative care of the patient with sleep-disordered
breathing. Curr Opin Pulm Med 2012;18:588-95. Crossref
19. Baker DW, Hasnain-Wynia R, Kandula NR, Thompson
JA, Brown ER. Attitudes toward health care providers,
collecting information about patients’ race, ethnicity, and
language. Med Care 2007;45:1034-42. Crossref
 A video clip showing transcatheter aortic valve implantation technique
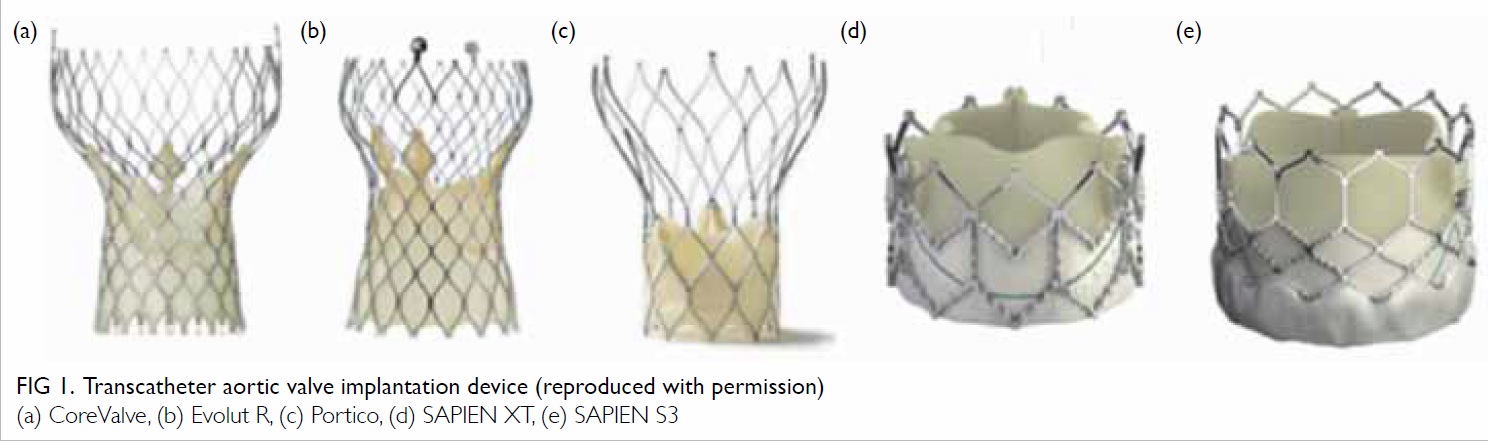
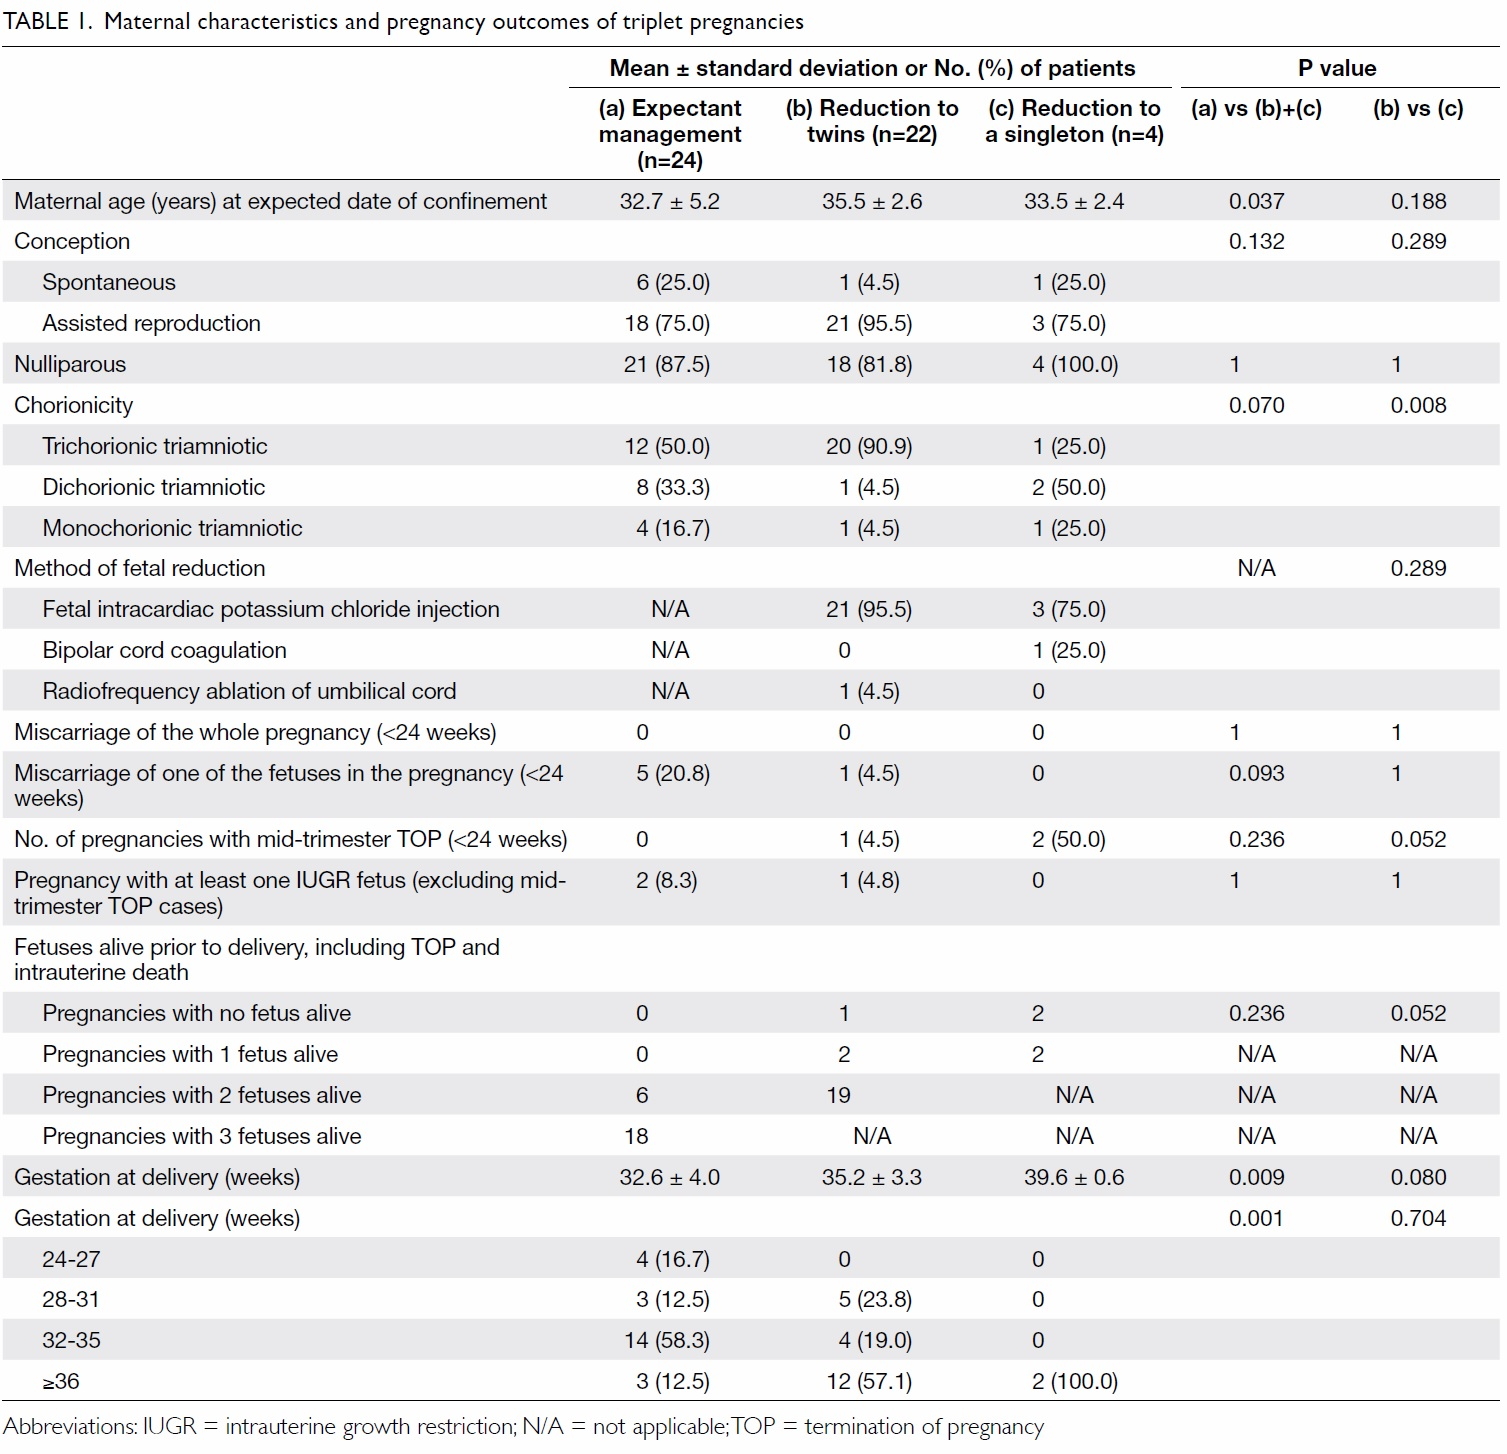
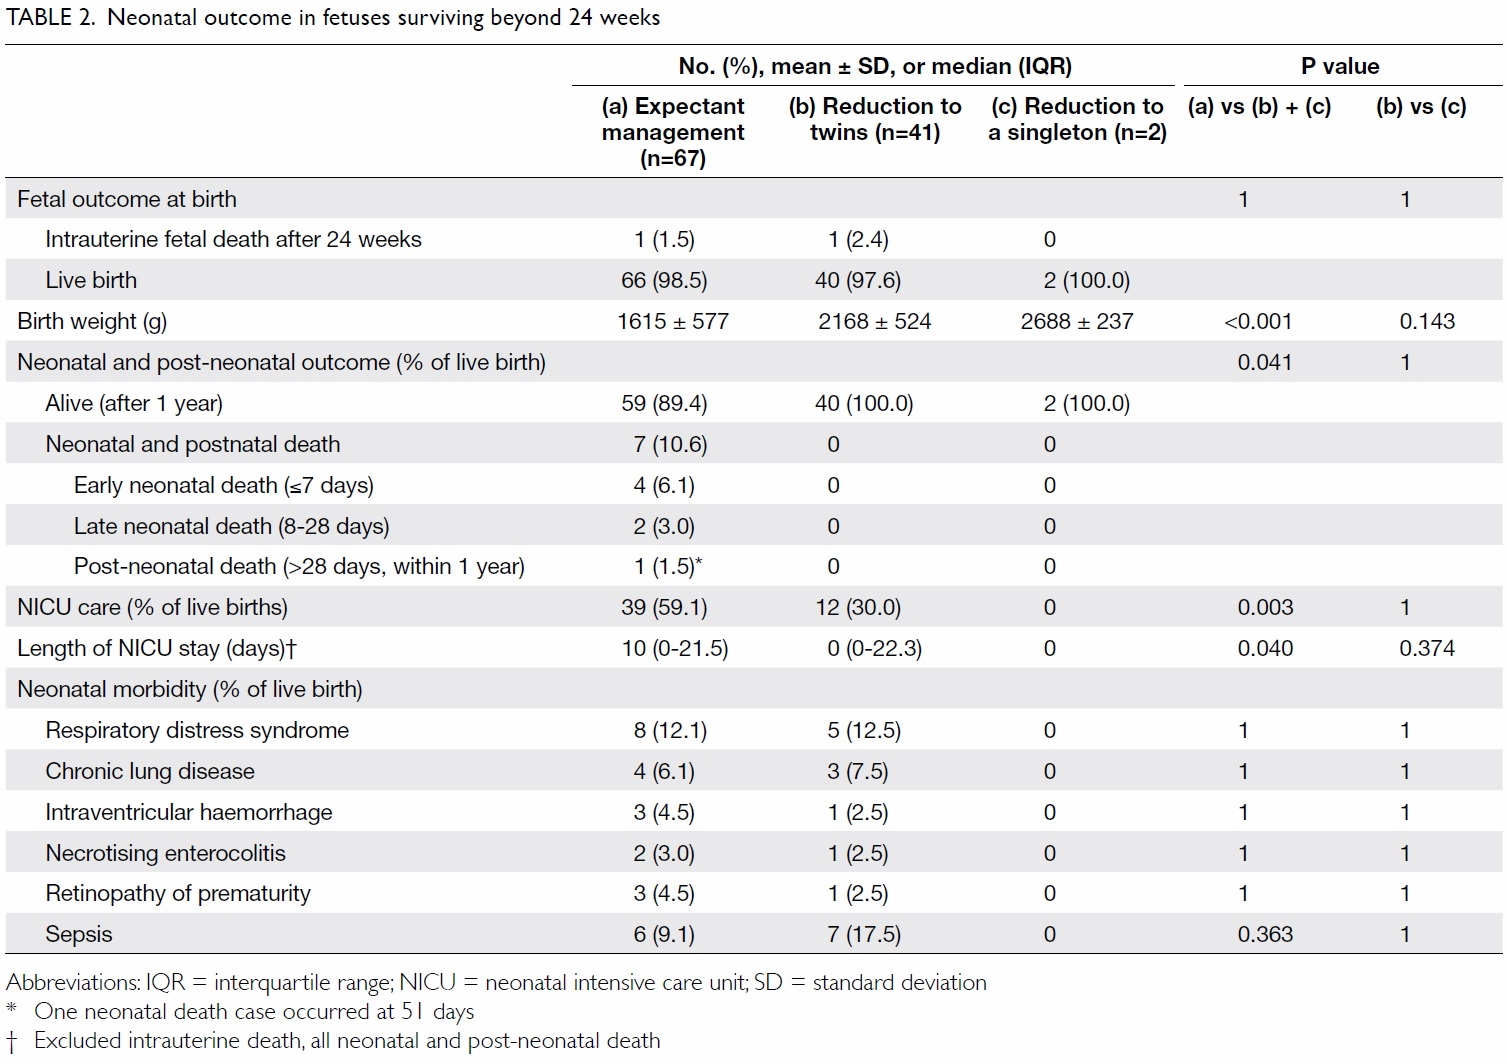
 A video clip showing triplet pregnancy with fetal reduction skills