Prevalence of chromosomal abnormalities and 22q11.2 deletion in conotruncal and non-conotruncal antenatally diagnosed congenital heart diseases in a Chinese population
Hong
Kong Med J 2019 Feb;25(1):6–12 | Epub 18 Jan 2019
© Hong Kong Academy of Medicine. CC BY-NC-ND 4.0
ORIGINAL ARTICLE
Prevalence of chromosomal abnormalities and 22q11.2
deletion in conotruncal and non-conotruncal antenatally diagnosed
congenital heart diseases in a Chinese population
CW Kong, MB, ChB, MRCOG, FHKAM (Obstetrics and
Gynaecology)1; Yvonne KY Cheng, MB, ChB, MRCOG, FHKAM
(Obstetrics and Gynaecology)2; William WK To, FRCOG, MD1;
TY Leung, FRCOG, MD2
1 Department of Obstetrics and
Gynaecology, United Christian Hospital, Kwun Tong, Hong Kong
2 Department of Obstetrics and
Gynaecology, Prince of Wales Hospital, Shatin, Hong Kong
Corresponding author: Dr CW Kong (melizakong@gmail.com)
 Full
paper in PDF
Full
paper in PDF
Abstract
Introduction: The aim of the
present study was to calculate the prevalence of chromosomal
abnormalities among antenatally diagnosed congenital heart diseases
(CHDs), and the prevalence of 22q11.2 deletion in those with conotruncal
CHDs versus isolated non-conotruncal CHDs.
Methods: All patients with
antenatal ultrasound finding of fetal CHDs in two obstetric units in a
5-year period were retrospectively reviewed. Detected CHDs were
classified as conotruncal if the malformation involved either the aortic
outflow tract or the pulmonary outflow tract; otherwise they were
classified as non-conotruncal. Karyotyping, fluorescence in situ
hybridisation for 22q11.2 deletion (22q11FISH), and array comparative
genomic hybridisation (aCGH) results were retrieved from patient medical
records. The primary outcome was prevalence of chromosomal abnormalities
in CHDs. The secondary outcomes were prevalence of 22q11.2 deletion and
its prevalence in conotruncal versus non-conotruncal CHDs.
Results: A total of 254 Chinese
patients were diagnosed to have fetal CHDs. In all, 50 (19.7%) were
found to have chromosomal abnormalities with seven (2.8%) patients
having 22q11.2 deletion, of whom all seven had conotruncal CHDs and none
had non-conotruncal CHDs (P<0.05). Conventional karyotyping detected
35 (70%) cases of the chromosomal abnormalities. The 22q11FISH detected
three cases of 22q11.2 deletion; aCGH was performed to detect four cases
of 22q11.2 deletion and eight other cases of copy number variations.
Conclusion: Our results suggest
that invasive testing for karyotyping is recommended for fetal CHDs.
Although the prevalence of 22q11.2 deletion was low, testing for 22q11.2
deletion should be offered for conotruncal CHDs.
New knowledge added by this study
- Prevalence of 22q11.2 deletion in the Chinese population is low.
- Cardiac abnormalities in 22q11.2 deletion are mainly conotruncal cardiac defects.
- Patients should receive counselling for invasive testing for chromosomal abnormalities in fetal cardiac lesions.
- Testing for 22q11.2 deletion is recommended for conotruncal cardiac defect.
Introduction
Congenital heart diseases (CHDs) are the commonest
congenital malformations at birth and a leading cause of neonatal
mortality, with an incidence of around eight in 1000 births.1 The reported incidence of chromosomal abnormalities in
patients with CHDs differs between infants and fetuses, as well as among
different series and studies, ranging from 9% to 18%.2 3 4 5 6 7 Many previous
studies have typically only included major aneuploidies as chromosomal
abnormalities; other chromosomal aberrations, such as 22q11.2 deletion or
other microdeletions, were not investigated. The availability of new
cytogenetic and molecular technologies, such as specific fluorescence in
situ hybridisation (FISH) probes, array comparative genomic hybridisation
(aCGH),8 or sophisticated genome
sequencing methods,9 10 has increased the identified contribution of
chromosomal abnormalities.
The frequency of 22q11.2 deletions among all cases
of CHDs has been estimated to be around 2% to 5.7%.11 The prevalence of 22q11.2 deletions in the Chinese
population has not been well documented. However, recent studies have
shown that the condition is likely to be underdiagnosed in adult Chinese
populations, as recognition of clinical and dysmorphic features could be
unreliable.12 The most frequently
encountered CHDs in this syndrome are conotruncal CHDs that involve the
pulmonary or aortic outflow tracts. However, 22q11.2 deletions are also
associated with isolated non-conotruncal CHDs.13
14
The objective of this study was to calculate the
prevalence of chromosomal abnormalities among antenatally diagnosed CHDs,
and the prevalence of 22q11.2 deletion in those with conotruncal CHDs
versus isolated non-conotruncal CHDs.
Methods
All pregnant patients with antenatal ultrasound
finding of fetal CHDs from July 2012 to June 2017 in two maternal fetal
medicine referral centres, United Christian Hospital and Prince of Wales
Hospital, Hong Kong, were retrospectively retrieved from the obstetric
ultrasound database. Non-Chinese patients were excluded from this cohort.
The detected CHDs were classified as conotruncal if the malformation
involved either the aortic outflow tract or the pulmonary outflow tract;
otherwise, they were classified as non-conotruncal. According to the
protocol of these two hospitals, pregnant patients with antenatal
ultrasound findings of CHDs were offered invasive testing for karyotyping.
Self-financed aCGH was recommended to the patient; if she declined aCGH,
FISH for 22q11.2 deletion (22q11FISH) was offered free of charge. The
aCGH, FISH, and karyotype of patients from United Christian Hospital were
sent to the prenatal diagnostic laboratory of Tsan Yuk Hospital; those of
patients from Prince of Wales Hospital were sent to the prenatal
diagnostic laboratory of the Chinese University of Hong Kong. NimbleGen
CGX 135k (Roche, Basel, Switzerland) and CGX v2 60k (PerkinElmer, Waltham
[MA], US) oligonucleotide arrays were used in the aCGH studies in the Tsan
Yuk Hospital from July 2012 to March 2014 and from March 2014 to June
2017, respectively. Copy number variations (CNVs) were categorised as
previously reported by Kan et al.15
A customised 44k Fetal Chip v1.0 and a 60k Fetal Chip v2.0 (Agilent
Technologies, Inc, Santa Clara [CA], US) were used in the Chinese
University of Hong Kong for the aCGH studies from July 2012 to November
2013 and from December 2013 to June 2017, respectively. The CNVs were
categorised as previously reported by Leung et al.16
The aCGH, 22q11FISH, and karyotyping results were
reviewed from patient medical records. The prevalence of chromosomal
abnormalities in these antenatally diagnosed CHDs fetuses, specifically
the prevalence of 22q11.2 deletion, was calculated and compared between
the conotruncal CHDs and the non-conotruncal CHDs. The primary outcome was
the prevalence of chromosomal abnormalities in CHDs. The secondary
outcomes were the total prevalence of 22q11.2 deletion in conotruncal CHDs
compared with that in non-conotruncal CHDs.
The SPSS (Windows version 20.0; IBM Corp, Armonk
[NY], US) was used for data entry and analysis. Comparison of categorical
variables between the conotruncal and non-conotruncal groups was analysed
by Chi squared test or Fisher exact test where appropriate. A P value of
<0.05 was considered statistically significant.
The Strengthening the Reporting of Observational
Studies in Epidemiology (STROBE) statement was used in the preparation of
this article.17
Results
From July 2012 to June 2017, there were 54 802
deliveries in United Christian Hospital and Prince of Wales Hospital,
among which 264 (0.48%) patients were diagnosed to have fetal CHDs by
antenatal ultrasound scan. Of these, 254 (96.2%) patients were Chinese and
were recruited for final analysis. The mean (± standard deviation)
maternal age was 32.3 ± 4.9 years, with 151 (59.4%) patients being
nulliparous. The mean gestational age at diagnosis of fetal CHDs by
ultrasound was 20.4 ± 2.9 weeks. Within the total cohort of 254 patients
with fetal CHDs, 160 (63.0%) were classified into the conotruncal group,
while 94 (37.0%) were classified into the non-conotruncal group. The
prevalence of the various types of conotruncal and non-conotruncal CHDs
and the prevalence of chromosomal abnormalities are listed in Table
1. Fourty-one (16.1%) patients had other structural abnormalities
found in antenatal ultrasound apart from CHDs.
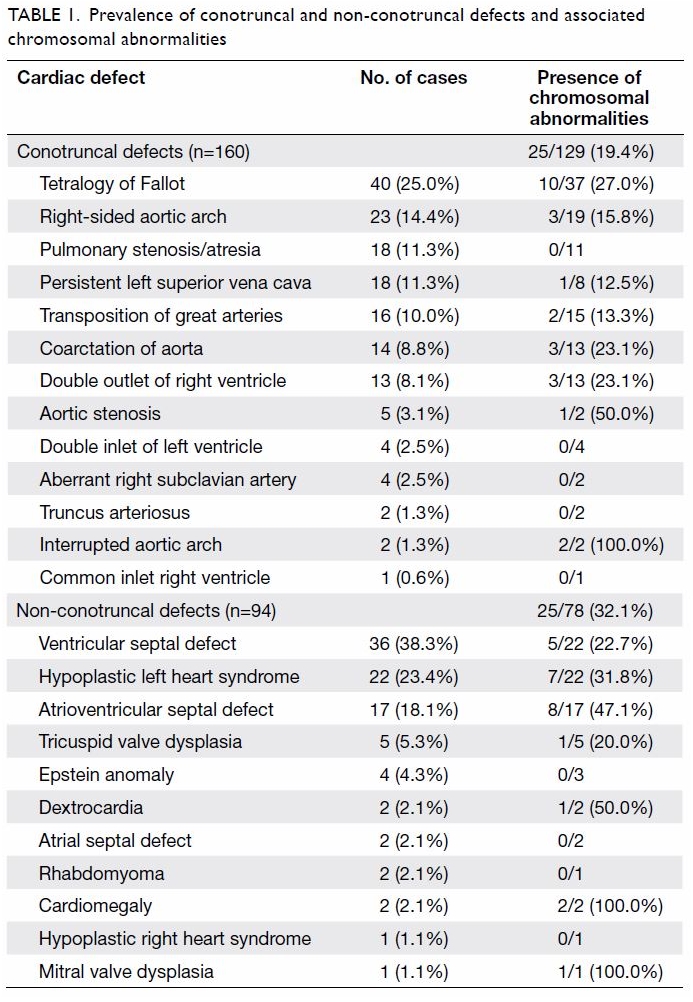
Table 1. Prevalence of conotruncal and non-conotruncal defects and associated chromosomal abnormalities
Chromosomal analysis and karyotyping was done in
207 (81.5%) patients; of them, aCGH was performed in 146 (70.5%) and
22q11FISH was performed in 61 (29.5%). The remaining 47 patients refused
chromosomal analysis. In the group of 207 fetuses with karyotype
performed, 50 (24.2%) were found to have chromosomal abnormalities;
trisomy 21 and trisomy 18 accounted for 42.0% of all these abnormalities.
The different types of chromosomal abnormalities are shown in Table
2. Of the 50 cases with chromosomal abnormalities, 35 (70%) were
detected by conventional karyotyping. Three cases of 22q11.2 deletion were
detected by FISH; aCGH detected another four cases of 22q11.2 deletion and
eight cases of other CNVs, as shown in Table 3. The prevalence of chromosomal abnormalities
in fetuses without extracardiac abnormalities was 29 of 168 (17.3%),
whereas that in fetuses with extracardiac abnormalities was 21 of 39
(53.8%). The prevalence of chromosomal abnormalities in non-conotruncal
CHDs was 25 of 78 (32.1%) which was significantly higher than that in
conotruncal CHDs (25 of 129; 19.4%) [P=0.04]. All seven patients with
22q11.2 deletion were found in the group of conotruncal CHDs and no
patients with 22q11.2 deletion were found in the group of non-conotruncal
CHDs (P<0.05). The details of these seven cases are shown in Table
4.
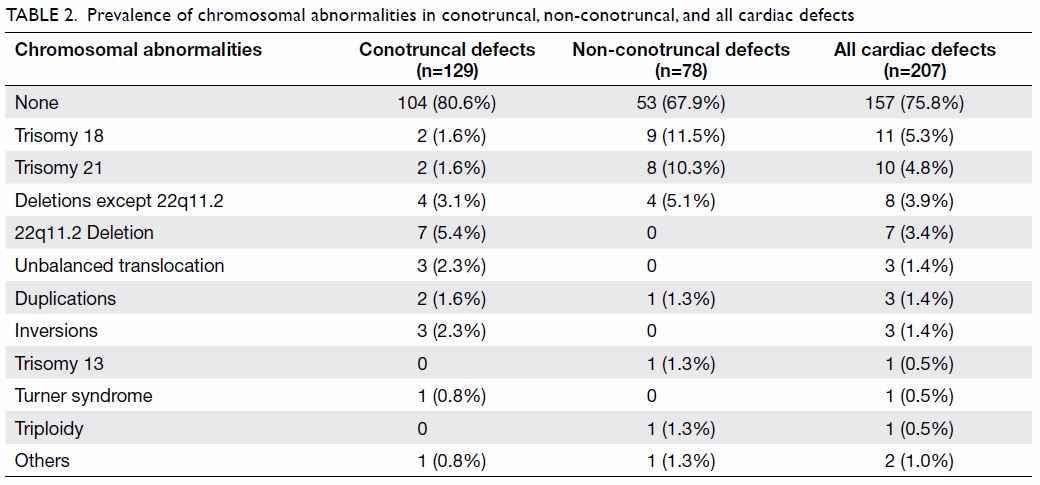
Table 2. Prevalence of chromosomal abnormalities in conotruncal, non-conotruncal, and all cardiac defects
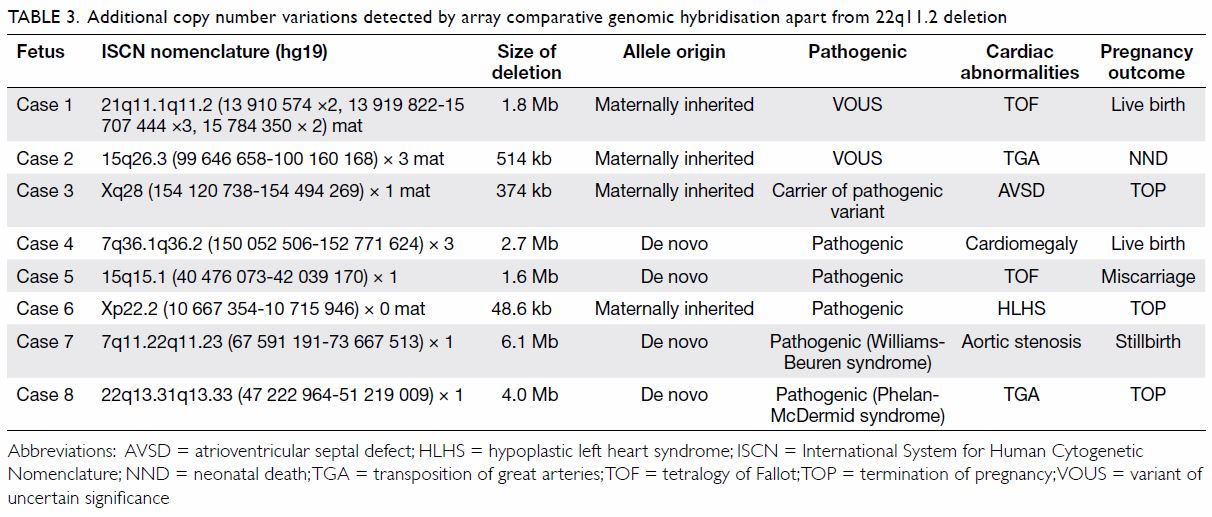
Table 3. Additional copy number variations detected by array comparative genomic hybridisation apart from 22q11.2 deletion
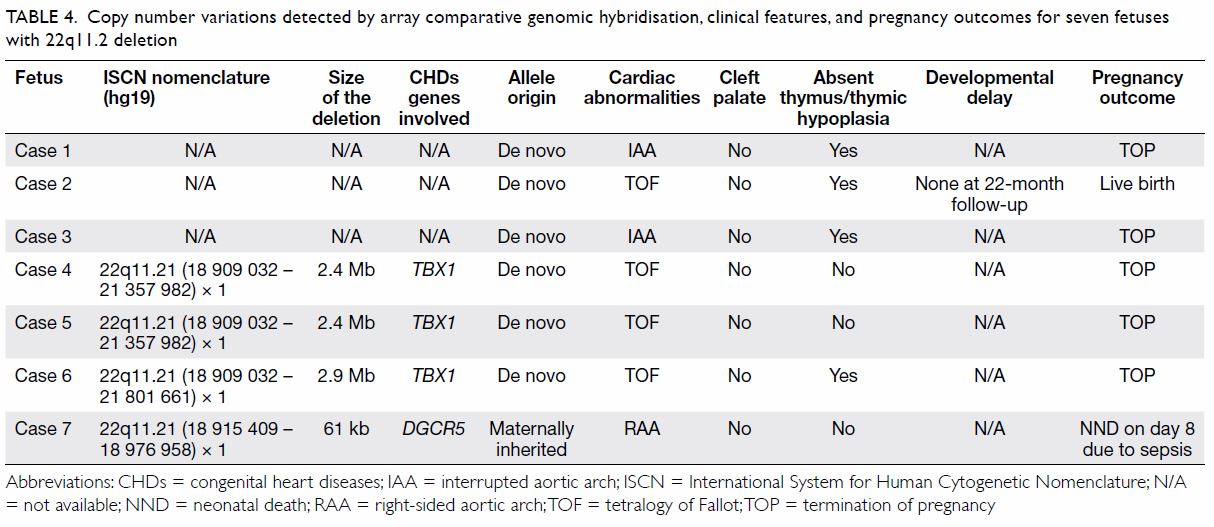
Table 4. Copy number variations detected by array comparative genomic hybridisation, clinical features, and pregnancy outcomes for seven fetuses with 22q11.2 deletion
Among the whole cohort of 254 patients with
prenatal ultrasound diagnosis of CHDs, 101 (39.8%) patients had their
pregnancies terminated. There were 134 (52.8%) live births, nine (3.5%)
neonatal deaths, and four (1.6%) intrauterine deaths or miscarriages. Six
(2.4%) patients were lost for followup and could not be contacted for
their pregnancy outcomes.
Discussion
The data from this cohort demonstrated that 24.2%
of fetuses with CHDs detected by antenatal ultrasound were found to have
chromosomal abnormalities. The frequency of chromosomal abnormality in
fetuses with CHDs is much higher than the frequency of such abnormalities
in infants, because a large portion of these fetuses are terminated. A
2004 review found that up to 33% of fetal CHDs were associated with
chromosomal abnormalities1; this is
much higher than the prevalence in our cohort for two reasons. Firstly,
subtle defects such as right-sided aortic arch, persistent left superior
vena cava, and aberrant right subclavian artery were not included as CHDs
in the previous review. With advances in the ultrasonography resolution,
these subtle defects are detected with increasing frequency in recent
years. In the current cohort, up to 45 cases belong in this category, but
only four of them were found to have chromosomal abnormalities. Secondly,
most of our patients had combined biochemical screening or cell-free DNA
test in the first trimester for Down syndrome screening. If the screening
test was positive, an invasive test was performed and management offered
accordingly. Fetal CHDs may not be detectable at that early gestation, and
obstetricians may not have been focused on detecting cardiac abnormalities
at that time. Therefore, the true prevalence of chromosomal abnormalities
in CHDs in fetuses with common aneuploidies may be underestimated in our
cohort.
In the present study, non-conotruncal CHDs were
found to have a higher prevalence of chromosomal abnormalities than
conotruncal CHDs. Some types of CHDs, such as atrioventricular septal
defects and hypoplastic left heart syndrome, are associated with a higher
prevalence of chromosomal abnormalities than others, whereas some types of
CHDs, such as truncus arteriosus, are rarely associated with chromosomal
abnormalities. Invasive testing for karyotyping is generally recommended
for antenatally diagnosed CHDs, as the prevalence of chromosomal
abnormalities is up to 24.2%. Non-invasive prenatal testing may be
performed instead of karyotyping for some isolated cardiac abnormalities,
such as isolated small ventricular septal defects (VSDs), persistent left
superior vena cava, and aberrant right subclavian artery, when the purpose
is to exclude major aneuploidies such as trisomy 21.
The 22q11.2 deletion syndrome is also called
DiGeorge syndrome or velo-cardio-facial syndrome. Most patients with this
syndrome have a 1.5- to 3-Mb hemizygous deletion at chromosome 22q11.2
causing TBX1, CRKL, and MAPK1 gene
haploinsufficiency.18 This
syndrome is characterised by cardiac defects, cleft palate, thymic
hypoplasia, immune deficiency, hypocalcaemia, and learning difficulties.19 It has more than 180 associated
phenotypic features, with very variable genotype-phenotype correlations.
Congenital heart diseases remain one of the most important clinical
manifestations, and are present in 75% of patients with 22q11.2 deletion.19 The most common abnormalities
are conotruncal CHDs, among which tetralogy of Fallot (TOF) is the most
common.14 20 However, 22q11.2 deletion has also been reported in
patients with non-conotruncal CHDs such as isolated VSD.13 14 In a
cross-sectional survey of 392 patients with CHDs, the prevalence of
22q11.2 deletion was only 1.27%. Four out of the five confirmed patients
had conotruncal CHDs (interrupted aortic arch, truncus arteriosus, and
TOF); the other patient had non-conotruncal CHDs (VSD plus atrial septal
defect). Two patients had congenital extracardiac anomaly (one with arched
palate and micrognathia and one with hypertelorism).21 In a survey of 125 consecutive children in South
Africa with CHDs, the prevalence of 22q11.2 deletions was 4.8%. The
cardiac abnormalities in these confirmed patients included four with
conotruncal CHDs (tricuspid atresia with interrupted aortic arch,
tricuspid atresia with right-sided aortic arch, TOF, and VSD with
right-sided aortic arch), but also two isolated VSDs.22 The above two studies suggest that most patients with
22q11.2 deletions have conotruncal CHDs; although non-conotruncal CHDs are
possible, the prevalence is low.
The prevalence of 22q11.2 deletions in the Chinese
population has not been well documented. A study of 113 Chinese fetuses
with CHDs found that the frequency of 22q11.2 deletion was 5.3%.23 A recent study surveyed the prevalence of undiagnosed
22q11.2 deletions in 156 adult Hong Kong Chinese patients with conotruncal
CHDs by screening for 22q11.2 deletion syndrome using fluorescence
polymerase chain reaction and FISH. Eighteen (11.5%) patients were
diagnosed with 22q11.2 deletion syndrome, translating into one previously
unrecognised diagnosis of 22q11.2 deletion syndrome in every 10 adults
with conotruncal CHDs. Extracardiac manifestations in these affected
individuals included velopharyngeal incompetence or cleft palate (44%),
hypocalcaemia (39%), neurodevelopmental anomalies (33%), thrombocytopenia
(28%), psychiatric disorders (17%), epilepsy (17%), and hearing loss
(17%). Those authors concluded that underdiagnosis in Chinese adults is
common and recognition of facial dysmorphic features can be affected by
age and ethnicity. Facial dysmorphic features may not be reliably
recognised in adult patients with CHDs in the clinical setting; therefore,
referral for genetic evaluation and molecular testing for 22q11.2 deletion
syndrome should be offered to patients with conotruncal CHDs.12
In contrast, in a small Chinese series, the
frequency of 22q11.2 deletion in three Chinese ethnic groups (Tai, Bai,
and Han people) with 19 sporadic CHDs was studied using genotype and
haplotype analysis with D22S420 in 11 consecutive polymorphic
microsatellite markers. Within this cohort, deletions at D22S944 were
found in two of four patients with TOF, one of five patients with VSD, and
one of five patients with patent ductus arteriosus. Those authors
concluded that sporadic 22q11.2 deletion could be detected in isolated
TOF, VSD, and patent ductus arteriosus in Chinese ethnic groups without
relevant family history of CHDs.13
The present study includes a larger sample size (207 fetuses) than the
previous two Chinese studies, but the detected prevalence of 22q11.2
deletion was only 3.4%. In addition, all seven fetuses with confirmed
22q11.2 deletion in the present study had conotruncal CHDs; none had
non-conotruncal CHDs or isolated VSD. The inclusion of patent ductus
arteriosus in the second study as CHDs is inconsistent with other studies.
Therefore those findings of 22q11.2 deletion associated with isolated CHDs
should be further evaluated in other populations.
The prevalence of 22q11.2 deletion in the present
study was 3.4% (7/207), which is comparable to that reported in the
literature. Because all patients had either 22q11FISH or aCGH testing, the
possibility of underdiagnosis was minimised. The cardiac abnormalities
identified in the confirmed cases were all conotruncal CHDs typical of
22q11.2 deletion syndrome. The deletions were not found in any cases with
non-conotruncal CHDs, suggesting that the occurrence of 22q11.2 deletion
in non-conotruncal CHDs in the local population is very low.
Array comparative genomic hybridisation is a
molecular cytogenetic technique to detect any CNVs within the genome. A
systematic review and meta-analysis on the use of aCGH on fetal CHDs that
included 1131 cases showed that the incremental yield of aCGH in detecting
CNVs after karyotyping and 22q11FISH analysis was 7%. An incremental yield
of 12% was found when 22q11.2 deletion cases were included.24 In the present study, aCGH detected four cases of
22q11.2 deletion and eight additional cases of CNVs. On the basis of the
deletion size in the four cases of 22q11.2 deletion, three should also be
detected by 22q11FISH; only the 61-kb deletion would not be detectable by
FISH. Therefore, if all patients in our cohort had karyotyping only
without 22q11FISH, aCGH would have an incremental yield of 6.0% (12/207).
If all our patients had karyotyping and 22q11FISH as first line, then aCGH
would have a further incremental yield of 4.3% (9/207). This incremental
rate for aCGH was lower than that reported previously.24 For patients in Hong Kong, aCGH is a self-financed
option. If fetal CHDs are detected antenatally, invasive testing with
karyotype and aCGH is offered to the patient on the basis of the potential
incremental yield of aCGH. In the present study, counselling for patients
whose fetus has Williams-Beuren syndrome or Phelan-McDermid syndrome would
be different from that for patients whose fetus has isolated cardiac
defects, as there would be other extracardiac manifestation such as mental
retardation. However, if patient declines self-paid aCGH, 22q11FISH should
be offered in addition to conventional karyotyping, because karyotyping
cannot readily detect 22q11.2 deletion.
Limitations
This study may have underestimated the prevalence
of chromosomal abnormalities, because 47 of our patients did not have
chromosomal analysis performed, 30 of whom were counselled as having minor
cardiac abnormalities or were normal variants (14 fetuses had isolated
small VSD, 10 had persistent left superior vena cava, four had right-sided
aortic arch, and two had aberrant right subclavian artery). However, none
of the babies were suspected or diagnosed to have chromosomal
abnormalities or DiGeorge syndrome after clinical assessment by
paediatrician after birth. Therefore, we assumed that there were no major
clinically significant chromosomal abnormalities in these babies.
Although the prevalence of 22q11.2 deletion is low,
testing for 22q11.2 deletion should be offered for fetuses with
conotruncal CHDs. Array comparative genomic hybridisation has an
additional incremental yield of around 5% on other microdeletions apart
from 22q11.2 deletion, and should be offered in addition to karyotyping
and 22q11FISH.
Author contributions
All authors had full access to the data,
contributed to the study, approved the final version for publication, and
take responsibility for its accuracy and integrity.
Concept or design of the study: CW Kong, WWK To.
Acquisition of data: CW Kong, YKY Cheng.
Analysis or interpretation of data: CW Kong, YKY Cheng, WWK To, TY Leung.
Drafting of the manuscript: CW Kong.
Critical revision for important intellectual content: YKY Cheng, WWK To, TY Leung.
Acquisition of data: CW Kong, YKY Cheng.
Analysis or interpretation of data: CW Kong, YKY Cheng, WWK To, TY Leung.
Drafting of the manuscript: CW Kong.
Critical revision for important intellectual content: YKY Cheng, WWK To, TY Leung.
Conflicts of interest
All authors have disclosed no conflicts of
interest.
Declaration
The findings of this study were presented as poster
presentation in the 17th World Congress in Fetal Medicine, Athens, Greece,
24-28 June 2018.
Funding/support
This research received no specific grant from any
funding agency in the public, commercial or not-for-profit sectors.
Ethics approval
Ethics approval for this study was granted by the
Kowloon Central/ Kowloon East Research Ethics Committee
(KC/KE-17-0183/ER-3) and the Joint CUHK-NTEC Clinical Research Ethics
Committee (NTEC-2017-0336). As this study was a retrospective review, the
need for individual patient consent was waived by the above two research
ethics committees.
References
1. Wimalasundera RC, Gardiner HM.
Congenital heart disease and aneuploidy. Prenat Diagn 2004;24:1116-22. Crossref
2. Hartman RJ, Rasmussen SA, Botto LD, et
al. The contribution of chromosomal abnormalities to congenital heart
defects: a population-based study. Pediatr Cardiol 2011;32:1147-57. Crossref
3. Ferencz C, Neill CA, Boughman JA, Rubin
JD, Brenner JI, Perry LW. Congenital cardiovascular malformations
associated with chromosome abnormalities: an epidemiologic study. J
Pediatr 1989;114:79-86. Crossref
4. Kidd SA, Lancaster PA, McCredie RM. The
incidence of congenital heart defects in the first year of life. J
Paediatr Child Health 1993;29:344-9. Crossref
5. Harris JA, Francannet C, Pradat P,
Robert E. The epidemiology of cardiovascular defects, part 2: a study
based on data from three large registries of congenital malformations.
Pediatr Cardiol 2003;24:222-35. Crossref
6. Schellberg R, Schwanitz G, Grävinghoff
L, et al. New trends in chromosomal investigation in children with
cardiovascular malformations. Cardiol Young 2004;14:622-9. Crossref
7. Reller MD, Strickland MJ,
Riehle-Colarusso T, Mahle WT, Correa A. Prevalence of congenital heart
defects in metropolitan Atlanta, 1998-2005. J Pediatr 2008;153:807-13. Crossref
8. Geng J, Picker J, Zheng Z, et al.
Chromosome microarray testing for patients with congenital heart defects
reveals novel disease causing loci and high diagnostic yield. BMC Genomics
2014;15:1127. Crossref
9. Zhu X, Li J, Ru T, et al. Identification
of copy number variations associated with congenital heart disease by
chromosomal microarray analysis and next-generation sequencing. Prenatal
Diagn 2016;36:321-7. Crossref
10. Zaidi S, Brueckner M. Genetics and
genomics of congenital heart disease. Circ Res 2017;120:923-40. Crossref
11. Rosa RF, Pilla CB, Pereira VL, et al.
22q11.2 Deletion syndrome in patients admitted to a cardiac pediatric
intensive care unit in Brazil. Am J Med Genet A 2008;146A:1655-61. Crossref
12. Liu AP, Chow PC, Lee PP, et al.
Under-recognition of 22q11.2 deletion in adult Chinese patients with
conotrunal anomalies: implications in transitional care. Eur J Med Genet
2014;57:306-11. Crossref
13. Jiang L, Duan C, Chen B, et al.
Association of 22q11 deletion with isolated congenital heart disease in
three Chinese ethnic groups. Int J Cardiol 2005;105:216-23. Crossref
14. Wozniak A, Wolnik-Brzozowska D,
Wisniewska M, et al. Frequency of 22q11.2 microdeletion in children with
congenital heart defects in western Poland. BMC Pediatr 2010;10:88. Crossref
15. Kan AS, Lau ET, Tang WF, et al.
Whole-genome array CGH evaluation for replacing prenatal karyotyping in
Hong Kong. PLoS One 2014;9:e87988. Crossref
16. Leung TY, Vogel I, Lau TK, et al.
Identification of submicroscopic chromosomal aberrations in fetuses with
increased nuchal translucency and apparently normal karyotype. Ultrasound
Obstet Gynecol 2011;38:314-9. Crossref
17. von Elm E, Altman DG, Egger M, Pocock
SJ, Gøtzsche PC, Vandenbroucke JP; STROBE Initiative. The Strengthening
the Reporting of Observational Studies in Epidemiology (STROBE) statement:
guidelines for reporting observational studies. Epidemiology
2007;18:800-4. Crossref
18. Koczkowska M, Wierzba J, Śmigiel R, et
al. Genomic findings in patients with clinical suspicion of 22q11.2
deletion syndrome. J Appl Genet 2017;58:93-8. Crossref
19. Digilio M, Marino B, Capolino R,
Dallapiccola B. Clinical manifestations of Deletion 22q11.2 syndrome
(DiGeorge/Velo-Cardio-Facial syndrome). Images Paediatr Cardiol
2005;7:23-34.
20. Lammer EJ, Chak JS, Iovannisci DM, et
al. Chromosomal abnormalities among children born with conotruncal cardiac
defects. Birth Defects Res A Clin Mol Teratol 2009;85:30-5. Crossref
21. Huber J, Peres VC, de Castro AL, et
al. Molecular Screening for 22Q11.2 deletion syndrome in patients with
congenital heart disease. Pediatr Cardiol 2014;35:1356-62. Crossref
22. De Decker R, Bruwer Z, Hendricks L,
Schoeman M, Schutte G, Lawrenson J. Predicted v. real prevalence of the
22q11.2 deletion syndrome in children with congenital heart disease
presenting to Red Cross War Memorial Children’s Hospital, South Africa: a
prospective study. S Afr Med J 2016;106(6 Suppl 1):S82-6. Crossref
23. Lv W, Wang S. Detection of chromosomal
abnormalities and the 22q11 microdeletion in fetuses with congenital heart
defects. Mol Med Rep 2014;10:2465-70.
24. Jansen FA, Blumenfeld YJ, Fisher A, et
al. Array comparative genomic hybridization and fetal congenital heart
defects: a systematic review and meta-analysis. Ultrasound Obstet Gynecol
2015;45:27-35. Crossref