Multicentre study of hospitalised patients with sports- and recreational cycling–related traumatic brain injury in Hong Kong
© Hong Kong Academy of Medicine. CC BY-NC-ND 4.0
ORIGINAL ARTICLE CME
Multicentre study of hospitalised patients
with sports- and recreational cycling–related traumatic brain injury in Hong Kong
Peter YM Woo, MMedSc, FRCS1; Eric Cheung, MRCS1; Fion WY Lau, MB, ChB1; Nancy WS Law, MB, ChB1; Carly KY Mak, MB, ChB1; Peony Tan, BMed MD1; Bertrand Siu, MB, BS1; Anson Wong, MB, ChB1; Calvin HK Mak, MB, BS, FRCS2; KY Chan, FRCS1; KY Yam, FRCS3; KY Pang, FRCS4; YC Po, FRCS5; WM Lui, FRCS6; Danny TM Chan, FRCS7; WS Poon, FRCS, PhD7
1 Department of Neurosurgery, Kwong Wah Hospital, Hong Kong
2 Department of Neurosurgery, Queen Elizabeth Hospital, Hong Kong
3 Department of Neurosurgery, Tuen Mun Hospital, Hong Kong
4 Department of Neurosurgery, Pamela Youde Nethersole Eastern Hospital, Hong Kong
5 Department of Neurosurgery, Princess Margaret Hospital, Hong Kong
6 Division of Neurosurgery, Department of Surgery, Queen Mary Hospital, Hong Kong
7 Division of Neurosurgery, Department of Surgery, Prince of Wales Hospital, Hong Kong
Corresponding author: Dr Peter YM Woo (wym307@ha.org.hk)
 Full paper in PDF
Abstract
Introduction: Cycling is associated with a greater
risk of traumatic brain injury (TBI) than other
recreational activities. This study aimed to investigate
the epidemiology of sports-related TBI in Hong
Kong and to examine predictors for recreational
cycling-induced intracranial haemorrhage.
Methods: This retrospective multicentre study
included patients diagnosed with sports-related TBI
in public hospitals in Hong Kong from 2015 to 2019.
Computed tomography scans were reviewed by an
independent assessor. The primary endpoint was
traumatic intracranial haemorrhage. The secondary
endpoint was an unfavourable Glasgow Outcome
Scale (GOS) score at discharge from hospital.
Results: In total, 720 patients were hospitalised with
sports-related TBI. The most common sport was
cycling (59.2%). The crude incidence of cycling-related
TBI was 1.1 per 100 000 population. Cyclists were
more likely to exhibit intracranial haemorrhage and
an unfavourable GOS score, compared with patients
who had TBI because of other sports. Although 47%
of cyclists had intracranial haemorrhage, only 15%
wore a helmet. In multivariate analysis, significant
predictors for intracranial haemorrhage were age
≥60 years, antiplatelet medication, moderate or
severe TBI, and skull fracture. Among 426 cyclists,
375 (88%) had mild TBI, and helmet wearing
was protective against intracranial haemorrhage,
regardless of age, antiplatelet medication intake, and
mechanism of injury. Of 426 cyclists, 31 (7.3%) had
unfavourable outcomes on discharge from hospital.
Conclusions: The incidence of sports-related TBI
is low in Hong Kong. Although cycling-related head injuries carried greater risks of intracranial
haemorrhage and unfavourable outcomes compared
with other sports, most cyclists experienced good
recovery. Helmet wearing among recreational
cyclists with mild TBI was protective against
intracranial haemorrhage and skull fracture.
New knowledge added by this study
- The incidence of sports-related traumatic brain injury (TBI) is lower in Hong Kong than in other countries or regions; cycling is the sport most frequently associated with TBI.
- A greater proportion of hospitalised patients with cycling-related TBI had intracranial haemorrhage and unfavourable functional outcomes, compared with patients who had TBI because of other sports. Risk factors for intracranial haemorrhage were older age (>60 years), antiplatelet medication intake, moderate or severe TBI, and skull fracture.
- Only 15% of hospitalised patients with cycling-related TBI wore a helmet at the time of injury; none of the patients who died had been wearing a helmet.
- The lack of an independent association with motor vehicle collisions suggests that recreational cycling at comparatively low speeds without protective head gear can be fatal.
- Cycling is becoming increasingly popular, but Hong Kong is one of the most dangerous regions in the world for cyclists in terms of fatality rate.
- Public health policies that improve bicycle rider safety (eg, mandatory helmet legislation) should be deliberated. Although helmet wearing is protective against intracranial haemorrhage for mild TBI individuals, the rate of its adoption is low.
- Measures to control the risk of sports-related TBI should be carefully considered when designing public health policies to promote sports engagement.
Introduction
Considerable physical and psychosocial benefits are
associated with participation in sporting activities.1 2
Physical activity has been demonstrated to reduce
the risks of coronary heart disease, some cancers,
obesity, hypertension, and type 2 diabetes mellitus.2 3 4 5 6
Its obvious merits have prompted several national
health programmes, including the health programme
in Hong Kong, to promote sports to the general
public.7 8 9 However, sports participation carries a risk
of injury, especially traumatic brain injury (TBI). It
has been estimated that 20% of all TBIs are sports-related.10 In addition, up to 20% of sports-related
TBI survivors (usually adolescents or young adults)
experience chronic symptoms including headache,
fatigue, and cognitive and balance difficulties.11 There
is a global trend of increasing sports-related TBI
incidence: from 3.5 to 31.5 per 100 000 population
in the past decade.12 13 Because many patients with
mild TBI do not seek medical attention, these
figures likely underestimate the total burden of this
condition.13 Population-based studies reviewing
sports-related TBI are sparse; most target specific
groups of individuals (eg, professional athletes) or
rely on self-reporting surveys that lack a uniform
definition and comprehensive assessment of brain
injury.14 For similar reasons, studies reviewing
outcome predictors have also been inadequate, thus
hindering the generation of meaningful conclusions
to guide governmental policy initiatives.14
Hong Kong is highly urbanised with an
established public transport system, such that cycling
is mainly regarded as a recreational activity.15 16 In
terms of fatality rate, Hong Kong is among the most
dangerous areas for cycling, compared with other
cities such as New York, the US, or countries such as
France.17
This study was performed to document the
epidemiology of sports-related TBI among patients
who required inpatient care by adopting territory-wide
uniform diagnostic coding criteria, clear data
definitions, and systematic assessments of radiologic
findings. Because cycling is a popular sport in Hong
Kong, factors predictive of intracranial haemorrhage
(eg, the effect of helmet use) and poor functional
outcomes among cyclists hospitalised with TBI were
determined.
Methods
Patients who required inpatient care at any Hospital
Authority institution for sports-related TBI
from 1 January 2015 to 31 December 2019 were
reviewed. The Hospital Authority is a public health
service highly subsidised by the Hong Kong SAR
Government; it is responsible for 90% of inpatient
bed days in the city. Patients were identified by
the International Classification of Diseases, Tenth Revision, Clinical Modification code (ICD-10-CM)
designation for TBI 854.0 secondary to a sports-related
external cause (E codes: E006-10). Data
from clinical records, operation notes, medication
prescriptions, and computed tomography (CT)
brain scans from a central digital imaging repository
were reviewed. In particular, the type of sport played,
the clinical presentation of symptoms, the Injury
Severity Score (ISS), the need for neurosurgery,
length of hospitalisation, and diagnosis of post-concussion
syndrome were recorded. Head injury
was classified into mild (presenting Glasgow Coma
Scale [GCS] score, 14-15); moderate (presenting
GCS score, 9-13), and severe (presenting GCS
score, 3-8), in accordance with criteria established
by the Neurotraumatology Committee of the World
Federation of Neurosurgical Societies.18 Post-concussion
syndrome was defined in accordance
with ICD-10 criteria. This required a 4-week duration
of symptoms from at least three categories following
a traumatic loss of consciousness. The symptom
categories were headache, irritability, concentration
impairment, insomnia, and a preoccupation with
the aforementioned symptoms. For neurosurgical
patients with cycling related–TBI, the mechanism
of injury and their experience level (ie, professional
athlete or amateur rider) were documented. All CT scans were reviewed by an independent assessor with
6 months of neurosurgical training experience who
was blinded to the patients’ clinical characteristics
and outcomes. The scans were first evaluated using the
Rotterdam CT score, a commonly utilised validated
radiological assessment system for the prognosis of
patients with TBI. The classification has four distinct
elements that require the appraisal of the degree of
basal cistern obliteration, degree of midline shift,
the presence (or absence) of an epidural mass lesion,
and the presence (or absence) of intraventricular or
traumatic subarachnoid haemorrhage (Table 1). In
addition, the scans were assessed for skull fractures,
cerebral contusions, and acute subdural haematomas
(ASDHs). The primary outcome of the study was
the presence of intracranial haemorrhage on the
admitting CT scan. All potential predictors were
categorised into patient-related, trauma-related, and
radiological factors. The secondary outcome was
unfavourable functional performance, defined as a
Glasgow Outcome Scale (GOS) score of 3 to 5 on
discharge from the hospital (3, severe disability; 4,
persistent vegetative state; and 5, death).
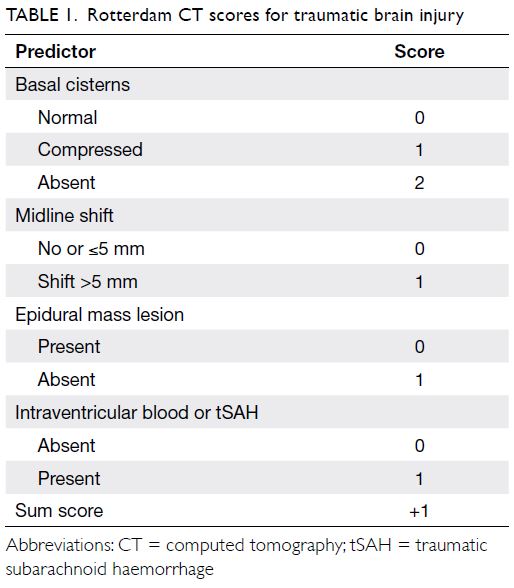
Table 1. Rotterdam CT scores for traumatic brain injury
Statistical analyses utilised the Chi squared
test and Fisher’s exact test were used for categorical
data such as patient gender or the use of antiplatelet
medication. Independent-samples t test was used
for continuous data such as patient age or duration
of hospitalisation. Multivariate binary logistic
regression was used to identify independent factors
for the presence (or absence) of traumatic intracranial
haemorrhage. A P value of <0.05 was considered
statistically significant. Statistical analysis was
conducted using SPSS (Windows version 20.0; IBM
Corp, Armonk [NY], US).
Results
Overall characteristics of patients with
sports-related traumatic brain injury during the study period
In total, 720 consecutive patients were hospitalised
with sports-related TBI during the 5-year study
period, and 705 (97.9%) of them were admitted
under neurosurgical care. This was equivalent
to a crude incidence of 1.9 per 100 000 general
population. The mean (± standard deviation [SD])
age was 32 ± 19 years; 521 (72.4%) patients were
adults (≥18 years) and 568 (78.9%) were male. The
most common sport was cycling (59.2%), followed
by football (21.3%) and basketball (7.5%) [Fig a].
On admission, most (86.1%) patients were fully
conscious. Overall, 658 (91.4%) patients had mild
TBI, 41 (5.7%) patients had moderate TBI, and
21 (2.9%) patients had severe TBI. Post-traumatic
seizures occurred in 36 (5.0%) patients. Furthermore,
324 (45.0%) patients had a loss of consciousness and
269 (37.4%) patients experienced post-traumatic
retrograde amnesia. Only 19 (2.6%) patients
were taking either antiplatelet or anticoagulant
medication. Extracranial injuries were sustained
by 208 (28.9%) patients; among them, injuries were
mainly either limb abrasions or contusions (62.1%).
The median ISS was 2 (interquartile range=2-8).
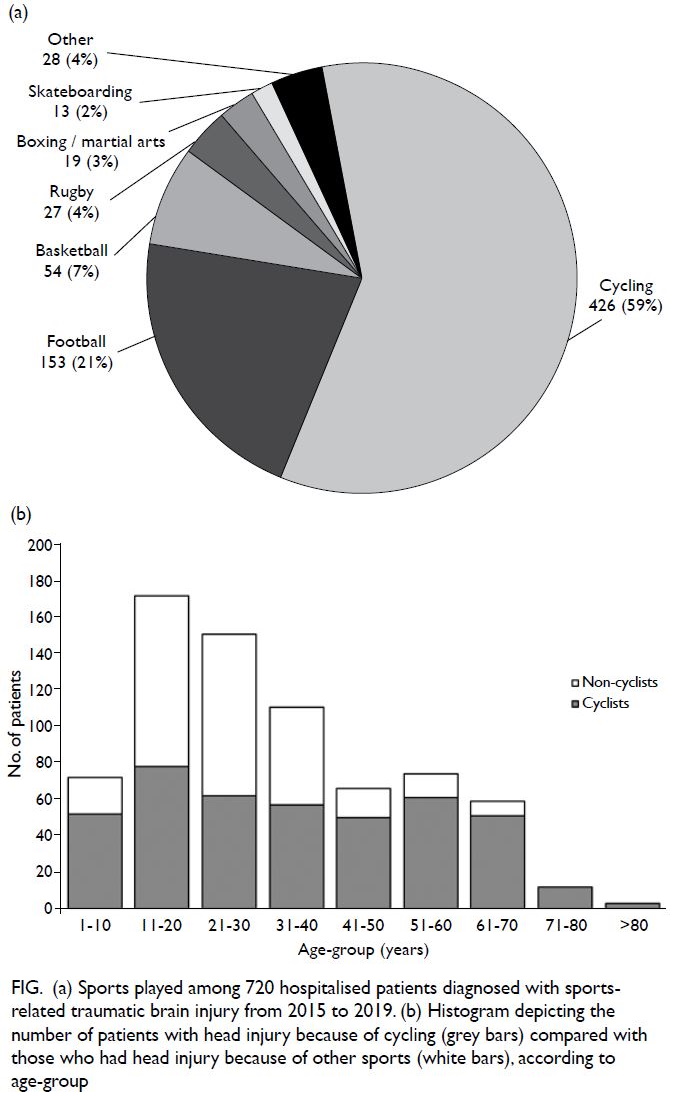
Figure. (a) Sports played among 720 hospitalised patients diagnosed with sports-related traumatic brain injury from 2015 to 2019. (b) Histogram depicting the number of patients with head injury because of cycling (grey bars) compared with those who had head injury because of other sports (white bars), according to age-group
Intracranial haemorrhage was noted in 283 (39.3%) patients with TBI; 166 (23.1%) patients
exhibited traumatic subarachnoid haemorrhage and
157 (21.8%) exhibited ASDH. Skull fractures were
detected in 179 (24.9%) patients, with a median
Rotterdam CT score of 2 (interquartile range=2-2).
In total, 59 (8.2%) patients required neurosurgical
intervention; 32 (54.2%) of them had good recovery
with a median GOS score of 5 on discharge from
the hospital and at 6 months. The mean (± SD)
duration of hospitalisation was 5 ± 28 days. Among
307 (42.6%) patients in whom 6-month GOS scores
could be assessed, good recovery was observed in
260 (84.7%). Post-concussion syndrome was
diagnosed in 30 (6.2%) of 482 patients who attended
scheduled follow-up outpatient consultations.
Recreational cycling-related traumatic brain
injury
The crude incidence of recreational cycling-related
TBI requiring hospitalisation was 1.1 per 100 000
population. A comparison was performed between
cyclists with sports-related TBI and patients who had
TBI because of other sports (Table 2). Cyclists were
significantly older (P<0.001) [Table 2; Fig b]. Among
426 cyclists, 306 (71.8%) were male and 120 (28.2%)
were female. However, the proportion of patients
who were female was significantly higher among
those who had TBI because of cycling (28.2%) than
among those who had TBI because of other sports (10.9%; P<0.001). Cyclists were likely to exhibit more
severe TBI with an almost three-fold greater risk of
sustaining extracranial injury (odds ratio [OR] 2.8;
95% CI: 1.9-4.0), resulting in a higher ISS (P<0.001).
Of cyclists admitted for head injury, 201 (47.2%) had
intracranial haemorrhage, which was radiologically
more extensive in terms of the Rotterdam CT
score, compared with haemorrhage in non-cyclists
(P<0.01). As a consequence, a greater proportion of
cyclists had a worse GOS score on discharge from
hospital (OR 2.8; 95% CI: 1.3-6.2) and at 6 months
(OR 4.7; 95% CI: 2.1-10.5). The cause of death for
all cyclists with 30-day mortality was severe TBI
with medically refractory intracranial hypertension.
Although the overall incidence was low, cyclists also
had a greater risk of post-concussion syndrome (OR
2.5; 95% CI: 1.2-5.4).
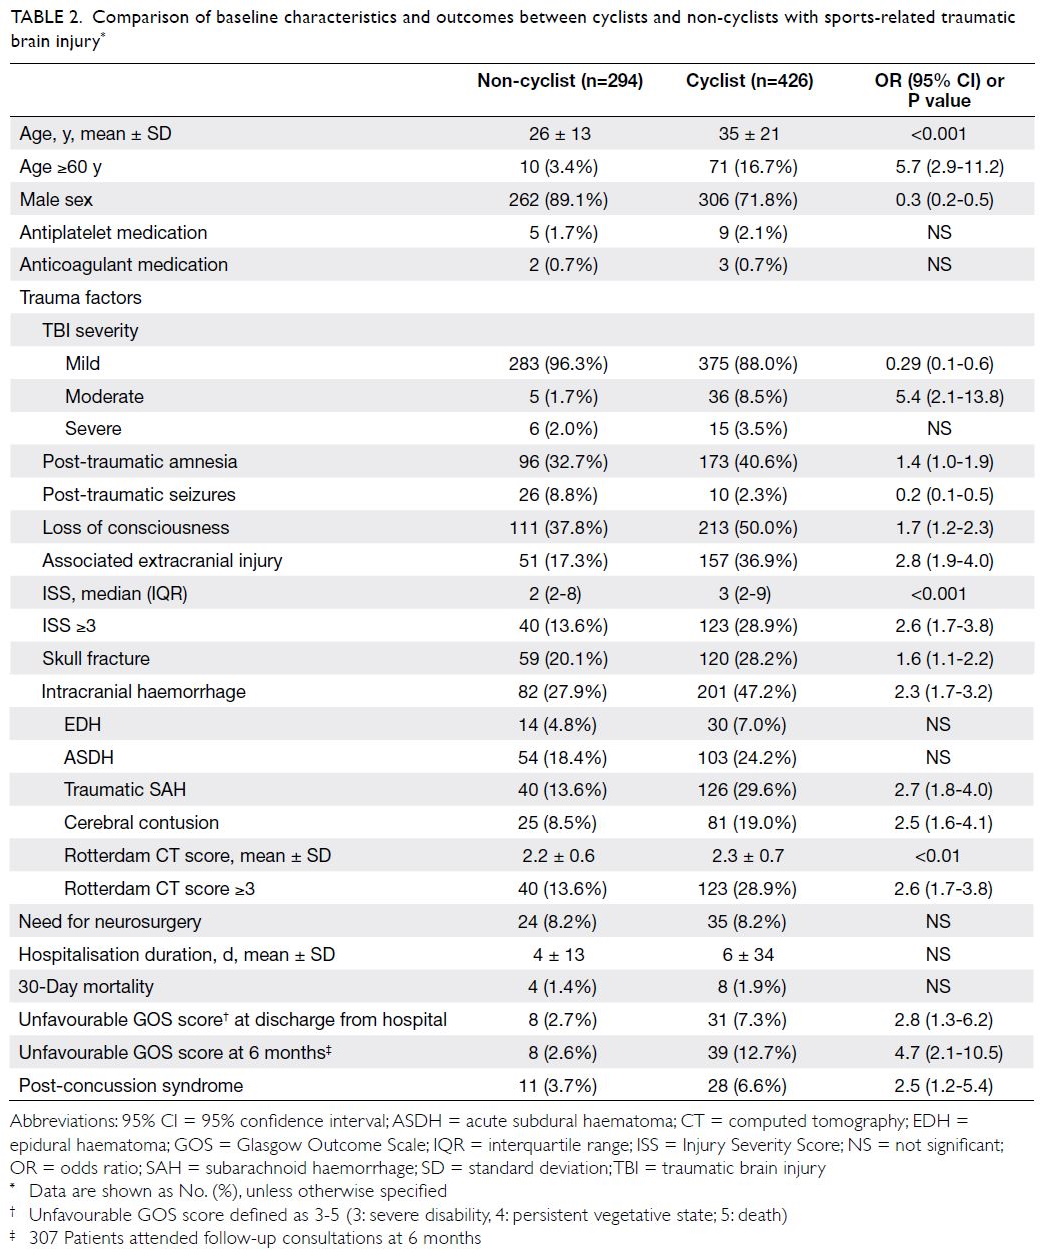
Table 2. Comparison of baseline characteristics and outcomes between cyclists and non-cyclists with sports-related traumatic brain injury
Predictors for traumatic intracranial
haemorrhage and poor functional outcome at
discharge from hospital among cyclists
Among the 426 cyclists in this study, 128 (30.0%)
experienced bicycle accidents during the weekend;
10 (2.3%) of the cyclists were professional athletes.
Most cyclists (273; 64.1%) accidently fell off their
bicycle on their own (ie, without colliding into
another object) on level ground. Of the injuries,
103 (24.2%) were sustained when the cyclist was
traveling downhill; for the 28 patients with records
of self-reported velocities, the estimated mean
(± SD) velocity at the moment before injury was
40 ± 15 km/h. At the time of injury, 361 (84.7%)
cyclists had not been wearing a helmet. Among eight
(1.9%) patients who subsequently died, none had
been wearing protective head gear.
Risk factors for traumatic intracranial haemorrhage among cyclists are shown in Table 3.
Univariate analysis identified the following risk
factors: age ≥60 years, use of antiplatelet medication,
involvement in a motor vehicle collision, presence
of moderate to severe TBI, and skull fracture. In
univariate analysis, helmet wearing was protective
against intracranial haemorrhage. Multivariate
logistic regression identified the following
independent risk factors: age ≥60 years, antiplatelet
medication intake, moderate or severe TBI, and
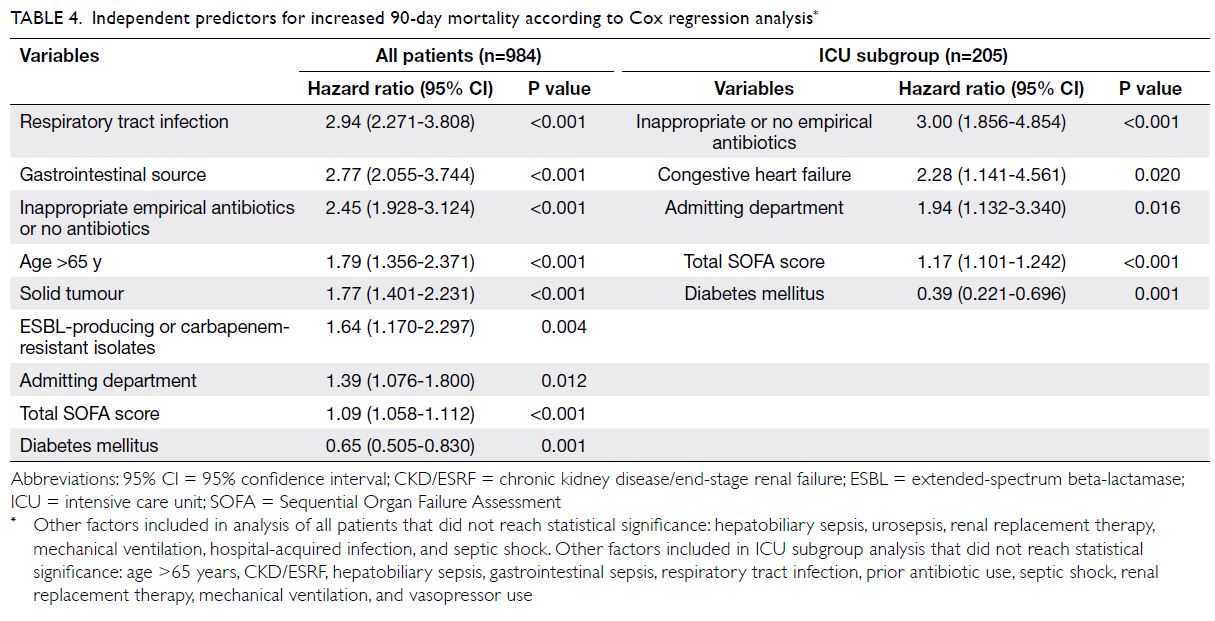
the presence of a skull fracture. Table 4 shows
independent significant predictors for unfavourable
GOS score on discharge from hospital: age ≥60 years,
antiplatelet intake, severe TBI, intracranial
haemorrhage, and the need for neurosurgical
operative intervention.
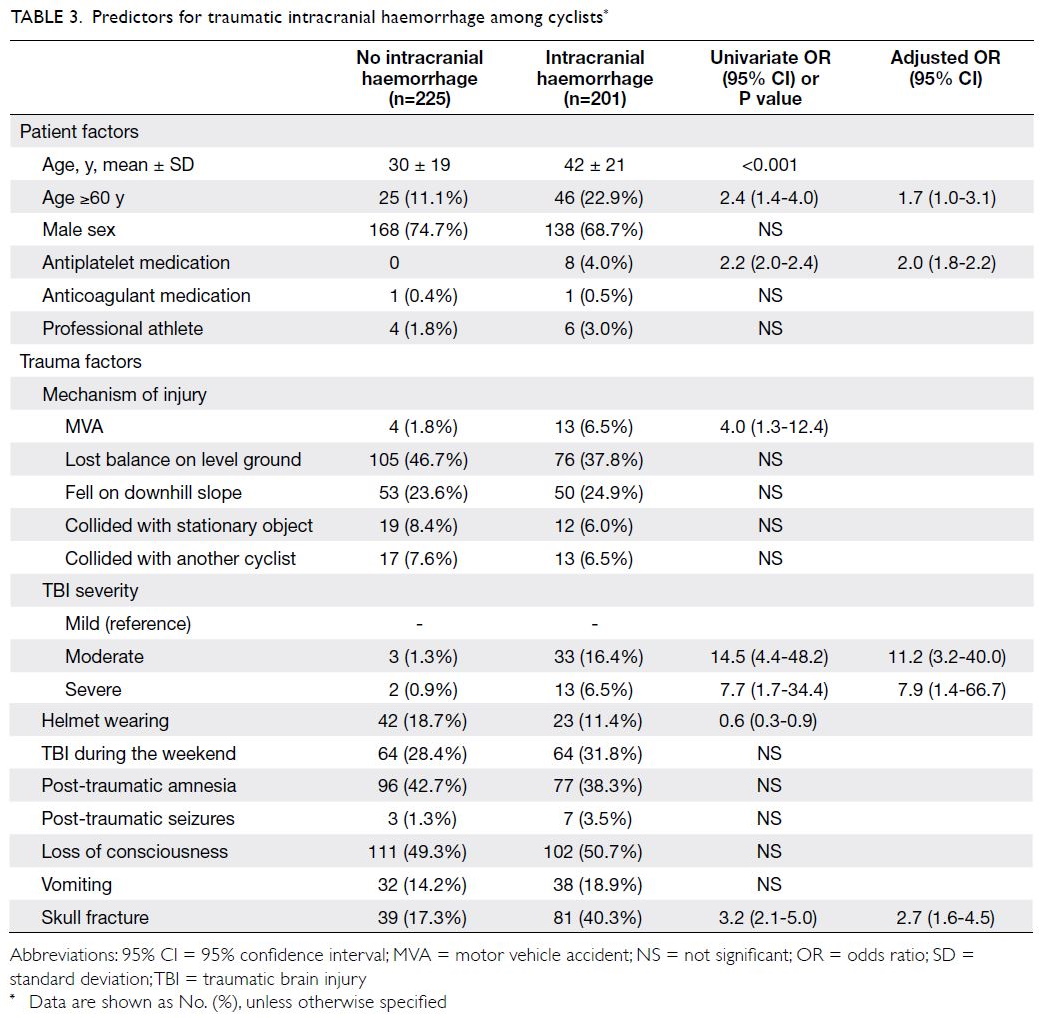
Table 3. Predictors for traumatic intracranial haemorrhage among cyclists
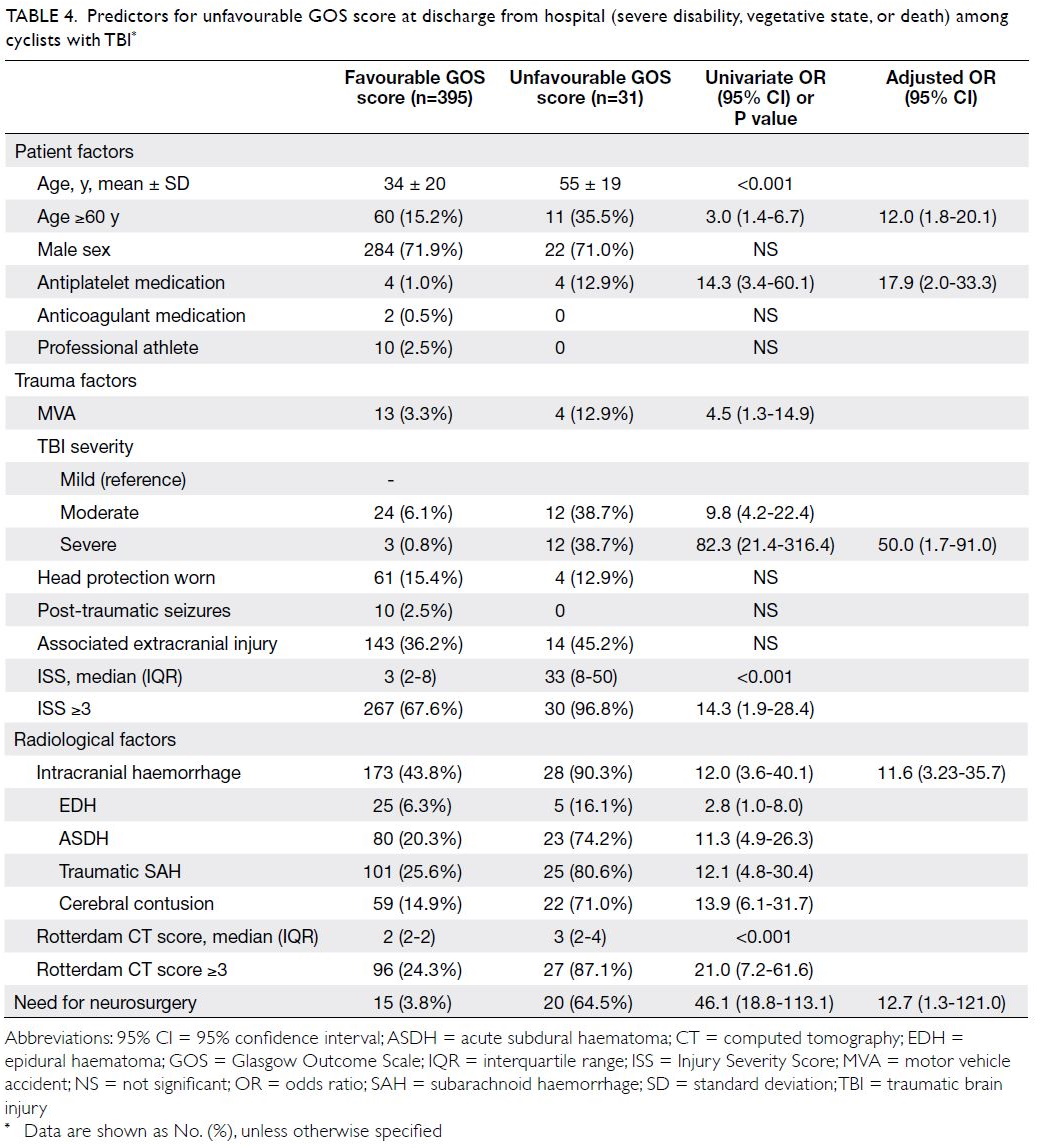
Table 4. Predictors for unfavourable GOS score at discharge from hospital (severe disability, vegetative state, or death) among cyclists with TBI
Effect of helmet use among cyclists
As shown in Table 2, 375 (88.0%) hospitalised cyclists had mild TBI, whereas only 36 (8.5%) cyclists
had moderate TBI and 15 (3.5%) had severe TBI. No protective effect of helmet use was noted in terms
of reducing TBI severity across these GCS-defined
categories (Table 3). However, among cyclists with
mild TBI, helmets were significantly protective
against intracranial haemorrhage and skull fracture,
regardless of age, antiplatelet medication intake, or
mechanism of injury (Table 5). Although the median
Rotterdam CT score was comparable between
cyclists with mild TBI who did or did not wear
helmets (P=0.68), significantly fewer patients with
head protection had epidural haematoma or ASDH.
For patients with mild TBI who had intracranial
haemorrhage, this difference in radiological factors led to a significantly shorter mean (± SD) duration
of hospitalisation for patients who wore helmets
(2.6 ± 2.9 days), compared with patients who did not
(7.1 ± 11.6 days, P<0.001). However, there was no
difference in the need for neurosurgical intervention
among patients with mild TBI who had intracranial
haemorrhage according to head protection status
(P=0.17). Similarly, unfavourable GOS scores on
discharge from hospital (P=0.43) and at 6 months
(P=0.71) were comparable among patients with mild TBI who had intracranial haemorrhage, regardless of
head protection status (Table 5).
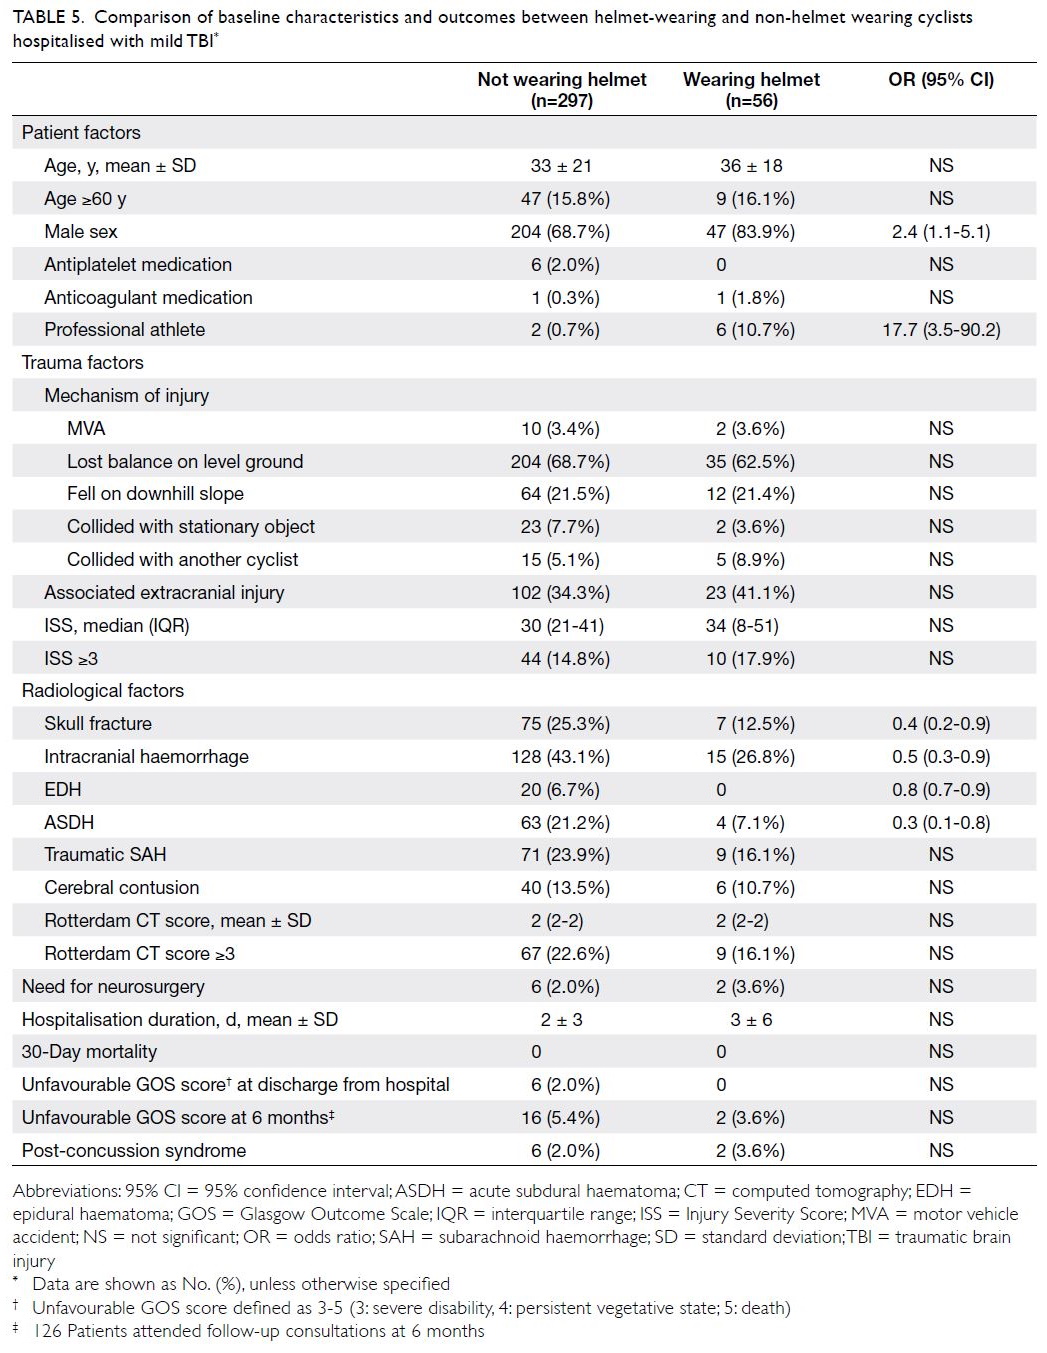
Table 5. Comparison of baseline characteristics and outcomes between helmet-wearing and non-helmet wearing cyclists hospitalised with mild TBI
Discussion
Balancing sports engagement with sports-related
traumatic brain injury
The incidence of sports-related TBI in Hong Kong is 2 per 100 000 general population; this is lower
than in other countries (eg, the US, Australia, or Italy), where the incidences range from 4 to 32 per
100 000 population.12 The lower incidence in Hong
Kong is consistent with a previous finding that Hong
Kong residents (especially children and adolescents)
have lower physical activity and fitness levels than in
other regions, according to a global evidence-based
evaluation of such indicators from 49 countries.19
Considering the health benefits of an active lifestyle,
there is a clear need to promote sports engagement
in Hong Kong. A survey of 5701 residents performed
by the Transport Department of the Hong Kong SAR
Government estimated that 10% of households had
bicycles available for use; moreover, 69% (4 million)
of residents aged 15 years or older knew how to ride
one.16 In addition, most survey respondents (73%) cycled for recreational or fitness purposes.15
Cycling safety outcomes in Hong Kong
Previous epidemiological studies of sports-related
brain injuries revealed that cycling was one of the
most frequent activities involved.10 12 20 21 In 2019,
1738 road traffic accidents involving cyclists were
reported to the Hong Kong Transport Department.22
Half of these accidents (50.6%, 879/1738) occurred
in recreational areas such as cycling tracks, parks,
or playgrounds; eight (0.5%) patients experienced
fatal injuries.22 In the past 10 years, the number of
cyclist injuries in Hong Kong has increased by 5.2%
per year.17 Compared with other regions worldwide,
Hong Kong is one of the most dangerous areas
for cycling.17 The fatality rate (per billion minutes
cycled) in the city was 34, substantially higher than
the rates in Stockholm, Sweden (3), France (4), and other metropolitan areas (eg, New York City [18]
and Los Angeles [8]).17 These studies included riders
primarily involved in commuting and the causes
of death were not elucidated, but they indicate a
growing need to enhance the safety of vulnerable
road users.
To our knowledge, this is the first multicentre
study to comprehensively document the outcomes
of inpatients with recreational cycling-related TBI
using standard assessment criteria. By comparison
with patients who had TBI because of other sports,
we found that cyclists in Hong Kong exhibited greater risks of more severe injury, intracranial
haemorrhage, unfavourable GOS score at discharge
from hospital, and post-concussion syndrome.
Despite these findings, our results suggest that
cycling is generally safe and hospitalised patients had
a high (92.7%) likelihood of favourable functional
outcomes on discharge from hospital.
Single-centre reviews of cycling-related
injuries among various suburban districts in Hong
Kong found that limb injuries were the most
common form of trauma followed by head injury
(10%-39% of patients).23 24 25 26 Among patients with TBI, 16% to 53% exhibited “severe” injury; however, the
studies did not provide explicit definitions to qualify
this categorisation, and did not describe radiological
data regarding the extent of injury or the need
for neurosurgical intervention.23 26 In the present
study, 12% of hospitalised cyclists with head injury had moderate to severe TBI. There was also a high
incidence of intracranial haemorrhage involving
almost half of the patients. Both these factors were
independent predictors of poor GOS score on
discharge from hospital. Our results are consistent
with the findings in a previous study where 75% of all cycling-related deaths were caused by severe
TBI.27 The lack of an independent association with
motor vehicle collisions, which constituted only
a minority of injuries in this cohort, suggests that
recreational cycling at comparatively low speeds can
be fatal. Notably, the mechanism of injury for four
(50%) of the eight recreational cyclists who died in
this study was a loss of balance, followed by a fall on
level ground without colliding into another object,
person, or motor vehicle.
Helmet use: safety and legislative
implications
Previous studies in Hong Kong, the most recent of which was performed >10 years ago, revealed that recreational cyclists rarely wore protective headgear
(eg, frequencies of 0.2% to 2.2% among emergency
department attendees).24 25 26 Our findings revealed that
significantly more patients (15%) wore helmets at the
time of injury. Governmental advocacy initiatives for
promoting helmet wearing in recent years may have
resulted in heightened public awareness regarding
the risks of head trauma.28 There is little doubt
that helmets are protective. In the past 30 years,
several case-control and epidemiological studies
have delivered compelling evidence to support the
efficacy of bicycle helmet wearing in reducing the
risk of life-threatening TBI.29 30 31 32 33 34 35 36 37 In a case-control
prospective multicentre study of over 3000 patients,
Thompson et al33 noted that helmets (irrespective
of design) conferred up to a 74% reduction in TBI
during accidents. A subsequent meta-analysis of five
studies observed that helmets provided a 63% to 88%
reduction in the risk of head, brain, and severe TBI
for all ages of cyclists; this included equal levels of
protection for collisions involving motor vehicles
and collisions due to other causes.38 In the present
study, helmet wearing did not reduce TBI severity
according to our broadly predefined categories.
However, among hospitalised recreational cyclists
with mild head injury, helmets did provide significant
protection against intracranial haemorrhage,
including potentially life-threatening epidural
haematomas and ASDHs, as well as skull fractures.
Thus, our findings may have important public health
implications with regard to introducing mandatory
bicycle helmet wearing legislation in the city.
Whether such laws should exist is a particularly
divisive issue among public health experts and
interest groups.39 40 41 42 43 In Australia, a nation with all-age
helmet wearing safety laws, an overall 46% decline
in cyclist fatalities per 1 000 000 population has been
reported, compared with the pre-legislation period.44
Similar findings were noted in New Zealand: a
67% decline in severe TBI was recorded after the
introduction of helmet laws.45 In the US, a significant
reduction in paediatric cyclist fatalities involving
motor vehicles was observed in states with such laws.46 A meta-analysis of the effectiveness of bicycle
helmet legislation revealed that it increased helmet
usage, while significantly reducing head injuries
and mortality.47 Several medical associations have
expressed support for introducing such legislation;
these include the World Health Organization, the
British Medical Association, the American Medical
Association, and the Royal Australasian College of
Surgeons.48 49 50 51 However, critics of such compulsory
policies have hypothesised that helmets could
encourage risk-compensation behaviour, whereby
cyclists may be more willing to engage in potentially
injurious risks or for motorists to exercise less
caution when encountering them.39 52 53 Other
reasons for opposition include infringement on
individual liberties; some public health scholars have
theorised that such laws could discourage cyclists
from participating in gainful physical activity.39 40 41 42 54
From a Hong Kong Transport Department survey
(5701 respondents) regarding attitudes towards
possible helmet law and enforcement measures, the
majority of respondents (78%-90%) were in favour of
introducing such legislation, especially when riding
on carriageways.16 However, among respondents
who knew how to ride a bicycle (3933 respondents),
23% declared they would ride less frequently if
mandatory helmet wearing was required.16
Limitations
An inherent limitation of a retrospective study of this
nature was the likely under-reporting of the number of
patients with sports-related head injuries. In the only
existing population-based study of TBI epidemiology
that included community-based injuries, 95% were
considered mild and 28% of respondents did not
seek medical attention.55 Among professional or
university-level athletes, under-reporting is more
apparent: questionnaire surveys reveal that 31% to
78% of respondents neglected to pursue medical
care despite experiencing a concussion during
the preceding 12 months.56 57 At the emergency
department level, no territory-wide TBI registry
exists in Hong Kong; moreover, diagnostic coding
to facilitate data retrieval is typically not performed
after consultations. Therefore, we could only identify
hospitalised patients with sports-related TBI by
means of an administrative database that utilised
the ICD-10 coding system. However, the validity
of such administrative data for research has been
questioned.58 Studies have shown significantly lower
TBI rates among young adults, men, and patients
with less severe injuries when the ICD system was
utilised, compared with thorough medical record
review.59 Analysis of a population-based TBI sample
showed that only 19% of individuals were assigned
a TBI-related diagnostic ICD code.60 In addition, a
degree of selection bias may have existed because
some non-hospitalised helmet-wearing cyclists with mild head injury may have been discharged from the
emergency department, mitigating the protective
effects of helmet use. This may explain why no
considerable differences in outcomes were detected
for patients with moderate or severely injured
patients. Despite the low rate of helmet use among
recreational cyclists (15%), significant protective
effects were detected among mildly injured patients
with regard to intracranial haemorrhage and skull
fracture. This limited participant identification
approach also allowed for a pragmatic review of
patients with clinically significant TBI who were
hospitalised following evaluation by an emergency
care physician. Computed tomography scans are
generally performed only for hospitalised patients
with head injury in our public healthcare system;
this approach offered an opportunity to evaluate
imaging data for intracranial haemorrhage. Because
the ICD coding system for traumatic intracranial
haemorrhage reportedly has high sensitivity and
specificity (both >80%),59 we adopted this coding
outcome as the study’s primary endpoint. Another
important limitation was the definition of mild
TBI, which affected most patients in this study. The
definitions offered by several authorities range from
conventional GCS-based criteria such as the US
Centers for Disease Control and Prevention,61 and
the American College of Surgeons62 to additional
symptoms of confusion, memory impairment,
transient loss of consciousness, and irritability
proposed by the World Health Organisation and the
American Congress of Rehabilitation Medicine.18 63 64
A better delineation of these symptoms would have
enhanced the identification of patients with “high-risk”
mild TBI; however, because these relevant
symptoms were often not systematically documented
in most medical records retrieved in our study, we
used GCS-based criteria to reduce the overall rate of
underdiagnosis. Using GOS score on discharge from
hospital as a secondary study endpoint, we found that
only 31 (7%) patients had unfavourable outcomes.
Although statistically significant predictors for TBI
were identified, the wide confidence intervals for
these predictors suggest that the sample size was
insufficient to draw robust conclusions. Finally, we
could only retrospectively assess GOS score as a
fundamental measure of functional outcome. More
sensitive instruments (eg, the extended GOS or
the Sport Concussion Assessment Tool65 66) might
have been better for assessing the psychosocial and
cognitive aspects of TBI, considering that a large
proportion of mildly injured cyclists had intracranial
haemorrhage.
Conclusions
The incidence of sports-related TBI in Hong Kong is low and cycling is the most frequently associated activity. Almost half of hospitalised recreational cyclists sustained intracranial haemorrhage.
Compared with patients who had head injury
because of other sports, cyclists are more likely to
experience severe consequences. There is evidence
that helmet use offers protection against intracranial
haemorrhage and skull fracture among cyclists
with mild head injury. Cycling is a safe physical
activity, but further legislative measures should be
introduced to promote and protect the welfare of
individuals enjoying this sport.
Author contributions
Concept or design: PYM Woo, E Cheung.
Acquisition of data: PYM Woo, E Cheung, FWY Lau, NWS Law, CKY Mak, P Tan, B Siu, A Wong.
Analysis or interpretation of data: PYM Woo, E Cheung, CKY Mak.
Drafting of the manuscript: All authors.
Critical revision of the manuscript for important intellectual content: All authors.
Acquisition of data: PYM Woo, E Cheung, FWY Lau, NWS Law, CKY Mak, P Tan, B Siu, A Wong.
Analysis or interpretation of data: PYM Woo, E Cheung, CKY Mak.
Drafting of the manuscript: All authors.
Critical revision of the manuscript for important intellectual content: All authors.
All authors had full access to the data, contributed to the study, approved the final version for publication, and take responsibility for its accuracy and integrity.
Conflicts of interest
All authors have disclosed no conflicts of interest.
Declaration
This research has not been presented or published in any form prior to submission.
Funding/support
This research received no specific grant from any funding agency in the public, commercial, or not-for-profit sectors.
Ethics approval
This study was approved by the Kowloon Central Cluster/Kowloon East Cluster research ethics committee (Ref KCC/KEC-2020-0331). All patients were treated in accordance with
the Declaration of Helsinki. Informed consent was obtained
from either the patient, next-of-kin, or their legal guardian.
References
1. Allender S, Cowburn G, Foster C. Understanding
participation in sport and physical activity among children
and adults: a review of qualitative studies. Health Educ Res
2006;21:826-35. Crossref
2. Warburton DE, Nicol CW, Bredin SS. Health benefits of physical activity: the evidence. CMAJ 2006;174:801-9. Crossref
3. Batty D, Thune I. Does physical activity prevent cancer?
Evidence suggests protection against colon cancer and
probably breast cancer. BMJ 2000;321:1424-5. Crossref
4. Batty GD, Lee IM. Physical activity and coronary heart disease. BMJ 2004;328:1089-90. Crossref
5. Aune D, Norat T, Leitzmann M, Tonstad S, Vatten LJ. Physical activity and the risk of type 2 diabetes: a systematic review and dose–response meta-analysis. Eur J Epidemiol
2015;30:529-42. Crossref
6. Liu X, Zhang D, Liu Y, et al. Dose-response association between physical activity and incident hypertension: a systematic review and meta-analysis of cohort studies.
Hypertension 2017;69:813-20. Crossref
7. Malm C, Jakobsson J, Isaksson A. Physical activity and
sports-real health benefits: a review with insight into the
Public Health of Sweden. Sports (Basel) 2019;7:127. Crossref
8. Puckett M, Neri A, Underwood JM, Stewart SL. Nutrition and physical activity strategies for cancer prevention in current national comprehensive cancer control program
plans. J Community Health 2016;41:1013-20. Crossref
9. Department of Health, Hong Kong SAR Government.
Towards 2025: strategy and action plan to prevent and
control non-communicable diseases in Hong Kong.
2018 Available from: https://www.chp.gov.hk/files/pdf/saptowards2025_fullreport_en.pdf. Accessed 2 Aug 2020.
10. Theadom A, Starkey NJ, Dowell T, et al. Sports-related brain injury in the general population: an epidemiological study. J Sci Med Sport 2014;17:591-6. Crossref
11. Manley G, Gardner AJ, Schneider KJ, et al. A systematic
review of potential long-term effects of sport-related
concussion. Br J Sports Med 2017;51:969-77. Crossref
12. Theadom A, Mahon S, Hume P, et al. Incidence of sports-related
traumatic brain injury of all severities: a systematic
review. Neuroepidemiology 2020;54:192-9. Crossref
13. Daneshvar DH, Nowinski CJ, McKee AC, Cantu RC. The epidemiology of sport-related concussion. Clin Sports
Med 2011;30:1-17. Crossref
14. Selassie AW, Wilson DA, Pickelsimer EE, Voronca DC,
Williams NR, Edwards JC. Incidence of sport-related
traumatic brain injury and risk factors of severity: a
population-based epidemiologic study. Ann Epidemiol
2013;23:750-6. Crossref
15. Transport Department, Hong Kong SAR Government. Cycling study. 2004. Available from: https://www.td.gov.hk/filemanager/en/publication/cyclingstudy.pdf. Accessed 22 Aug 2020.
16. Transport Department. Hong Kong SAR Government.
Travel Characteristics Survey 2011 Final Report.
Available from: https://www.td.gov.hk/filemanager/en/content_4652/tcs2011_eng.pdf. Accessed 22 Aug 2020.
17. Xu P, Dong N, Wong SC, Huang H. Cyclists injured in
traffic crashes in Hong Kong: a call for action. PLoS One
2019;14:e0220785. Crossref
18. Servadei F, Teasdale G, Merry G, Neurotraumatology
Committee of the World Federation of Neurosurgical
Societies. Defining acute mild head injury in adults: a
proposal based on prognostic factors, diagnosis, and
management. J Neurotrauma 2001;18:657-64. Crossref
19. Huang WY, Wong SH, Sit CH, et al. Results from the Hong Kong’s 2018 report card on physical activity for children and youth. J Exerc Sci Fit 2019;17:14-9. Crossref
20. Harris AW, Jones CA, Rowe BH, Voaklander DC. A
population-based study of sport and recreation-related
head injuries treated in a Canadian health region. J Sci Med
Sport 2012;15:298-304. Crossref
21. Beck AJ, Kee J. The epidemiology of sports head injuries in a rural population. Br J Sports Med 2011;45:A20. Crossref
22. Transport Department, Hong Kong SAR Government.
Road Traffic Accident Statistics. Year 2019. Road traffic
accidents involving bicycle by location and severity
2019. Available from: https://www.td.gov.hk/en/road_safety/road_traffic_accident_statistics/2019/index.html. Accessed 9 Aug 2020.
23. Lee LL, Yeung KL, Chan JT, Chen RC. A profile of bicycle-related injuries in Tai Po. Hong Kong J Emerg Med 2003;10:81-7.Crossref
24. Yeung JH, Leung CS, Poon WS, Cheung NK, Graham CA,
Rainer TH. Bicycle related injuries presenting to a trauma
centre in Hong Kong. Injury 2009;40:555-9. Crossref
25. Ng CP, Siu AY, Chung CH. Bicycle-related injuries: a local scene. Hong Kong J Emerg Med 2001;8:78-83. Crossref
26. Sze NN, Tsui KL, Wong SC, So FL. Bicycle-related crashes in Hong Kong: is it possible to reduce mortality and severe
injury in the metropolitan area? Hong Kong J Emerg Med
2011;18:136-43. Crossref
27. Rivara FP, Thompson DC, Thompson RS. Epidemiology of bicycle injuries and risk factors for serious injury. Inj Prev 1997;3:110-4. Crossref
28. Transport Department, Hong Kong SAR Government. Be a smart cyclist. Wear bicycle helmet always. 2020.
Available from: https://www.td.gov.hk/filemanager/en/content_4551/221201047_leaflet_a.pdf. Accessed 21 Aug 2020.
29. Attewell RG, Glase K, McFadden M. Bicycle helmet efficacy: a meta-analysis. Accid Anal Prev 2001;33:345-52. Crossref
30. Maimaris C, Summers CL, Browning C, Palmer CR. Injury
patterns in cyclists attending an accident and emergency
department: a comparison of helmet wearers and non-wearers.
BMJ 1994;308:1537-40. Crossref
31. McDermott FT, Lane JC, Brazenor GA, Debney EA. The effectiveness of bicyclist helmets: a study of 1710 casualties. J Trauma 1993;34:834-44. Crossref
32. Thomas S, Acton C, Nixon J, Battistutta D, Pitt WR, Clark R.
Effectiveness of bicycle helmets in preventing head injury
in children: case-control study. BMJ 1994;308:173-6. Crossref
33. Thompson DC, Rivara FP, Thompson RS. Effectiveness of bicycle safety helmets in preventing head injuries. A case-control
study. JAMA 1996;276:1968-73. Crossref
34. Thompson RS, Rivara FP, Thompson DC. A case-control study of the effectiveness of bicycle safety helmets. N Engl J Med 1989;320:1361-7. Crossref
35. Strotmeyer SJ, Behr C, Fabio A, Gaines BA. Bike helmets
prevent pediatric head injury in serious bicycle crashes
with motor vehicles. Inj Epidemiol 2020;7(Suppl 1):24. Crossref
36. Sethi M, Heidenberg J, Wall SP, et al. Bicycle helmets are
highly protective against traumatic brain injury within a
dense urban setting. Injury 2015;46:2483-90. Crossref
37. Persaud N, Coleman E, Zwolakowski D, Lauwers B, Cass D.
Nonuse of bicycle helmets and risk of fatal head injury:
a proportional mortality, case-control study. CMAJ
2012;184:E921-3. Crossref
38. Thompson DC, Rivara FP, Thompson R. Helmets for
preventing head and facial injuries in bicyclists. Cochrane
Database Syst Rev 2000;1999(2):CD001855. Crossref
39. Robinson DL. No clear evidence from countries that have enforced the wearing of helmets. BMJ 2006;332:722-5. Crossref
40. Hong Kong Cycling Alliance. Helmets. Available from:
http://hkcyclingalliance.org/on-the-road/helmets. Accessed 21 Aug 2020.
41. Bateman-House A. Bikes, helmets, and public health: decision-making when goods collide. Am J Public Health 2014;104:986-92. Crossref
42. Goldacre B, Spiegelhalter D. Bicycle helmets and the law. BMJ 2013;346:f3817. Crossref
43. Rivara FP, Thompson DC, Patterson MQ, Thompson RS.
Prevention of bicycle-related injuries: helmets, education,
and legislation. Annu Rev Public Health 1998;19:293-318. Crossref
44. Olivier J, Boufous S, Grzebieta R. The impact of bicycle helmet legislation on cycling fatalities in Australia. Int J Epidemiol 2019;48:1197-203. Crossref
45. Tin Tin S, Woodward A, Ameratunga S. Injuries to pedal cyclists on New Zealand roads, 1988-2007. BMC Public
Health 2010;10:655. Crossref
46. Meehan WP 3rd, Lee LK, Fischer CM, Mannix RC. Bicycle helmet laws are associated with a lower fatality rate from bicycle-motor vehicle collisions. J Pediatr 2013;163:726-9. Crossref
47. Macpherson A, Spinks A. Bicycle helmet legislation for the uptake of helmet use and prevention of head injuries. Cochrane Database Syst Rev 2008;2008(3):CD005401. Crossref
48. World Health Organisation. Why are helmets needed?
2006. Available from: https://www.who.int/roadsafety/projects/manuals/helmet_manual/1-Why.pdf. Accessed 13 Oct 2021.
49. British Medical Association. Healthy transport=healthy
lives. 2012. Available from: https://thepep.unece.org/sites/default/files/2017-06/Healthy%20transport%20healthy%20lives%20Britsh%20Medical%20Association.pdf. Accessed 13 Oct 2021.
50. American Medical Association. Helmets for riders of
motorized and non-motorized cycles H-10.964. Available
from: https://policysearch.ama-assn.org/policyfinder/detail/bicycle helmets?uri=%2FAMADoc%2FHOD.xml-0-3.xml. Accessed 20 Sep 2021.
51. McDermott FT. Helmet efficacy in the prevention of
bicyclist head injuries: Royal Australasian College of
Surgeons initiatives in the introduction of compulsory
safety helmet wearing in Victoria, Australia. World J Surg
1992;16:379-83. Crossref
52. Gamble T, Walker I. Wearing a bicycle helmet can increase
risk taking and sensation seeking in adults. Psychol Sci
2016;27:289-94. Crossref
53. Walker I. Drivers overtaking bicyclists: objective data on
the effects of riding position, helmet use, vehicle type and
apparent gender. Accid Anal Prev 2007;39:417-25. Crossref
54. Hooper C, Spicer J. Liberty or death; don’t tread on me. J
Med Ethics 2012;38:338-41. Crossref
55. Theadom A, Barker-Collo S, Feigin VL, et al. The spectrum
captured: a methodological approach to studying incidence
and outcomes of traumatic brain injury on a population
level. Neuroepidemiology 2012;38:18-29. Crossref
56. Delaney JS, Lamfookon C, Bloom GA, Al-Kashmiri A,
Correa JA. Why university athletes choose not to reveal
their concussion symptoms during a practice or game. Clin
J Sport Med 2015;25:113-25. Crossref
57. Meehan WP 3rd, Mannix RC, O’Brien MJ, Collins MW.
The prevalence of undiagnosed concussions in athletes.
Clin J Sport Med 2013;23:339-42. Crossref
58. van Walraven C, Bennett C, Forster AJ. Administrative
database research infrequently used validated diagnostic
or procedural codes. J Clin Epidemiol 2011;64:1054-9. Crossref
59. Carroll CP, Cochran JA, Guse CE, Wang MC. Are we
underestimating the burden of traumatic brain injury?
Surveillance of severe traumatic brain injury using Centers
for Disease Control International Classification of Disease,
Ninth Revision, Clinical Modification, traumatic brain
injury codes. Neurosurgery 2012;71:1064-70. Crossref
60. Barker-Collo S, Theadom A, Jones K, Feigin VL, Kahan M.
Accuracy of an International Classification of Diseases
Code Surveillance System in the identification of traumatic
brain injury. Neuroepidemiology 2016;47:46-52. Crossref
61. Centers for Disease Control and Prevention. Glasgow
Coma Scale. Available from: https://www.cdc.gov/masstrauma/resources/gcs.pdf. Accessed 20 Sep 2021.
62. American College of Surgeons. Best practices in the
management of traumatic brain injury. Available from:
https://www.facs.org/-/media/files/quality-programs/trauma/tqip/tbi_guidelines.ashx. Accessed 20 Sep 2021.
63. Carroll LJ, Cassidy JD, Holm L, Kraus J, Coronado VG,
WHO Collaborating Centre Task Force on Mild Traumatic
Brain Injury. Methodological issues and research
recommendations for mild traumatic brain injury: the
WHO Collaborating Centre Task Force on Mild Traumatic
Brain Injury. J Rehabil Med 2004;(43 Suppl):113-25. Crossref
64. Kay T, Harrington DE, Adams R, et al. Definition of mild
traumatic brain injury. J Head Trauma Rehabil 1993;8:86-7. Crossref
65. Kean J, Malec JF. Towards a better measure of brain injury outcome: new measures or a new metric? Arch Phys Med Rehabil 2014;95:1225-8. Crossref
66. McCrory P, Meeuwisse WH, Aubry M, et al. Consensus
statement on concussion in sport: the 4th International
Conference on Concussion in Sport, Zurich, November
2012. J Athl Train 2013;48:554-75. Crossref