Health behaviour practices and expectations for a local cancer survivorship programme: a crosssectional study of survivors of childhood cancer in Hong Kong
Hong Kong Med J 2022 Feb;28(1):33–44 | Epub 25 Jan 2022
© Hong Kong Academy of Medicine. CC BY-NC-ND 4.0
ORIGINAL ARTICLE
Health behaviour practices and expectations for
a local cancer survivorship programme: a cross-sectional study of survivors of childhood cancer in Hong Kong
YT Cheung, PhD1; LS Yang, BPharm, MCP1; Justin CT Ma, HBSc1; Patricia HK Woo, BPharm1; Sammy MS Luk, BPharm1; Thomas CH Chan, BPharm1; Vivian WY Lee, DPharm2; Nelson CY Yeung, PhD3; CK Li, MB, BS, MD4
1 School of Pharmacy, Faculty of Medicine, The Chinese University of Hong Kong, Hong Kong
2 Centre for Learning Enhancement and Research, The Chinese University of Hong Kong, Hong Kong
3 JC School of Public Health and Primary Care, Faculty of Medicine, The Chinese University of Hong Kong, Hong Kong
4 Department of Paediatrics, Faculty of Medicine, The Chinese University of Hong Kong, Hong Kong Children’s Hospital
Corresponding author: Prof YT Cheung (yinting.cheung@cuhk.edu.hk)
 Full paper in PDF
Abstract
Introduction: Lifestyle choices may influence health
outcomes in cancer survivors. This study of childhood
cancer survivors in Hong Kong investigated factors
associated with health-protective and health-damaging
behaviours; it also examined expectations
of a survivorship programme.
Methods: This cross-sectional study recruited
survivors of childhood cancer ≥2 years after treatment.
Survivors completed a structured questionnaire to
report their health practices and the perceived values of
survivorship programme components. Multivariable
logistic regression analysis was conducted to identify
factors associated with health behaviours.
Results: Two hundred survivors were recruited
(mean age=23.4 ± 8.8 years; mean duration since
treatment, 13.4 ± 7.6 years). Comparatively few
survivors exercised ≥4 days/week (16.0%), used sun
protection (18.0%), and had a balanced diet (38.5%).
Furthermore, comparatively few survivors reported
that they had not undergone any immunisation (24.5%)
or were unsure (18.5%) about their immunisation
history. Most adult survivors were never-drinkers
(71.0%) and never-smokers (93.0%). Brain tumour
survivors were more likely to have unhealthy eating
habits, compared with haematological malignancy
survivors (odds ratio [OR]=2.45; 95% confidence
interval [CI]=1.29-4.68). Lower socioeconomic
status was associated with inadequate sun protection
(OR=0.20; 95% CI=0.05-0.83), smoking (OR=5.13; 95% CI=1.48-17.75), and exposure to second-hand
smoke (OR=3.52; 95% CI=1.42-8.69). Late-effects
screening (78.5%) and psychosocial services to
address psychological distress (77%) were considered
essential components of a survivorship programme.
Conclusions: Despite the low prevalences of health-damaging
behaviours, local survivors of childhood
cancer are not engaging in health-protective behaviours.
A multidisciplinary programme addressing late effects
and psychosocial aspects may address the multifaceted
needs of this special population.
New knowledge added by this study
- Despite the low prevalences of health-damaging behaviours, engagement in health-protective behaviours among survivors of childhood cancer in Hong Kong was unsatisfactory, particularly with regard to participation in regular physical activity, consumption of a balanced diet, and the use of sun protection.
- Indicators of lower socioeconomic status (ie, lower education attainment and monthly household income) were collectively identified as predictors of smoking, poor dietary habits, and lack of immunisation.
- Survivors of childhood cancer regarded services concerning health issues (eg, education and screening for late effects) as the most important aspects of survivorship care. They also preferred enrolment into a survivorship programme early in the cancer care continuum.
- A potential intervention opportunity may involve engaging survivors and families in a structured comprehensive survivorship programme during their transition to survivorship. The centralisation of paediatric oncology services in the new Hong Kong Children’s Hospital has provided an unprecedented opportunity for oncologists and allied health professionals to initiate a formal paediatric cancer survivorship programme that is tailored to the healthcare system in Hong Kong.
- A multidisciplinary and interactive programme addressing late effects and psychosocial aspects may help survivors of childhood cancer take age-appropriate ownership of their health and function as active partners with their health providers during the survivorship phase.
- Underserved survivors may require special navigation services and care coordination to promote adherence to surveillance, preventive care, and health-protective behaviours.
Introduction
Advancements in diagnostic and treatment strategies
have led to substantial improvements in treatment
prognoses for children with cancer. The 5-year
survival rate of childhood cancers has increased
dramatically in high-resource settings, from <50% in
the 1970s to >80% in the past decade.1 Consequently,
there has been a global surge in the population
of survivors of childhood cancer, especially in
developed regions such as Hong Kong. According to
the Hospital Authority Cancer Registry, from 2001
to 2017 in Hong Kong, approximately 180 paediatric
patients <19 years of age were diagnosed with
cancer each year.2 It is unquestionably necessary to
further improve survival rates, and recent efforts
and resources have been dedicated to improving the
quality of life and health outcomes of survivors of
childhood cancer in Hong Kong.3 4 5
Cancer survivors are susceptible to developing
a spectrum of late effects because of their previous
treatment exposures.6 7 Studies have shown that
histories of specific treatment exposures, coupled
with continued engagement in health-damaging behaviours during survivorship, may accelerate or
exacerbate the development of late effects.8 9 The
Children’s Oncology Group (COG)10 provide details
of common health-damaging behaviours and their
potential impacts on various treatment-related
chronic conditions.
Adult and paediatric oncology research has
suggested that cancer survivors and their families
are often highly receptive to education regarding
optimal lifestyles during the early survivorship
period.11 Thus, the COG and other international
oncology groups have specified that an ideal
cancer survivorship programme should comprise
recommended screening/surveillance protocols to
detect recurrence and late effects, health promotion
activities, specialty referrals, and psychosocial
interventions.7 12 One systematic review reported
that a comprehensive cancer survivorship care
programme is associated with positive behavioural
change and better health outcomes in survivors.3
In Hong Kong, a recent study by Chan et al13
showed that, although the rates of smoking and
alcohol consumption were low among local
survivors of childhood cancer, survivors were less
likely than their healthy siblings to participate
in cancer screening. However, the study did not
examine frequencies of engagement in other
health-protective behaviours, such as participation
in physical activity, undergoing immunisation,
using sunscreen, and consuming a balanced
diet. Furthermore, survivors’ expectations of a
comprehensive survivorship programme have not
been investigated. The identification of predictors
of poor health-behaviour practices and elucidation
of survivors’ needs will presumably assist clinicians
in developing targeted interventions to address the
needs of this special population.
The primary aim of this study was to identify
factors associated with engagement in health-protective
and health-damaging behaviours among
local survivors of childhood cancer. The secondary
aim was to examine cancer survivors’ expectations
of a comprehensive survivorship programme in
Hong Kong.
Methods
Study design and population
This prospective, observational study was conducted
at the paediatric oncology/haematology long-term
follow-up clinic of the Prince of Wales Hospital,
Hong Kong. Eligible participants were recruited
through convenience sampling. Between June 2019
and March 2020, the study investigators obtained
the list of patients who were scheduled to attend
follow-up consultations at the long-term follow-up
clinic; this clinic was typically held once per week.
Patients were then screened for eligibility using the in-house electronic patient record system (Clinical
Management System). All eligible patients who
subsequently attended the long-term follow-up
clinic were invited to participate in the study.
The inclusion criteria were as follows: diagnosis
with primary cancer before 18 years of age; treatment
in any medical institutions in Hong Kong; survival
for at least 2 years since the completion of cancer
treatment or 5 years since diagnosis; and ability to
communicate in Cantonese. A parent was recruited
if the survivor was aged ≤16 years, or if the survivor
was cognitively impaired. Patients were excluded if
they were diagnosed with non-cancer conditions (eg,
aplastic anaemia, thalassemia), did not understand
Cantonese, were still on active treatment, or had
incomplete treatment data.
Data collection
Clinical data regarding cancer diagnosis, treatment
history, commodities, and relapse status were
retrieved from survivors’ electronic health records. A
20-minute structured questionnaire was interviewer-administered.
Participants self-reported their
socioeconomic information (ie, highest education
attainment, medical insurance, and monthly family
income).
Health behaviours were measured using a
version of the 2013 National Youth Risk Behaviour
Survey14 that had been modified and translated into
Traditional Chinese. To adapt the survey for use
within the study population, questions pertaining
to the healthy behaviour practices of young adult
cancer survivors were added. These additional
questions were developed based on the health
behaviours and practices most frequently reported
in studies of survivors of childhood cancer in other
countries.9 15 16 Health-protective behaviours refer to
engagement in physical activity, balanced diet, sun
protection, and immunisation programmes. Health-damaging
practices refer to alcohol consumption,
smoking, and exposure to second-hand smoke.
Alcohol consumption and smoking practices were
evaluated in adult survivors only, as the legal age
for purchasing tobacco and alcoholic products is
18 years in Hong Kong.
Participants were asked to rate the perceived
values of recommended components of a
comprehensive survivorship programme12 in the
categories of health, psychosocial, parenting, and
financial issues. Ratings were conducted using a
5-point Likert scale (1=least important, 5=most
important). Participants were also asked to report
their preferred time of enrolment into a survivorship
programme and modes of services.
Sample size
The current analysis is part of a broader study17 that aimed to evaluate the effect of an educational intervention on improving awareness of personal
health risks among survivors (primary outcome), as
well as general health literacy and health behaviours
among survivors (auxiliary outcomes). The tailored
educational intervention included a review of
the survivor’s cancer treatment summary and
teaching materials that contained simplified health
promotion messages derived from the COG Health
Links.10 Sample size was determined based on the
primary outcome (awareness of personal health
risks). A similar study by Landier et al18 showed that
the proportion of survivors of childhood cancer who
adequately understood their health risks (defined as
awareness of >75% of treatment-related late effects
for which they were at risk) was approximately
55% after two sessions of the tailored intervention
(ie, θ=0.55). At α=0.05, the required sample size
for achieving 80% power to detect a difference in
proportion (target θ0=0.45) between pre- and post-intervention
assessments was 195. The current
analysis reported the health behavioural practices of
participants who provided baseline, pre-intervention
assessments.
Statistical analysis
The SAS University Edition (version 2015; SAS
Institute Inc, Cary [NC], US) software was used for
all statistical analyses. Descriptive statistics were
used to summarise participants’ demographics,
clinical characteristics, and frequencies of health
behaviours. Multivariable logistic regression
analysis was conducted to identify factors that were
associated with health behaviours. Associations
were presented using odds ratios (ORs) and 95%
confidence intervals (95% CIs). Based on a literature
review,9 15 19 20 the hypothesised predictors comprised
demographics and clinical characteristics (sex,
age, cancer diagnosis, and time since diagnosis), as
well as socioeconomic status (medical insurance
status, monthly household income, and highest
education attainment [in adult survivors only]).
Finally, descriptive statistics were used to summarise
participants’ preferences for the components of a
comprehensive survivorship programme.
Results
Participant characteristics
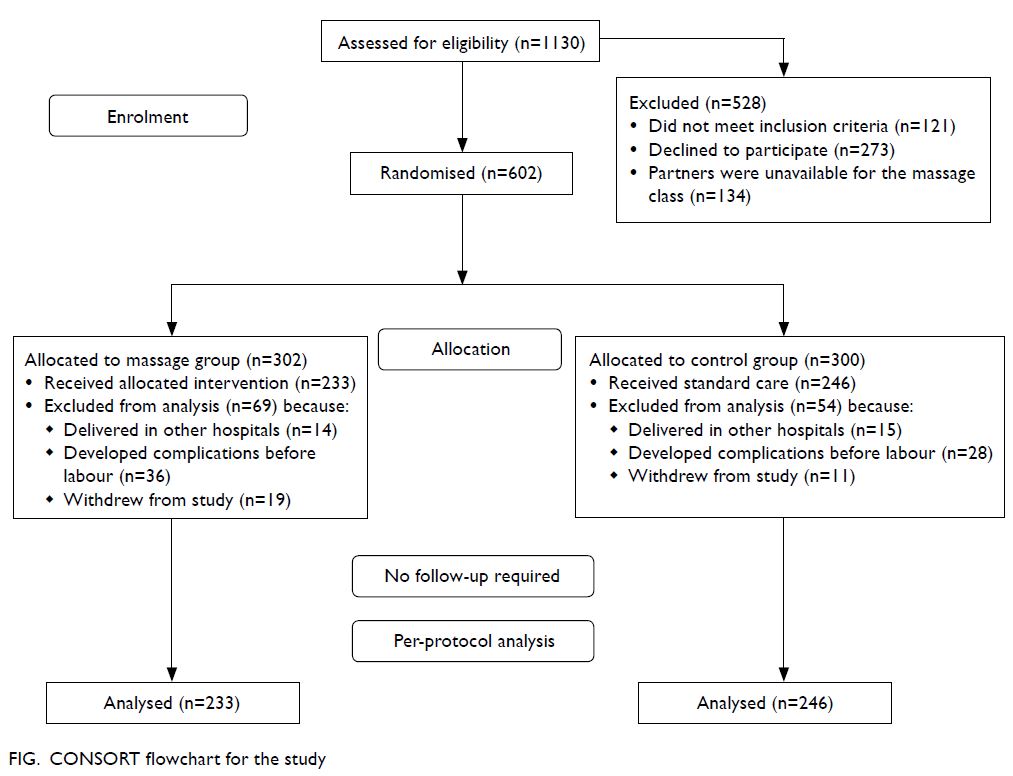
In total, 252 survivors were screened for eligibility;
39 were excluded for <2 years since treatment or <5
years since diagnosis, the presence of non-cancer
diagnoses (eg, benign ovarian teratoma), inability
to understand Chinese, or treatment performed
outside of Hong Kong. Subsequently, 213 eligible
participants were approached. Eight survivors
declined to participate, while the remaining 205
eligible survivors provided informed consent
and completed the study. Five participants were subsequently excluded because of incomplete
treatment records. Finally, data from 200 participants
were analysed (response rate 93.9%) [Fig 1].
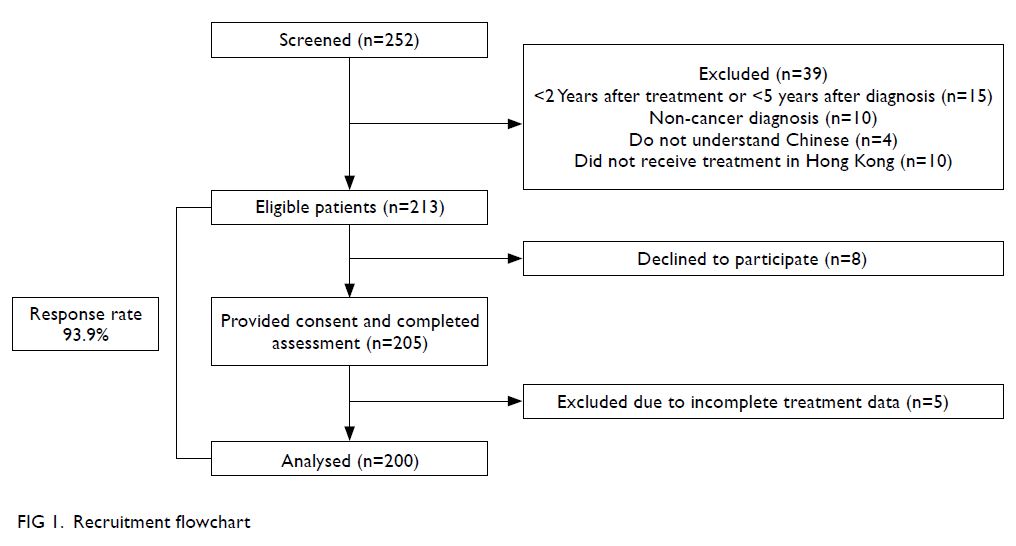
Figure 1. Recruitment flowchart
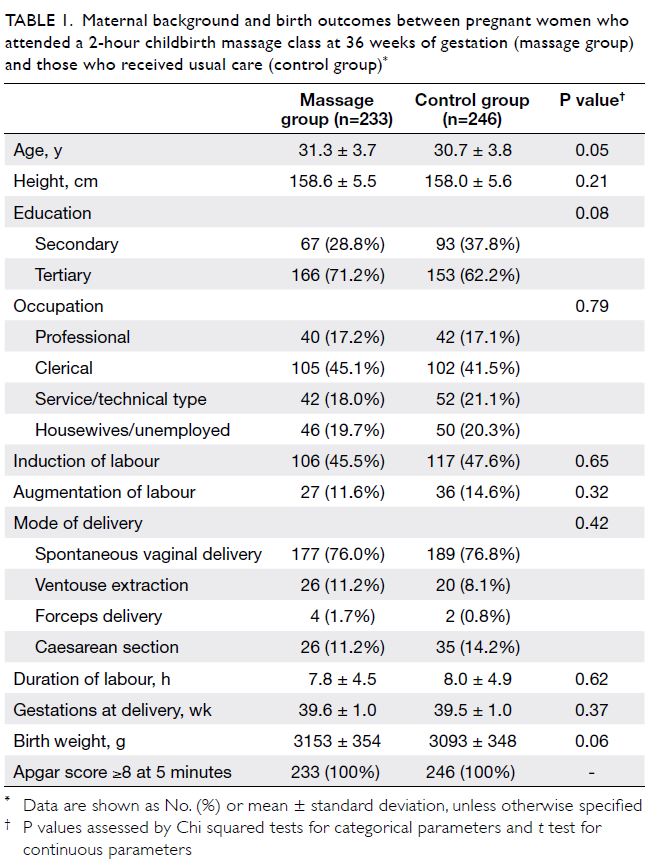
The mean (± standard deviation) ages at
interview were 26.9 ± 6.4 years and 11.1 ± 3.6 years
among adult and paediatric survivors, respectively
(Table 1). The mean age at cancer diagnosis was
7.3 ± 5.2 years. The mean time since treatment
completion was 13.4 ± 7.6 years; 41.0% (n=82) of
survivors were within 10 years after treatment. The
most common diagnoses were leukaemia (n=78,
39.0%), lymphoma (n=28, 14.0%), and bone tumour
(n=18, 9.0%). In total, 185 survivors (92.5%) had
undergone chemotherapy, 130 survivors (65.0%)
had received radiation, and 85 survivors (42.5%)
had undergone surgery. Only 30 survivors
(15.0%) had received hematopoietic stem cell
transplantation.
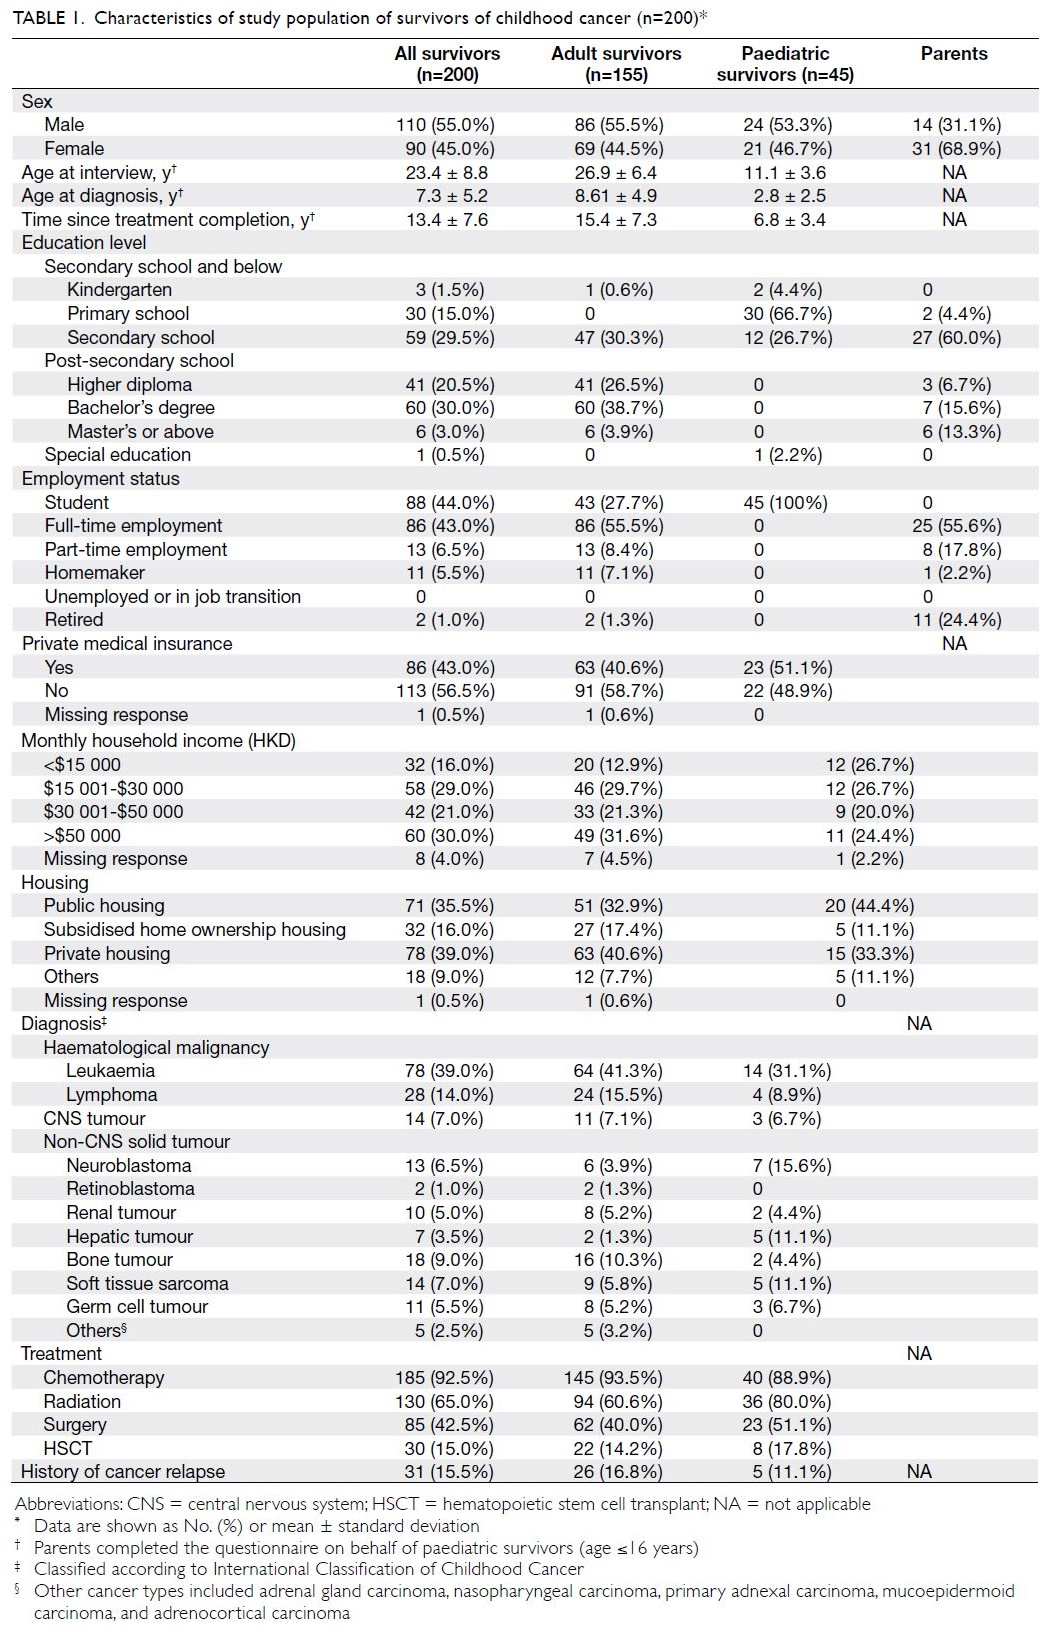
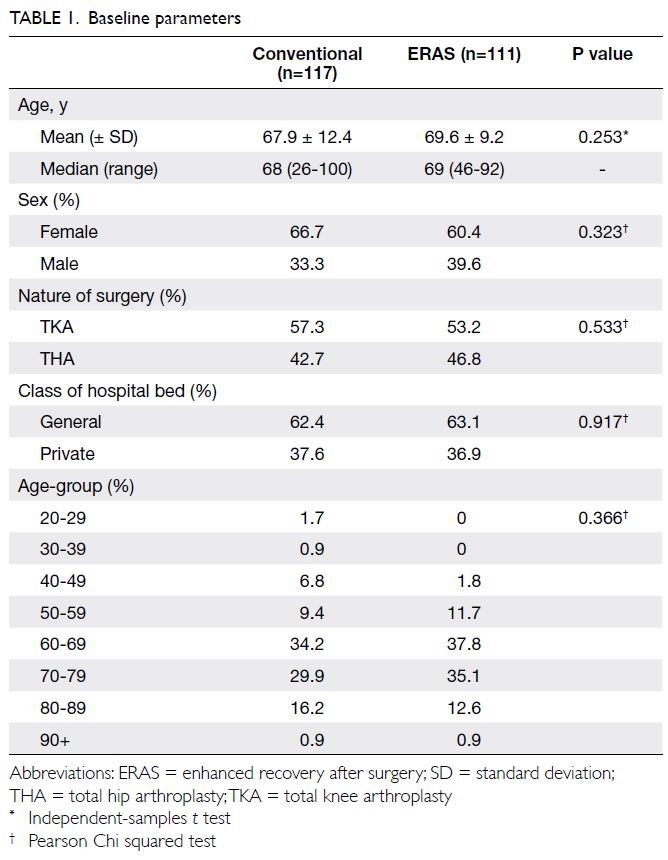
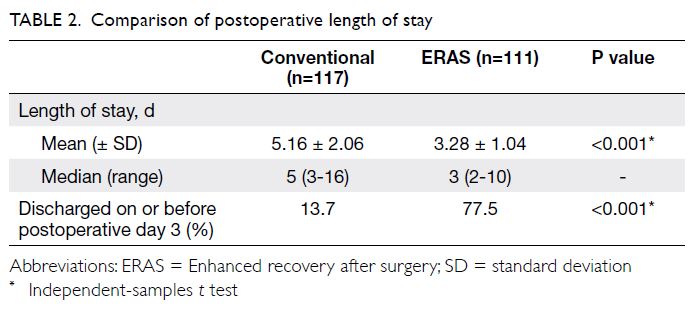
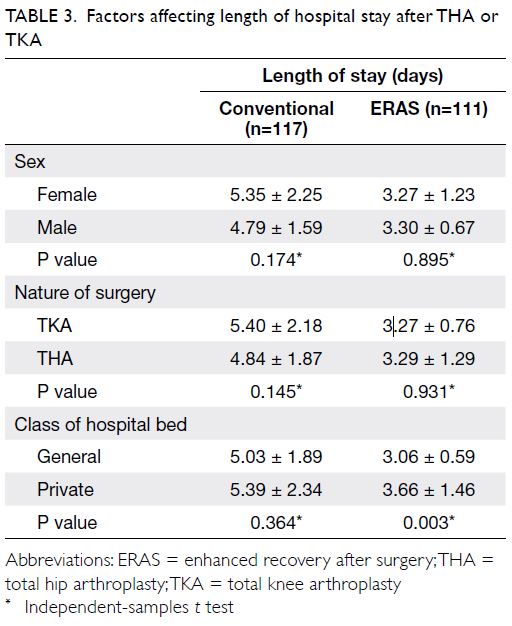
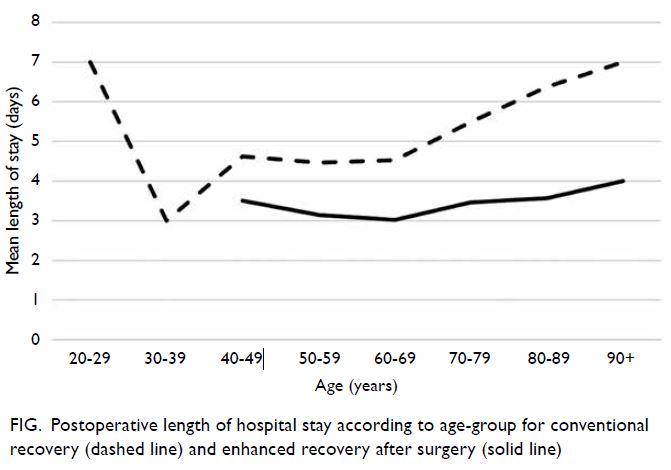
Table 1. Characteristics of study population of survivors of childhood cancer (n=200)
All paediatric survivors were students. Among
adult survivors, 107 (69.0%) had completed post-secondary
education. Only 32 survivors (16.0%)
reported a monthly household income of less than
HKD$15 000, and 86 survivors (43.0%) had private
medical insurance.
Interviews for paediatric survivors (n=45)
were completed by parents (Table 1). The mean
age of parents was 43.4 ± 7.7 years, and 43 (95.6%)
parents had completed secondary school or higher
education.
Health behaviour practices
The health-protective and health-damaging
behaviours of survivors are summarised in
Table 2. The least frequently practised health-protective health-protective
behaviour was physical activity. Only
16 survivors (8%) met the World Health Organisation
recommendation of engagement in 20 minutes
of aerobic physical activity for ≥4 days per week.
Of the survivors, 104 (52.0%) reported that they
exercised rarely (≤1 day per week) and 135 (67.5%)
applied sunscreen rarely. Fewer than 40% of
survivors “always” and “frequently” had a balanced
diet. In terms of immunisation practice, 49 (24.5%)
survivors reported that they did not undergo any
immunisation and 37 (18.5%) were unsure about
their immunisation history.
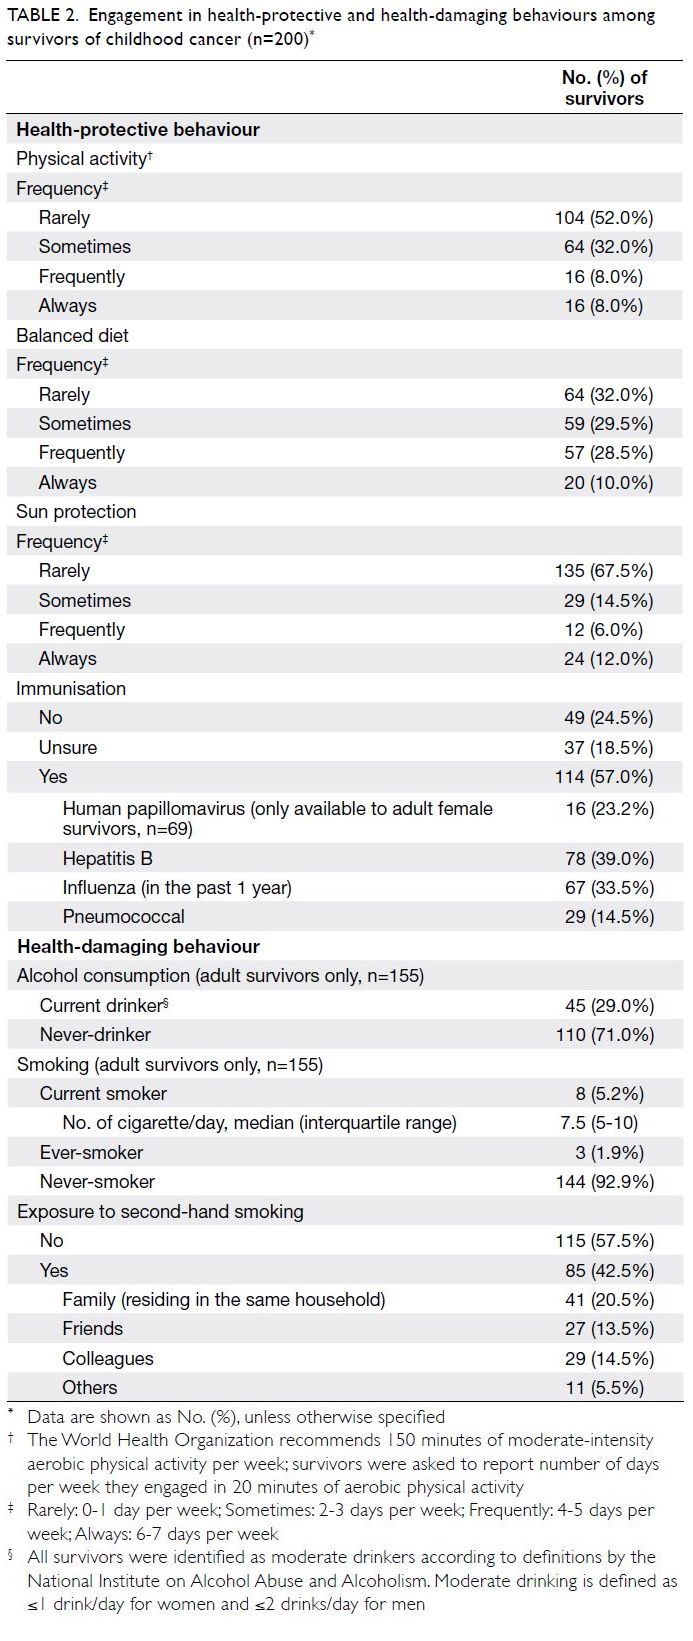
Table 2. Engagement in health-protective and health-damaging behaviours among survivors of childhood cancer (n=200)
Among 155 adult survivors, 110 (71.0%)
were never-drinkers, whereas 45 (29.0%) identified
themselves as social drinkers. These social drinkers
met the “moderate” and “low-risk” drinker
definitions established by the National Institute on
Alcohol Abuse and Alcoholism.21 Of the 155 adult
survivors, 144 (92.9%) were never-smokers and three
(1.9%) were ever-smokers. Only eight survivors
(5.2%) were current smokers; they smoked a median
of 7.5 cigarettes per day (interquartile range=5-10).
Of the survivors, 85 (42.5%) were exposed to second-hand
smoke; 41 (20.5%) from family members and
29 (14.5%) from colleagues.
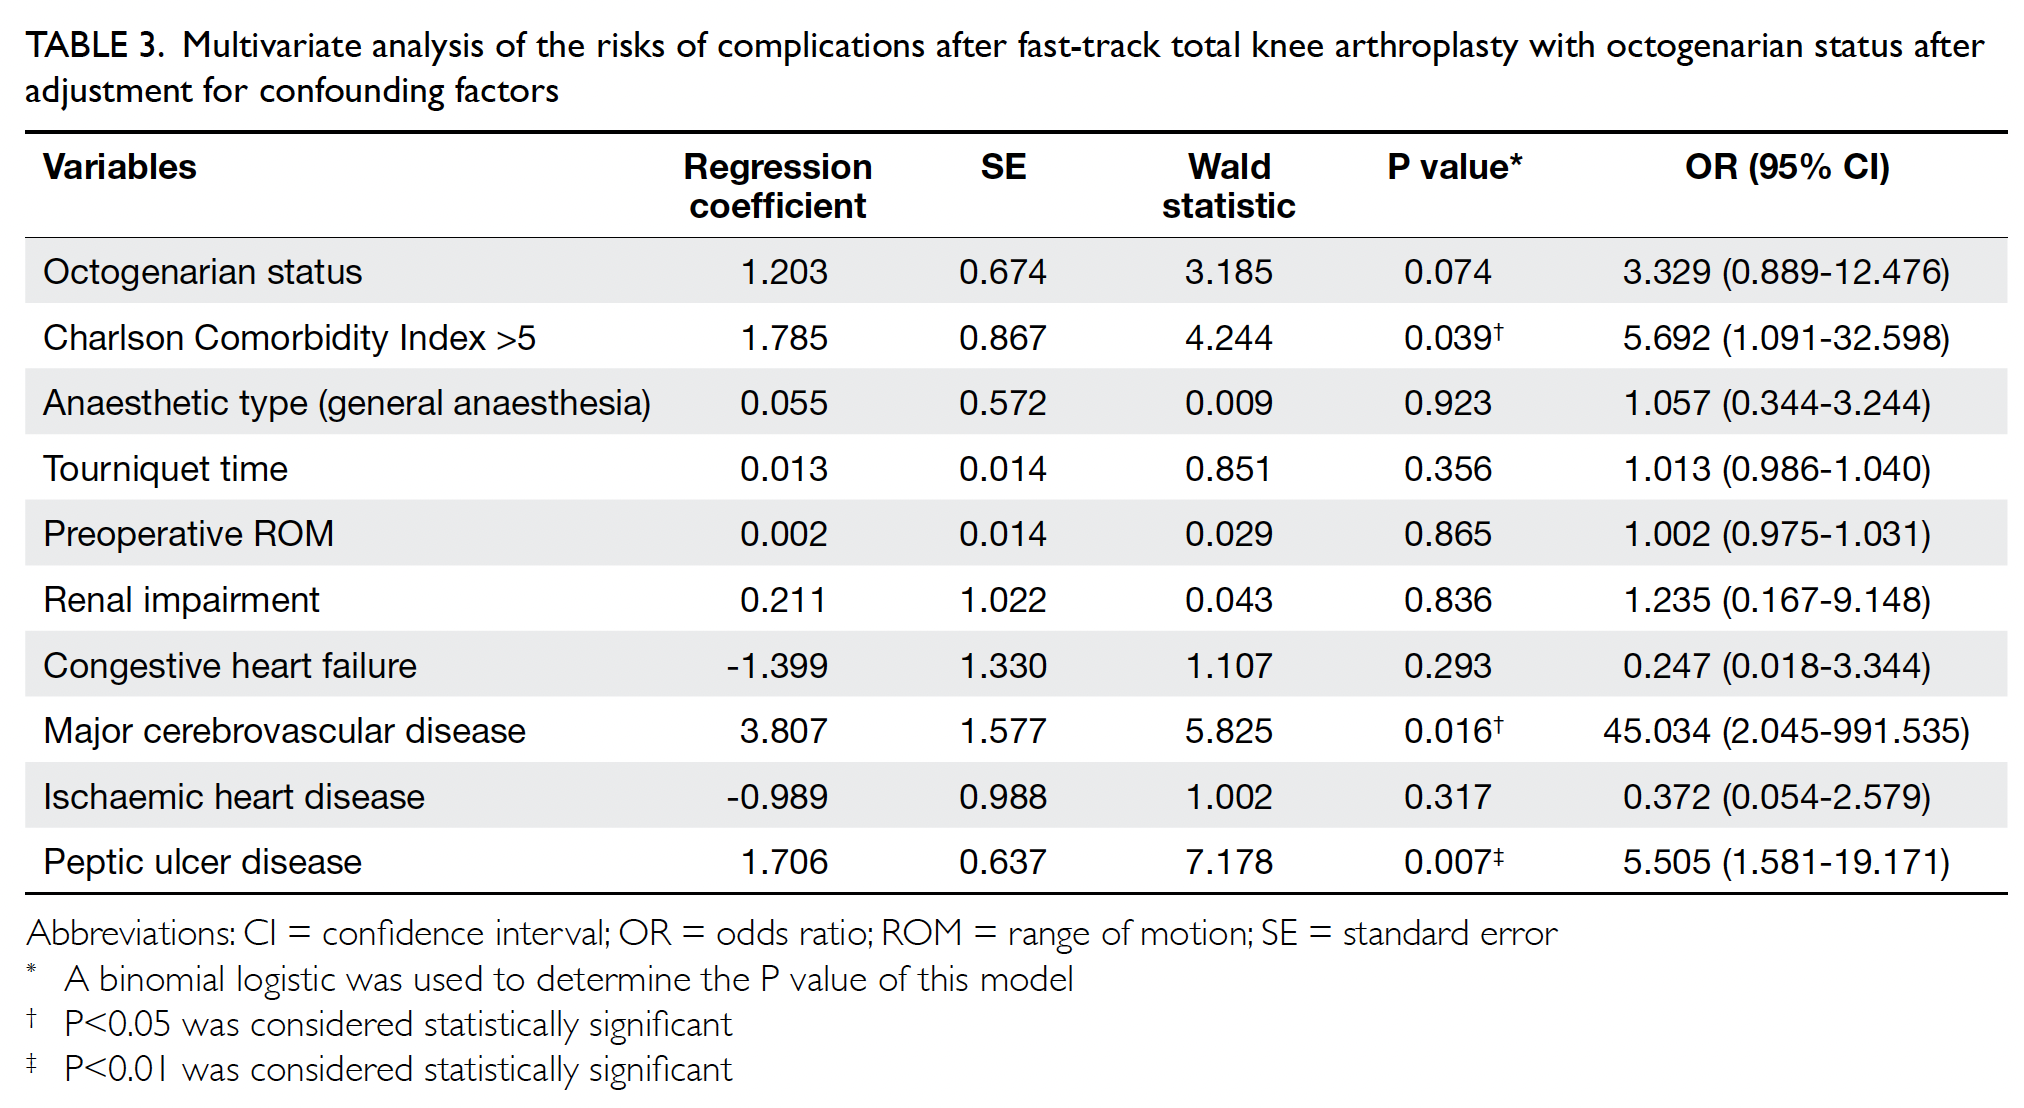
Factors associated with health behaviours
Compared with survivors of central nervous system
(CNS) tumours, survivors who had been diagnosed
with haematological malignancies were more likely to
adopt a balanced diet (OR=2.45; 95% CI=1.29-4.68).
Younger age at interview was also a significant
predictor of adoption of a balanced diet (OR=0.95;
95% CI=0.91-0.99) [Table 3].
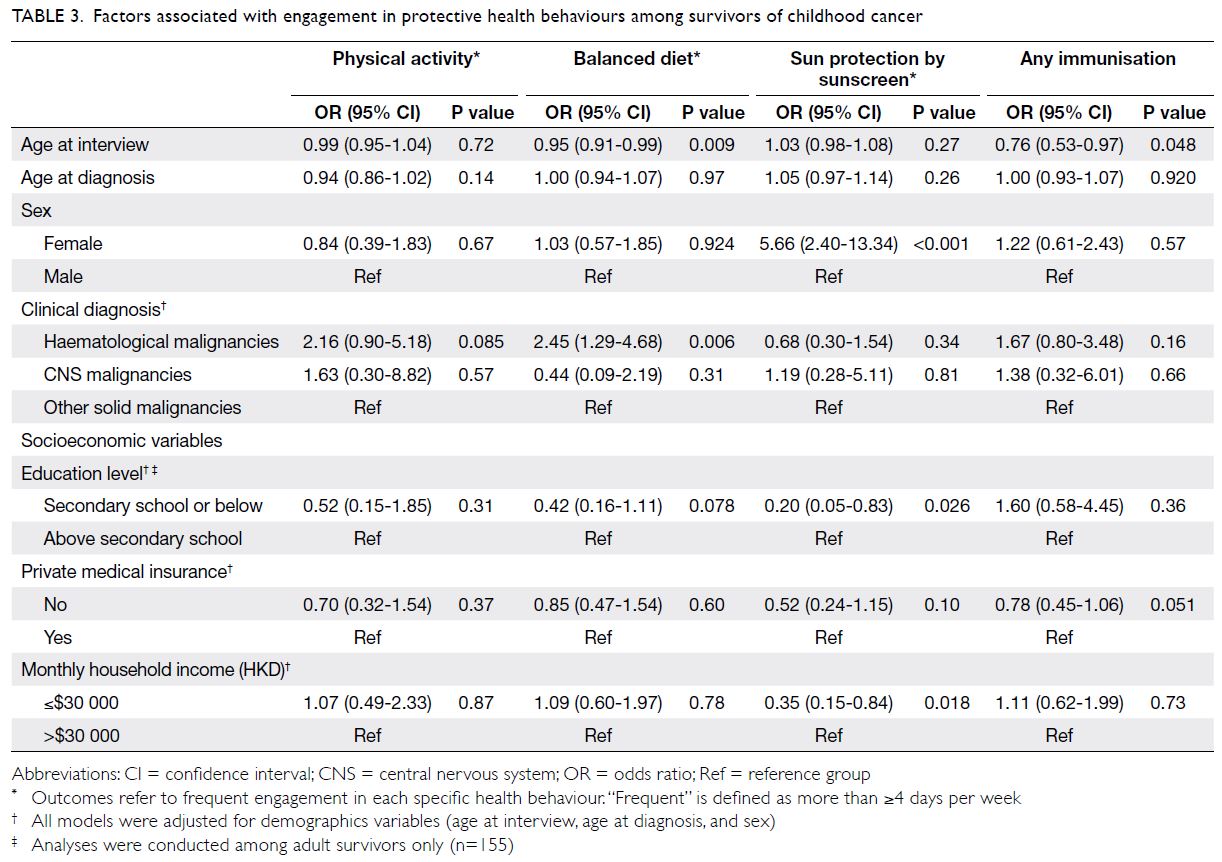
Table 3. Factors associated with engagement in protective health behaviours among survivors of childhood cancer
Female survivors had more than fivefold
greater odds of regular sunscreen use, compared
with male survivors (OR=5.66; 95% CI=2.40-13.34).
Lower education level in adult survivors (OR=0.20;
95% CI=0.05-0.83) and lower monthly household
income (OR=0.35; 95% CI=0.15-0.84) were
associated with inadequate sun protection (Table 3).
Older survivors were less likely than younger
survivors to participate in immunisation programmes
(OR=0.76; 95% CI=0.53-0.97). Although the
difference was not statistically significant (P=0.051),
immunisation practices tended to be less common in
survivors who did not have private medical insurance,
compared with survivors who did (OR=0.78;
95% CI=0.45-1.06).
In terms of health-damaging behaviours
(Table 4), compared with survivors who had
completed education to a higher level than secondary
school, adult survivors with a lower education level
had greater odds of being current or ever-smokers
(OR=5.13; 95% CI=1.48-17.75) and of being exposed
to second-hand smoke (OR=3.52; 95% CI=1.42-8.69).
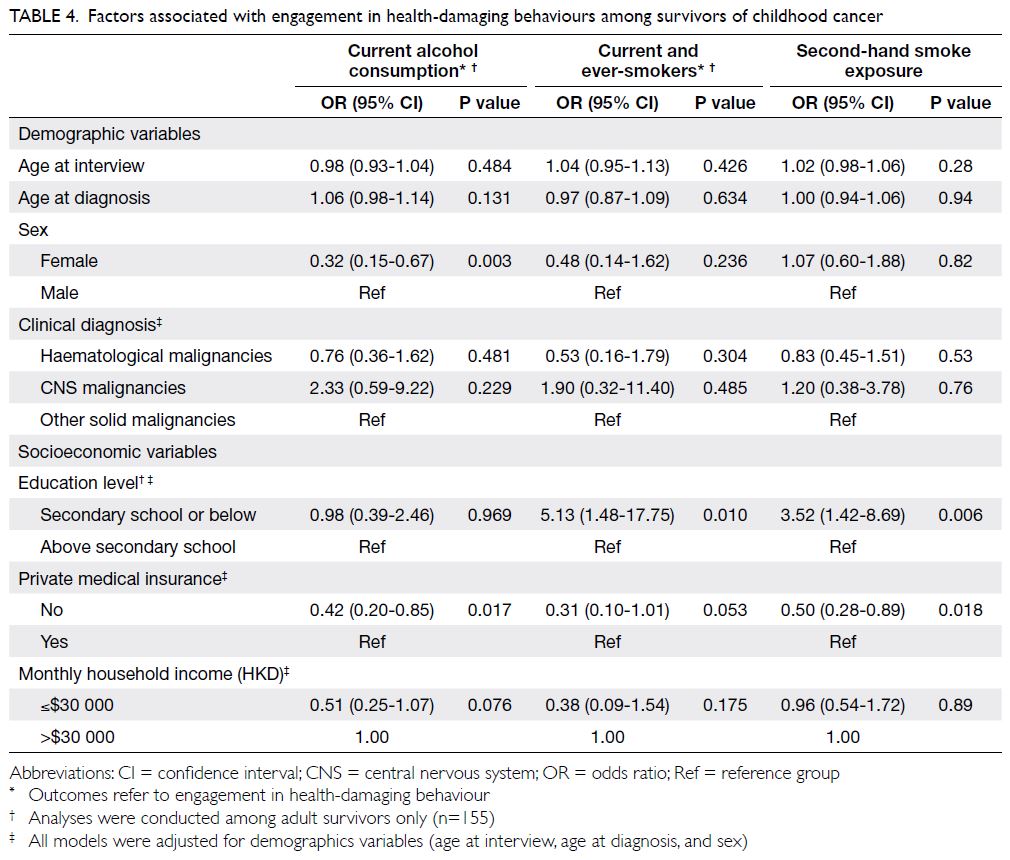
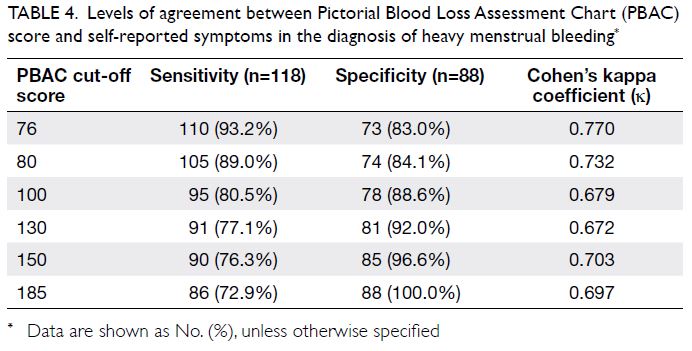
Table 4. Factors associated with engagement in health-damaging behaviours among survivors of childhood cancer
Expectations of a survivorship programme
Nearly all participants stated that the provision of
survivorship education (n=168, 84%) and late-effects
screening services (n=157, 78.5%) would be the most
important components of a survivorship programme
(Fig 2). Moreover, helping survivors to understand
and confront the fear of relapse (n=161, 80.5%) and
addressing psychological distress (n=154, 77%) were
the most popular psychosocial services. Among
parents (n=45), learning how to parent a child with
cancer (n=36, 80%) and psychosocial support for
parents (n=33, 73.3%) were regarded as essential
components.
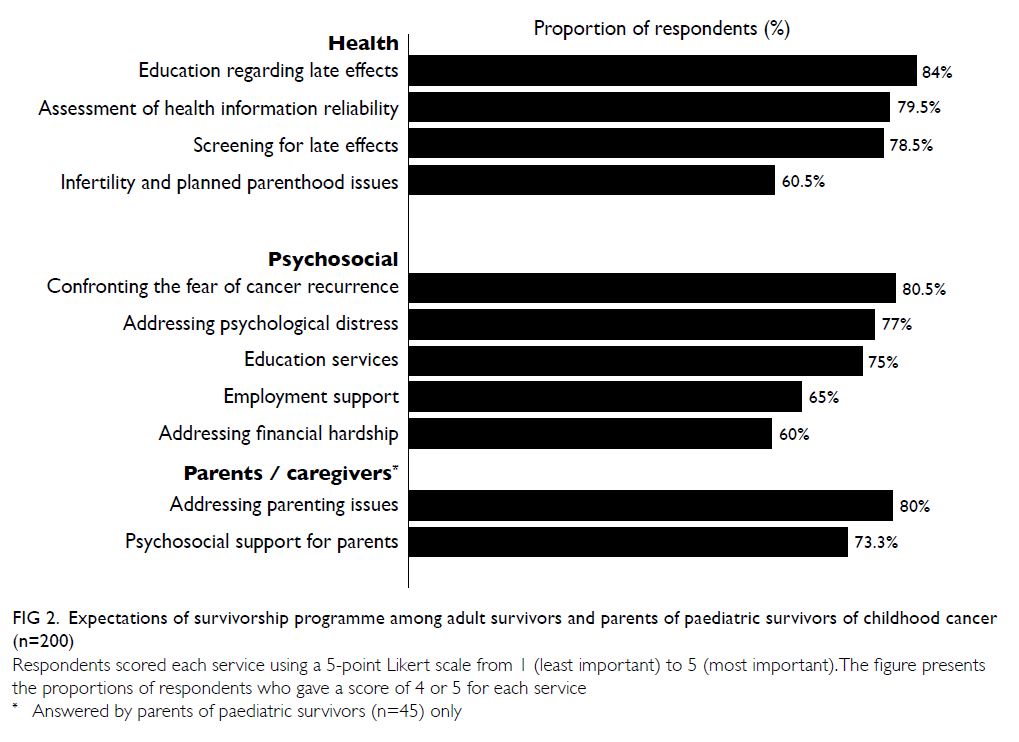
Figure 2. Expectations of survivorship programme among adult survivors and parents of paediatric survivors of childhood cancer (n=200)
Most participants (n=81, 40.5%) stated that
their preferred enrolment time into a survivorship
programme would be at the initiation of cancer
treatment; some participants (n=58, 29.0%) stated
that their preferred enrolment time would be
during the transition from active treatment to
follow-up (Table 5). In terms of modes of services,
most respondents preferred dialogue sessions with
healthcare professionals (n=156, 78.0%), interactive
platforms (n=100, 50.0%), and support groups
(n=101, 50.5%) [Table 5].
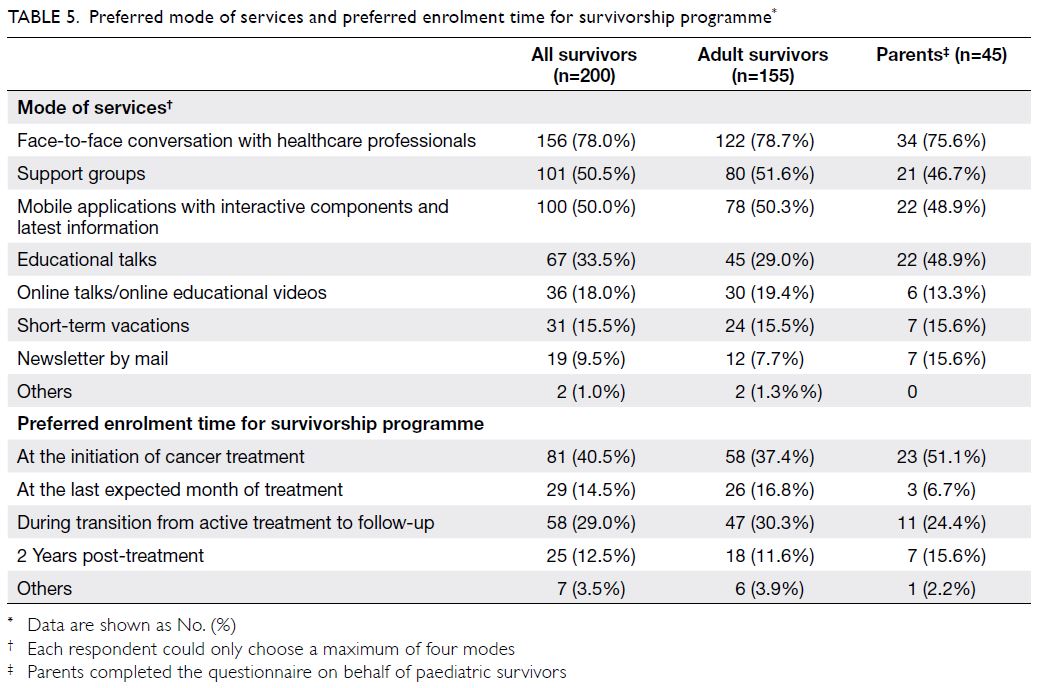
Table 5. Preferred mode of services and preferred enrolment time for survivorship programme
Discussion
Health-protective behaviours
There is growing evidence that physical activity
is a therapeutic strategy that may reduce the risks
of systemic recurrence and mortality in cancer
survivors.22 Similar to findings from other countries,
we found that physical inactivity was highly
prevalent among survivors of childhood cancer.9 23
This observation was not surprising, considering that the rate of physical activity is low among the
general population in Hong Kong; only 40% to 46% of
children and youth met physical activity guidelines
for a mean duration of 60 minutes of moderate-to-vigorous
physical activity per day.24 Although we did
not identify any significant predictors of physical
inactivity, this large proportion of inactive survivors
indicates the need to further explore the reasons
for this phenomenon and devise interventions to
address them. For example, interventions targeting
the survivor–parent dyad may promote common
lifestyle behaviours within the families of survivors.25
Moreover, local adventure-based training and
experiential learning programmes may enhance self-efficacy
in survivors, thereby empowering them to
initiate and maintain a physically active lifestyle.26 27
Our study found that only 38% of survivors
reported frequently consuming a balanced diet.
For example, survivors of CNS tumours were
more likely to have poor dietary habits, compared
with survivors of non-CNS malignancies. This is
concerning because patients with CNS tumours are
more vulnerable to developing metabolic syndromes related to complications associated with cranial
radiation and neurosurgery. Poor dietary habits may
further exacerbate the disease course of these late
effects.28 This finding suggests that dietitians should
give advice regarding stricter dietary control to
optimise the health of CNS cancer survivors in Hong
Kong.
Despite the extensive promotion of the seasonal
influenza vaccination programme by the Hong Kong
Special Administrative Region Government,29 only
30% of survivors indicated that they had received the
influenza vaccine in the past year. Younger survivors
were more likely to have participated in vaccination
programmes, probably because school-age children
are generally enrolled into the government
immunisation programme that provides the hepatitis
B, pneumococcal, and annual influenza vaccines, as
well as the recently added human papillomavirus
(HPV) vaccine.30 We acknowledge that our findings
must be interpreted with caution because survivors
might inaccurately recall or report their vaccination
histories. However, these results have two important
implications that warrant attention from the medical community. First, there is a need to educate
survivors regarding the role of vaccination in
preventing severe complications from infection (eg,
influenza and pneumococcal vaccines for preventing
seasonal flu and pneumonia, respectively) and
other malignancies (eg, HPV vaccine for preventing
cervical cancer). In particular, collaborations among
schools and community physicians may help promote
the uptake of HPV vaccines among adolescent
female survivors.31 32 Second, children treated
with chemotherapy for childhood malignancies
reportedly may develop acquired immunological
defects in both cell-mediated and humoral immunity,
resulting in the loss of protection conferred by
prior vaccinations.33 Future work should involve
the development of clinical consensus guidelines
regarding vaccination administration schedules
for non-transplant survivors of childhood cancer,
particularly survivors who have received intensive
chemotherapy treatment.
Health-damaging behaviours
Similar to the findings of Chan et al,13 we found that
health-damaging practices are uncommon among
local survivors. Both drinking and smoking rates
were lower in this study than in studies from other
developed countries.9 19 34 However, the reported rate
(20.5%) of exposure to second-hand smoke in the
home was surprisingly high. We speculate that this
high rate is because the smoking rates of individuals
above the age of 40 years remain relatively high in the
general population (16.9% to 26.2% in men and 1.3% to
5.1% in women).35 Older family members, particularly
men, might remain the main source of second-hand
smoke for survivors. This observation underscores
the need for continual efforts to encourage survivors
to abstain from harmful health practices (particularly
during the early survivorship phase) and the need for
smoking cessation interventions to be provided for
the comparatively few survivors and family members
who are current smokers.
Socioeconomic factors
In this study, lower socioeconomic status was
significantly associated with poor health practices.
The association between possession of private
medical insurance and immunisation practice was
close to statistically significant, further suggesting
that socioeconomic disparities hinder access to
preventive care among cancer survivors. Underserved
survivors may require special navigation services to
support their adherence to surveillance, preventive
care, and health-protective behaviours.36 Considering
that only half of the survivors had private health
insurance, collaborations between clinicians and
policymakers could enable the establishment of
a universal vaccination and late-effects screening
programme for cancer survivors. Local research is
needed to identify barriers to—and facilitators of—quality care and effective methods of outreach to
underserved survivors.
Survivorship care
Most survivors indicated that they would prefer to be
enrolled into a survivorship programme early in the
cancer care continuum. This is a promising prospect
because survivors who had early access to structured
survivorship programmes reportedly were more
aware of their late effects, visited emergency
departments less frequently, had higher cancer-specific
health literacy, and tended to experience
less emotional stress.3 Therefore, a structured
survivorship programme is recommended to include
cancer and late-effects screening, a specialist referral
network, and psychosocial services for survivors and
caregivers (Fig 3).4 12 In Hong Kong, the five major institutions that provide paediatric oncology care
typically include these core services in their long-term
follow-up programmes, although the specific
services offered may differ among institutions.
Overall, the centralisation of paediatric oncology
services in the new Hong Kong Children’s Hospital
has provided an unprecedented opportunity for
oncologists and allied health professionals to initiate
a formal paediatric cancer survivorship programme
in Hong Kong. This will facilitate the development
of a survivorship care model that is tailored to the
healthcare system in Hong Kong.
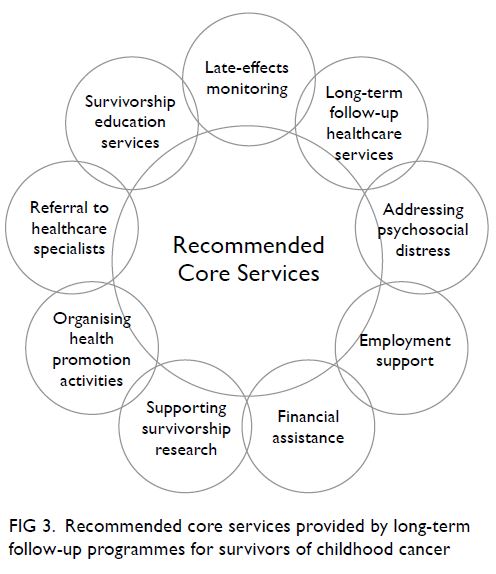
Figure 3. Recommended core services provided by long-term follow-up programmes for survivors of childhood cancer
Our participants regarded services concerning
health issues (eg, education and screening for late
effects) as the most important aspects of survivorship
care. The COG has developed a set of “risk-based”
guidelines, which refer to a personalised systematic
plan of regular screening, surveillance, and
prevention strategies based on a patient’s treatment,
cancer experience, and personal factors.5 10 In an
effort to improve the awareness of health issues in
Chinese cancer survivors, we collaborated with the
COG and launched a Chinese version of the Health
Links patient education materials in May 2020.10 To
our knowledge, this is the first set of publicly available
authoritative resources regarding late effects that is
written in a native Chinese language. Such initiatives
are anticipated to assist survivors in taking age-appropriate
ownership of their health and engaging
as active partners with their health providers during
the survivorship phase.
Limitations
Our findings should be considered in the context
of the following limitations. First, this single-centre
study comprised a moderately small sample of
survivors who were recruited through a convenience
sampling approach. Moreover, eligible participants
were identified from a long-term follow-up clinic
that had a mean loss to follow-up rate of 15% to
20%. This is a recognised challenge in survivorship
research because this population is often lost to
follow-up from primary paediatric clinics as a
result of their growing independence and mobility
during advancement into adulthood.37 These study
limitations may have introduced sampling bias
because our participants may have been more likely
to be health conscious than non-participants and
survivors who had been lost to follow-up. Hence,
the true uptake of health-protective behaviours
among local survivors may be lower than the rates
reported in this study, and our findings might not
be generalisable to other survivors of childhood
cancer in Hong Kong. Second, social desirability
and recall bias may have affected the accuracy of the
self-reported results. Future studies should adopt
validated and more sensitive instruments to achieve
a more objective evaluation of health behaviour. For example, physical activity and sleep can be
better measured with actigraphy studies. Finally, the
multiple predictors and covariates analysed in this
study may have increased the risk of a Type I error.
However, lifestyle itself is a complex phenotype that
is likely to be influenced by intrinsic and extrinsic
factors. Our findings should be validated using a
larger-scale study that involves the prospective
collection of outcome data to better reflect the
trajectory of health behaviour changes and correlate
these findings with the results in local cancer
survivors.
Conclusion
Despite the low prevalences of health-damaging
behaviours, the frequencies with which Hong Kong
survivors of childhood cancer engaged in health-protective
behaviours were unsatisfactory. These
findings highlight the need to empower survivors
to adopt health-protective behaviours. A potential
intervention opportunity may involve engaging
survivors and families in a structured comprehensive
survivorship programme during their transition to
survivorship. A multidisciplinary and interactive
programme addressing late effects and psychosocial
aspects may address the multifaceted needs of
Hong Kong survivors of childhood cancer. Future
work should aim to improve preventive care for
underserved groups through advocacy and care
coordination.
Author contributions
Concept or design: All authors.
Acquisition of data: YT Cheung, LS Yang, JCT Ma, PHK Woo, TCH Chan, SMS Luk.
Analysis or interpretation of data: YT Cheung, LS Yang, JCT Ma, PHK Woo, TCH Chan, SMS Luk.
Drafting of the manuscript: YT Cheung, TCH Chan, SMS Luk.
Critical revision of the manuscript for important intellectual content: All authors.
All authors had full access to the data, contributed to the study, approved the final version for publication, and take responsibility for its accuracy and integrity.
Conflicts of interest
All authors have disclosed no conflicts of interest.
Acknowledgement
We thank Dr Smita Bhatia and Dr Wendy Landier from
the Institute for Cancer Outcomes and Survivorship,
The University of Alabama in Birmingham, for serving as
consultants on this project.
Declaration
A portion of this work was presented at the 52nd Congress of the International Society of Paediatric Oncology (SIOP)–Virtual conference (14-17 October 2020), as well as the HKPS/HKCOP/HKPNA/HKCPN Joint Annual Scientific
Meeting on 7 November 2020.
Funding/support
This study was supported by the Health and Medical Research Fund Research Fellowship, the Food and Health Bureau, The Government of the Hong Kong Special Administrative Region (Ref 03170047).
Ethics approval
The study protocol was approved by The Joint Chinese University of Hong Kong–New Territories East Cluster
Clinical Research Ethics Committee (Ref: 2018.338). Written
informed consent was obtained from all participants.
References
1. Howlader N, Noone AM, Krapcho M, et al. SEER Cancer
Statistics Review (CSR) 1975-2014. Available from: https://seer.cancer.gov/archive/csr/1975_2014/. Accessed 3 Sep
2020.
2. Hong Kong Cancer Registry, Hospital Authority,
Hong Kong SAR Government. Cancer in children and
adolescents (0-18 years). Available from: https://www3.ha.org.hk/cancereg/children.asp. Accessed 3 Sep 2020.
3. Signorelli C, Wakefield CE, Fardell JE, et al. The impact of
long-term follow-up care for childhood cancer survivors: a
systematic review. Crit Rev Oncol Hematol 2017;114:131-8. Crossref
4. Children’s Oncology Group Nursing Discipline Clinical
Practice Subcommittee/Survivorship in collaboration
with the Late Effects Committee. Establishing and
enhancing services for childhood cancer survivors. Long-term
follow-up program resource guide. 2007. Available from: http://www.survivorshipguidelines.org/pdf/LTFUResourceGuide.pdf. Accessed 3 Sep 2020.
5. Landier W, Bhatia S, Eshelman DA, et al. Development
of risk-based guidelines for paediatric cancer survivors:
the Children’s Oncology Group long-term follow-up
guidelines from the Children’s Oncology Group Late
Effects Committee and Nursing Discipline. J Clin Oncol
2004;22:4979-90. Crossref
6. Hudson MM, Ness KK, Gurney JG, et al. Clinical
ascertainment of health outcomes among adults treated
for childhood cancer. JAMA 2013;309:2371-81. Crossref
7. Poon LH, Yu CP, Peng L, et al. Clinical ascertainment of health outcomes in Asian survivors of childhood cancer: a
systematic review. J Cancer Surviv 2019;13:374-96. Crossref
8. Dixon SB, Bjornard KL, Alberts NM, et al. Factors influencing risk-based care of the childhood cancer survivor
in the 21st century. CA Cancer J Clin 2018;68:133-52. Crossref
9. Ford JS, Barnett M, Werk R. Health behaviours of childhood cancer survivors. Children (Basel) 2014;1:355-73. Crossref
10. Children’s Oncology Group. Long-term follow-up guidelines for survivors of childhood, adolescent, and
young adult cancers, version 5.0. October 2018. Available
from: http://www.survivorshipguidelines.org/pdf/2018/COG_LTFU_Guidelines_v5.pdf. Accessed 3 Sep 2020.
11. George SM, Smith AW. Commentary: understanding risk
behaviour among adolescent cancer survivors–are they
more like healthy adolescents or is cancer a teachable
moment? A commentary on Klosky and colleagues’ article
on health behaviours in survivors of childhood cancer and
their siblings. J Pediatr Psychol 2012;37:647-9. Crossref
12. Nekhlyudov L, Ganz PA, Arora NK, Rowland JH. Going
beyond being lost in transition: a decade of progress in
cancer survivorship. J Clin Oncol 2017;35:1978-81. Crossref
13. Chan CW, Choi KC, Chien WT, et al. Health behaviours
of Chinese childhood cancer survivors: a comparison
study with their siblings. Int J Environ Res Public Health
2020;17:6136. Crossref
14. Centres for Disease Control and Prevention, US
Department of Health & Human Services. Youth risk
behaviour surveillance–United States, 2013. Available
from: https://www.cdc.gov/nchhstp/dear_colleague/2014/dcl-061314-hiv-prep.html. Accessed 4 Sep 2020.
15. Lown EA, Hijiya N, Zhang N, et al. Patterns and predictors
of clustered risky health behaviours among adult survivors
of childhood cancer: a report from the Childhood Cancer
Survivor Study. Cancer 2016;122:2747-56. Crossref
16. Klosky JL, Howell CR, Li Z, et al. Risky health behaviour
among adolescents in the childhood cancer survivor study
cohort. J Pediatr Psychol 2012;37:634-46. Crossref
17. Health and Medical Research Fund, Food and Health
Bureau, Hong Kong SAR Government. Research Fellowship
Scheme Approved Projects since 2016-17. Ref 03170047:
Personalized risk-based care and education for early
survivors of childhood cancer in Hong Kong. Available
from: https://rfs2.fhb.gov.hk/images/fundedproject/Approved_Projects_Fellowship.pdf. Accessed 5 Jan 2021.
18. Landier W, Chen Y, Namdar G, et al. Impact of tailored education on awareness of personal risk for therapy-related complications among childhood cancer survivors.
J Clin Oncol 2015;33:3887-93. Crossref
19. Lown EA, Goldsby R, Mertens AC, et al. Alcohol consumption patterns and risk factors among childhood
cancer survivors compared to siblings and general
population peers. Addiction 2008;103:1139-48. Crossref
20. Devine KA, Mertens AC, Whitton JA, et al. Factors
associated with physical activity among adolescent
and young adult survivors of early childhood cancer: a
report from the childhood cancer survivor study (CCSS).
Psychooncology 2018;27:613-9. Crossref
21. National Institute on Alcohol Abuse and Alcoholism,
National Institute of Health, US Government. Drinking
levels defined. Available from: https://www.niaaa.nih.gov/alcohol-health/overview-alcohol-consumption/moderate-binge-drinking. Accessed 3 Sep 2020.
22. Cormie P, Zopf EM, Zhang X, Schmitz KH. The impact of
exercise on cancer mortality, recurrence, and treatment-related
adverse effects. Epidemiol Rev 2017;39:71-92. Crossref
23. Ness KK, Leisenring WM, Huang S, et al. Predictors of
inactive lifestyle among adult survivors of childhood
cancer: a report from the Childhood Cancer Survivor
Study. Cancer 2009;115:1984-94. Crossref
24. Huang WY, Wong SH, Sit CH, et al. Results from the Hong
Kong’s 2018 report card on physical activity for children
and youth. J Exerc Sci Fit 2019;17:14-9. Crossref
25. Badr H, Paxton RJ, Ater JL, Urbauer D, Demark-Wahnefried W. Health behaviours and weight status of childhood cancer survivors and their parents: similarities
and opportunities for joint interventions. J Am Diet Assoc
2011;111:1917-23. Crossref
26. Li HC, Chung OK, Ho KY, Chiu SY, Lopez V. Effectiveness
of an integrated adventure-based training and health
education program in promoting regular physical activity
among childhood cancer survivors. Psychooncology
2013;22:2601-10. Crossref
27. Ruble K, Scarvalone S, Gallicchio L, Davis C, Wells D.
Group physical activity intervention for childhood cancer
survivors: a pilot study. J Phys Act Health 2016;13:352-9. Crossref
28. Smith WA, Li C, Nottage KA, et al. Lifestyle and metabolic
syndrome in adult survivors of childhood cancer: a
report from the St. Jude Lifetime Cohort Study. Cancer
2014;120:2742-50. Crossref
29. Centre for Health Protection, Department of Health, Hong
Kong SAR Government. Vaccination subsidy scheme–general public. Available from: https://www.chp.gov.hk/en/features/46107.html. Accessed 14 Sep 2020.
30. Family Health Service, Department of Health, Hong Kong
SAR Government. Child health. Schedule of Hong Kong
Childhood Immunisation Programme. Available from: https://www.fhs.gov.hk/english/main_ser/child_health/child_health_recommend.html. Accessed 14 Sep 2020.
31. Chau JP, Lo SH, Choi KC, et al. Effects of a multidisciplinary
team-led school-based human papillomavirus vaccination
health-promotion programme on improving vaccine
acceptance and uptake among female adolescents: a
cluster randomized controlled trial. Medicine (Baltimore)
2020;99:e22072. Crossref
32. Yuen WW, Lee A, Chan PK, Tran L, Sayko E. Uptake of
human papillomavirus (HPV) vaccination in Hong Kong:
facilitators and barriers among adolescent girls and their
parents. PLoS One 2018;13:e0194159. Crossref
33. Han JH, Harmoney KM, Dokmeci E, et al. Dynamic
re-immunization of off-treatment childhood cancer
survivors: an implementation feasibility study. PLoS One
2018;13:e0191804. Crossref
34. Gibson TM, Liu W, Armstrong GT, et al. Longitudinal
smoking patterns in survivors of childhood cancer: an
update from the Childhood Cancer Survivor Study. Cancer
2015;121:4035-43. Crossref
35. Census and Statistics Department, Hong Kong SAR
Government. Pattern of smoking. In: Census and Statistics
Department, The Government of the Hong Kong Special
Administrative Region. Hong Kong Monthly Digest of
Statistics January 2019. Available from: https://www.statistics.gov.hk/pub/B10100022019MM01B0100.pdf. Accessed 14 Sep 2020.
36. Lee Smith J, Hall IJ. Advancing health equity in cancer survivorship: opportunities for public health. Am J Prev
Med 2015;49:S477-82. Crossref
37. Rokitka DA, Curtin C, Heffler JE, Zevon MA, Attwood K,
Mahoney MC. Patterns of loss to follow-up care among
childhood cancer survivors. J Adolesc Young Adult Oncol
2017;6:67-73. Crossref