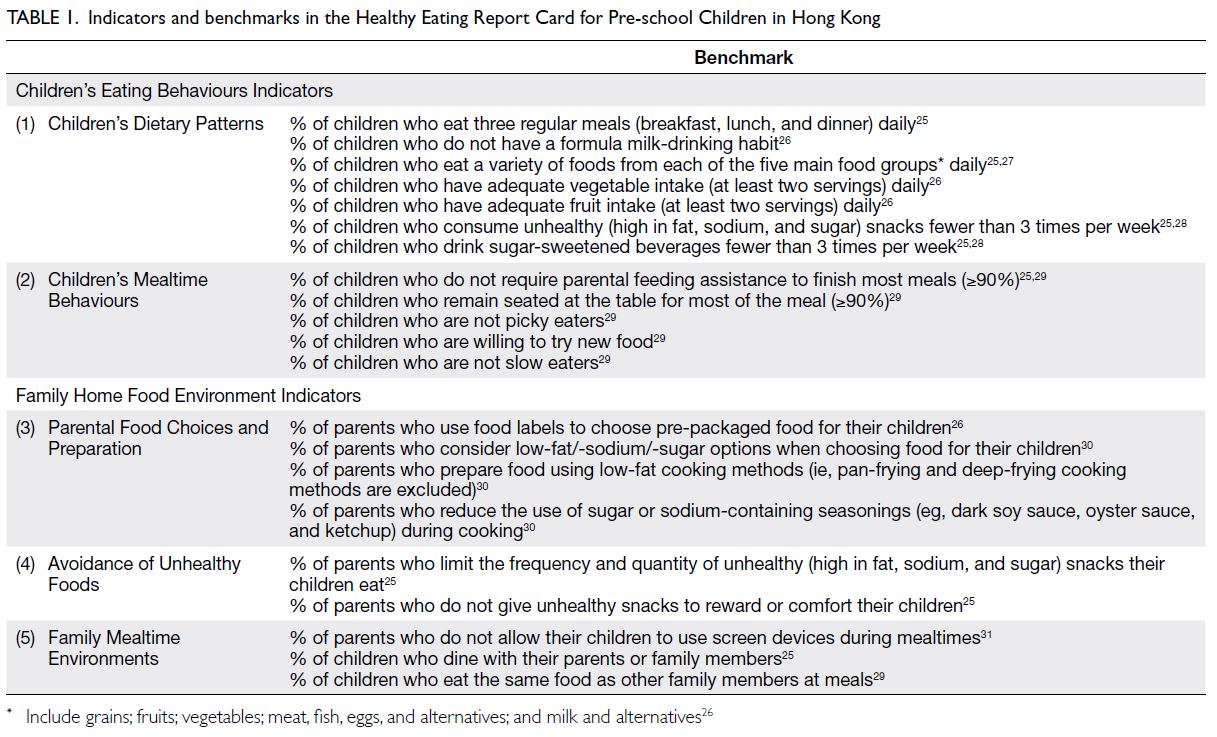
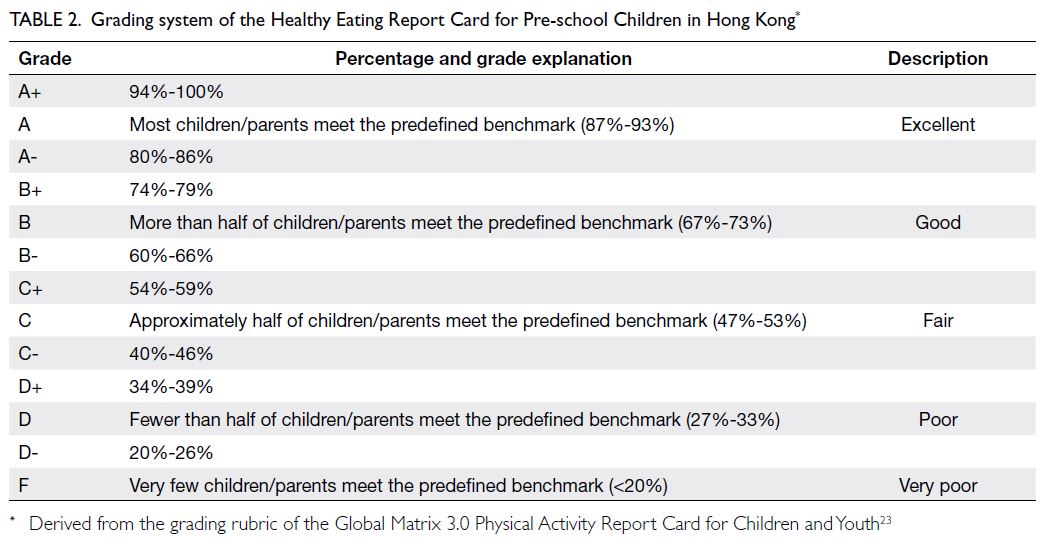
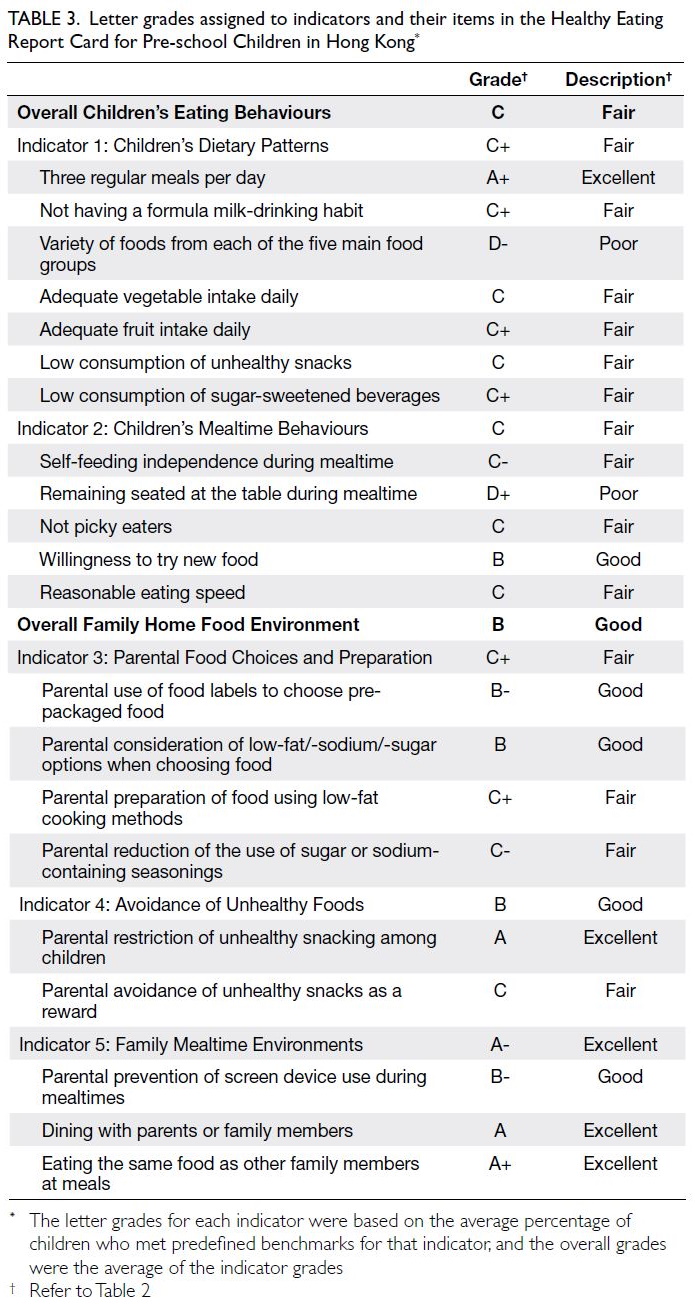
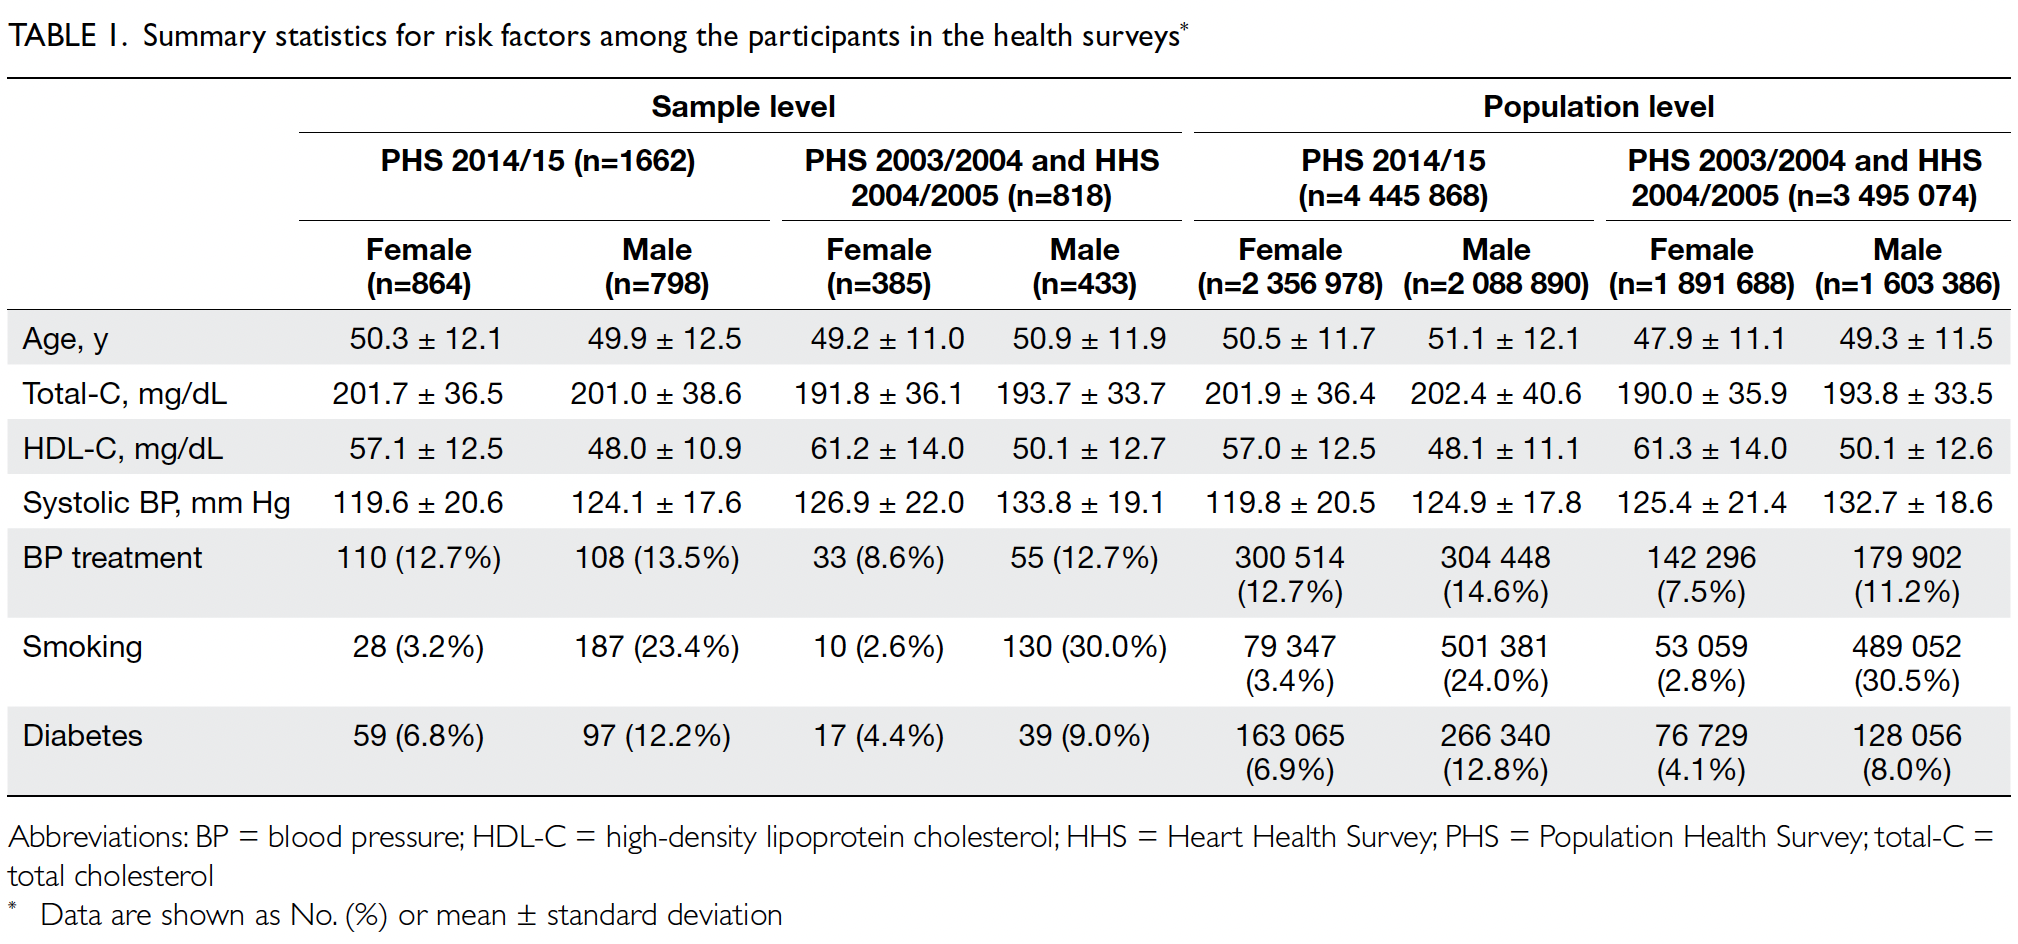
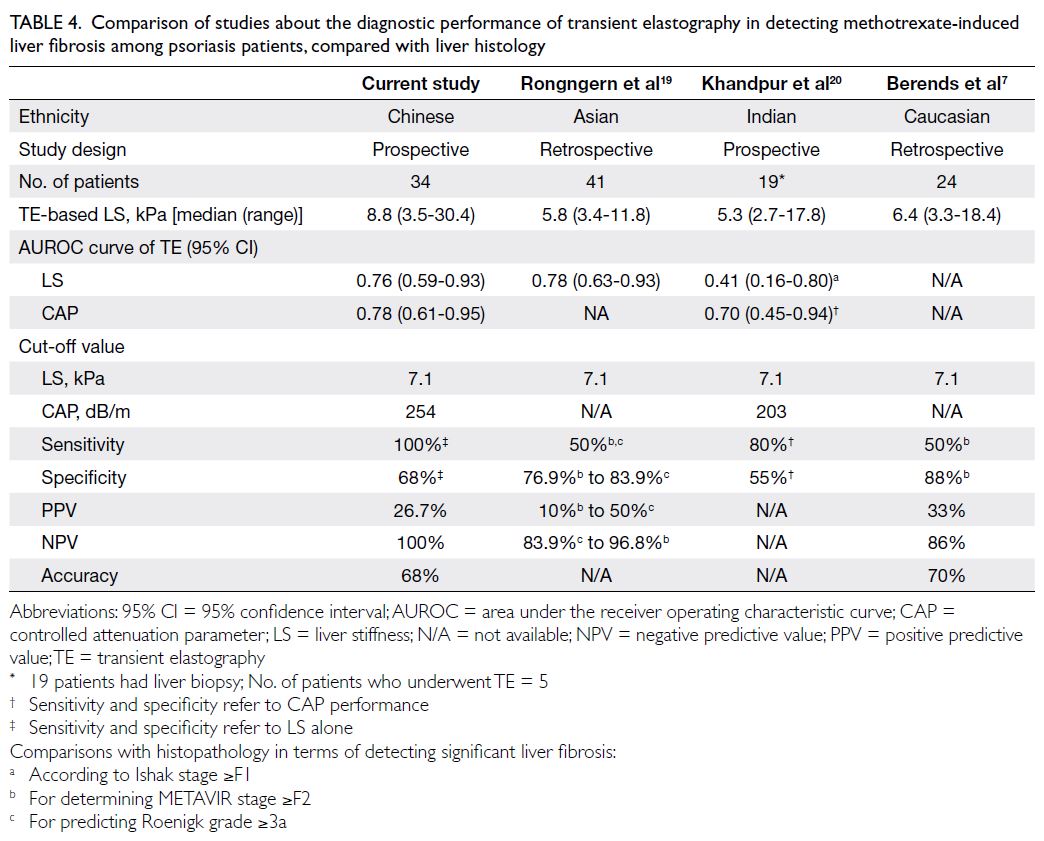
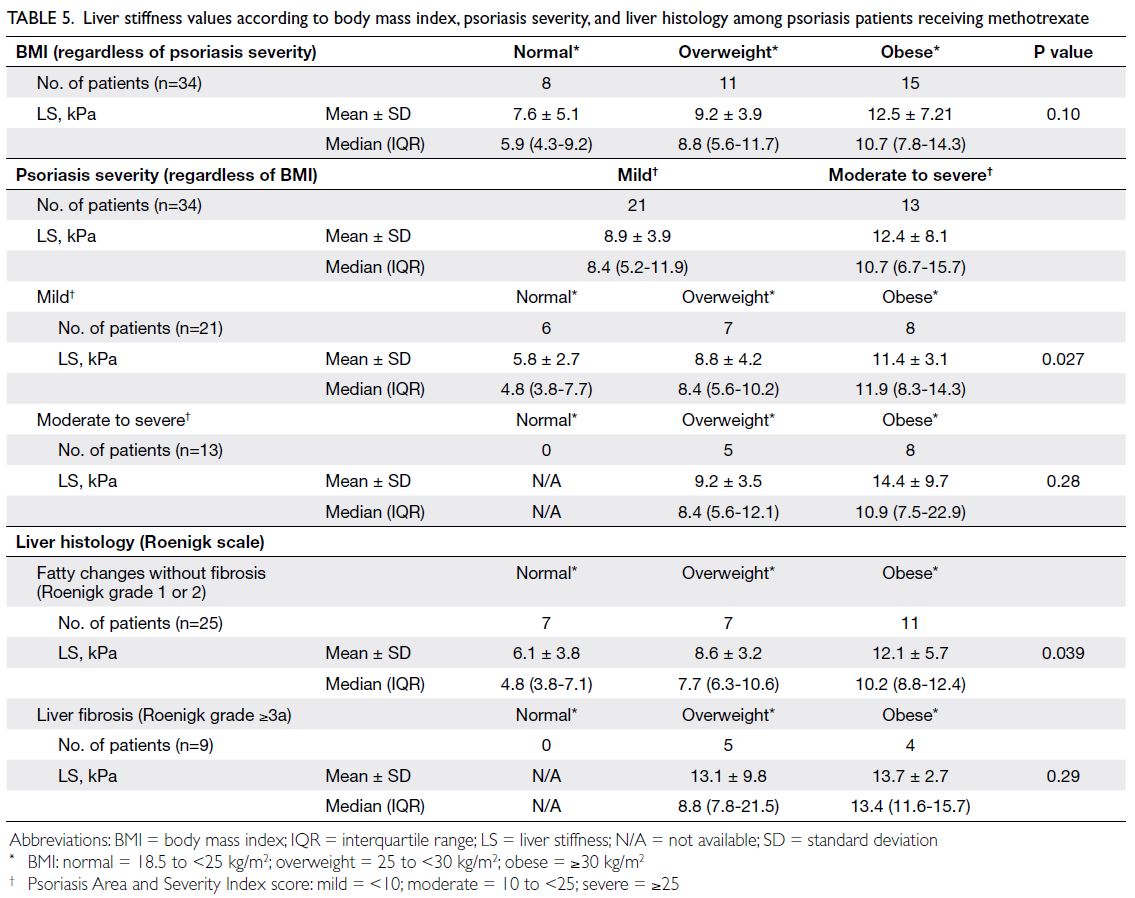
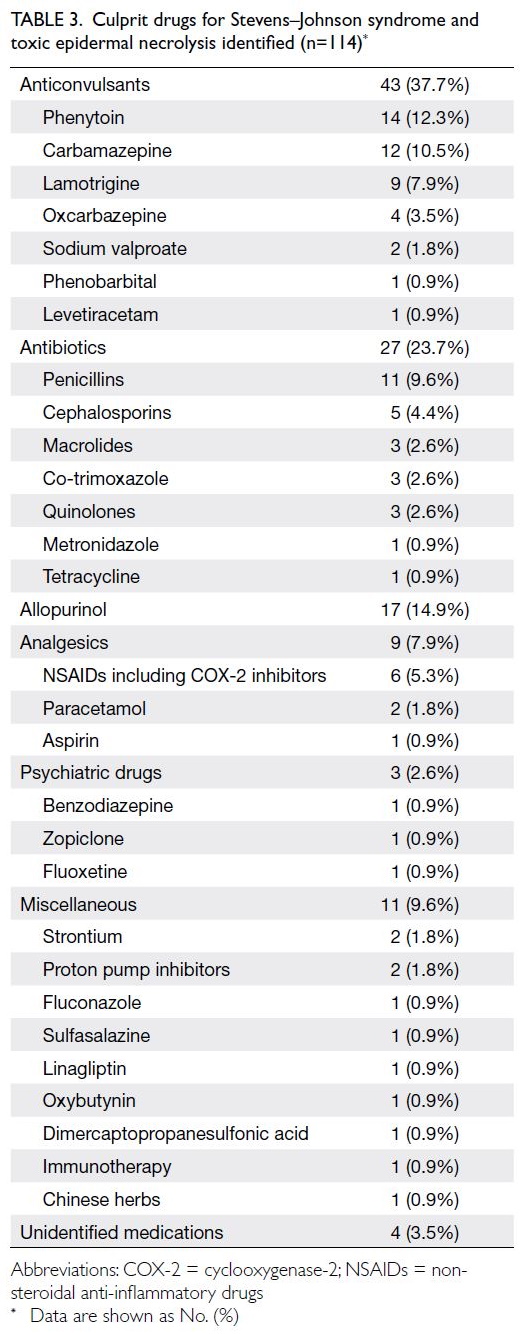
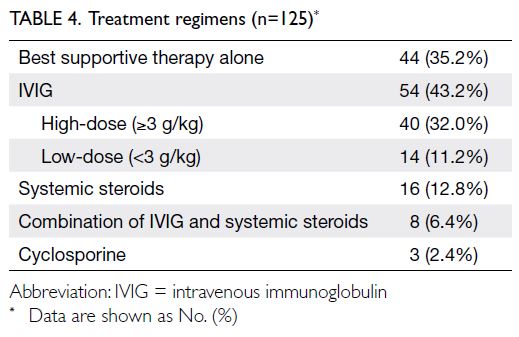
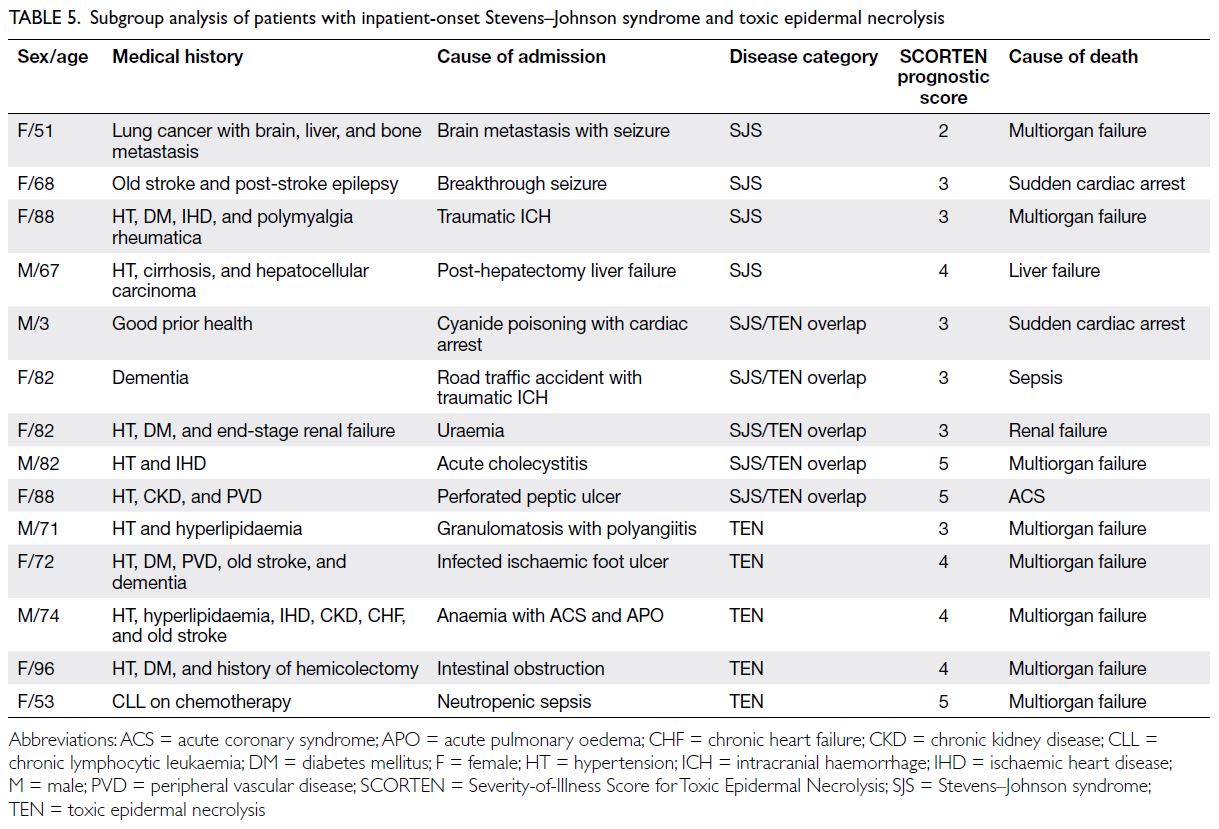
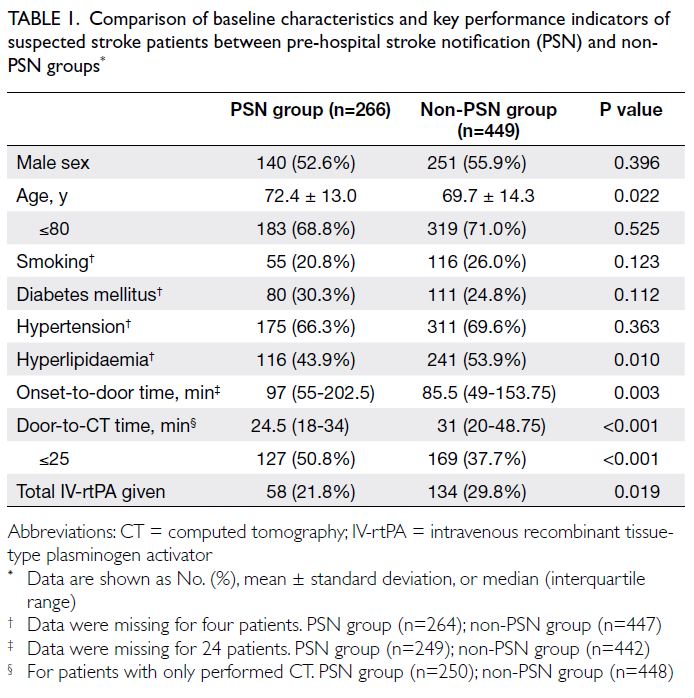
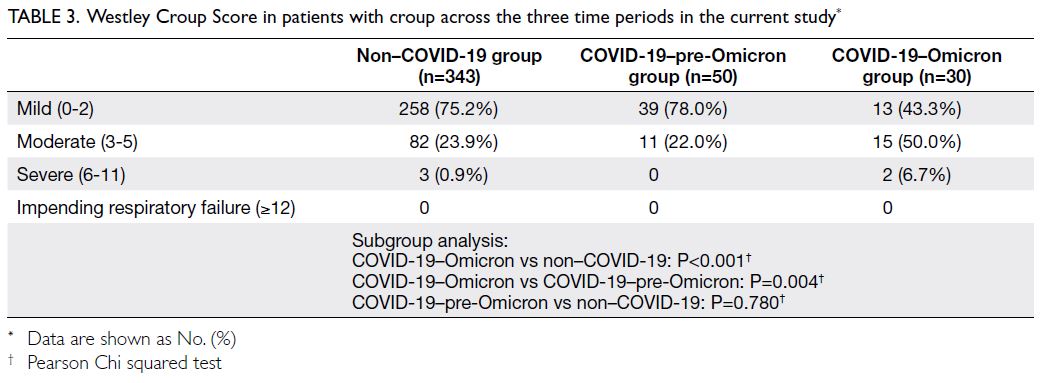
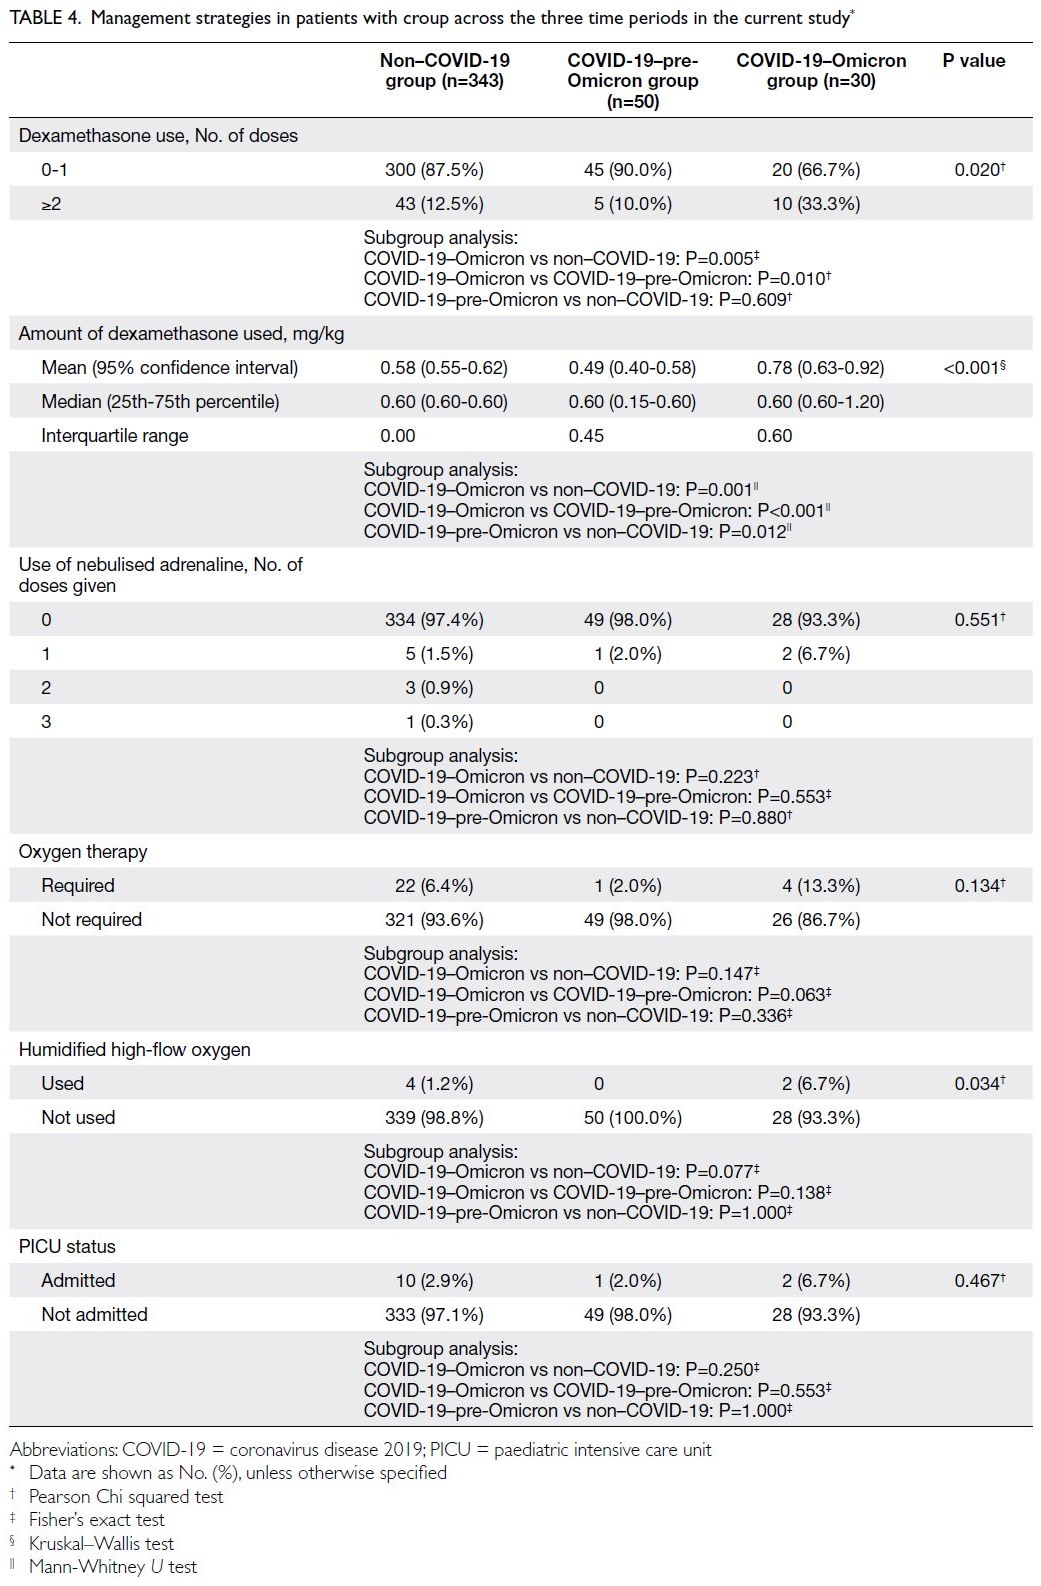
Amniotic fluid gamma-glutamyl transferase for prediction of biliary atresia in cases of non-visualisation of the fetal gallbladder: a retrospective study using a validated analytical platform and local reference range
Hong Kong Med J 2024 Jun;30(3):218–26 | Epub 5 Jun 2024
© Hong Kong Academy of Medicine. CC BY-NC-ND 4.0
ORIGINAL ARTICLE
Amniotic fluid gamma-glutamyl transferase for prediction of biliary atresia in cases of non-visualisation of the fetal gallbladder: a retrospective study using a validated analytical platform and local reference range
Tommy YT Cheung, MB, ChB1,2; Natalie KL Wong, MB, ChB, MRCOG3; Daljit Singh Sahota, PhD3; Shreenidhi Ranganatha Subramaniam, MB, ChB1; SL Lau, MB, ChB, MRCOG3; X Zhu, MB, BS, PhD3; WT Lui, MPhil3; Edwin KW Chan, FHKAM (Surgery), FRCSEd (Paed)4; Yvonne KY Kwok, PhD3; KW Choy, PhD3; TY Leung, MD, FRCOG3; Michael HM Chan, FHKCPath, FHKAM (Pathology)5; Felix CK Wong, MB, BS, FRCPA5,6 #; YH Ting, FHKAM (Obstetrics and Gynaecology), FRCOG3 #
1 Department of Chemical Pathology, The Chinese University of Hong Kong, Hong Kong SAR, China
2 Department of Chemical Pathology, Princess Margaret Hospital, Hong Kong SAR, China
3 Department of Obstetrics and Gynaecology, The Chinese University of Hong Kong, Hong Kong SAR, China
4 Division of Paediatric Surgery and Paediatric Urology, Department of Surgery, Prince of Wales Hospital, Hong Kong SAR, China
5 Department of Chemical Pathology, Prince of Wales Hospital, Hong Kong SAR, China
6 Division of Chemical Pathology, Department of Pathology, Queen Mary Hospital, Hong Kong SAR, China
# Equal contribution
Corresponding author: Dr YH Ting (tingyh@cuhk.edu.hk)
 Full paper in PDF
Abstract
Introduction: The level of amniotic fluid gamma-glutamyl
transferase (AFGGT) may help identify
biliary atresia (BA) in cases of non-visualisation of
the fetal gallbladder (NVFGB). This study aimed
to validate a serum/plasma matrix–based gamma-glutamyl
transferase (GGT) assay for amniotic
fluid (AF) samples, establish a local gestational
age–specific AFGGT reference range, and evaluate
the efficacy of AFGGT for predicting fetal BA in
pregnancies with NVFGB using the constructed
reference range.
Methods: The analytical performance of a serum/
plasma matrix–based GGT assay on AF samples was
evaluated using a Cobas c502 analyser. Amniotic
fluid gamma-glutamyl transferase levels in confirmed
euploid singleton pregnancies (16+0 to 22+6 weeks of
gestation) were determined using the same analyser
to establish a local gestational age–specific reference
range (the 2.5th to 97.5th percentiles). This local
reference range was used to determine the positive
predictive value (PPV) and negative predictive
value (NPV) of AFGGT level <2.5th percentile for
identifying fetal BA in euploid pregnancies with
NVFGB.
Results: The serum/plasma matrix–based GGT
assay was able to reliably and accurately determine
GGT levels in AF samples. Using the constructed
local gestational age–specific AFGGT reference
range, the NPV and PPV of AFGGT level <2.5th
percentile for predicting fetal BA in pregnancies
with NVFGB were 100% and 25% (95% confidence
interval=0, 53), respectively.
Conclusion: In pregnancies with NVFGB, AFGGT
level ≥2.5th percentile likely excludes fetal BA.
Although AFGGT level <2.5th percentile is not
diagnostic of fetal BA, fetuses with AFGGT below
this level should be referred for early postnatal
investigation.
New knowledge added by this study
- A serum/plasma matrix–based gamma-glutamyl transferase (GGT) assay reliably and accurately determines GGT levels in amniotic fluid samples.
- Using amniotic fluid gamma-glutamyl transferase (AFGGT) level <2.5th percentile to identify biliary atresia (BA) in cases of non-visualisation of the fetal gallbladder (NVFGB), the negative and positive predictive values were 100% and 25%, respectively.
- A local gestational age–specific AFGGT reference range (the 2.5th to 97.5th percentiles) is available for clinical use.
- In pregnancies with NVFGB, AFGGT level ≥2.5th percentile likely excludes fetal BA; although AFGGT level <2.5th percentile is not diagnostic of BA, it is an important indicator of the need for early postnatal investigation.
Introduction
Non-visualisation of the fetal gallbladder (NVFGB)
in the second trimester is a rare condition affecting
0.1% of pregnancies.1 It might be a transient
finding—the gallbladder is visible later in pregnancy
or after birth in 70% of cases.2 Persistent NVFGB
may be associated with benign conditions (eg,
gallbladder agenesis); it may also be a manifestation
of serious disorders, such as biliary atresia (BA),
cystic fibrosis, or chromosomal abnormalities.3
Although chromosomal abnormalities and cystic
fibrosis can be identified prenatally via chromosomal
microarray (CMA) and sequencing of the cystic
fibrosis transmembrane conductance regulator
gene, respectively, it remains challenging to diagnose
BA before birth because no diagnostic prenatal test
is currently available. Biliary atresia is a devastating
condition and is the leading indication for liver
transplantation in childhood.4 Prenatal suspicion of
BA allows prompt postnatal assessment and early
diagnosis, permitting timely intervention via Kasai
hepatoportoenterostomy and resulting in improved
outcomes.4
The measurement of gamma-glutamyl
transferase (GGT) in amniotic fluid (AF) has been
suggested as a method for prenatal detection of BA. This transferase is secreted by the fetal biliary tract,
passes into the intestines, and is ultimately excreted
into the amniotic cavity. It becomes detectable in AF
at around 14 weeks of gestation upon maturation
of the intestinal villi and opening of the cloacal
membrane.5 6 7 Biliary tract obstructions, such as
BA, hinder the passage of GGT into the intestines
and AF, leading to reduced levels of amniotic fluid
gamma-glutamyl transferase (AFGGT). Muller et al5
first reported extremely low AFGGT levels in three
fetuses with extrahepatic bile duct obstruction at
18 to 19 weeks of gestation; they concluded that a
low AFGGT level could be a useful indicator of BA.
Subsequently, Burc et al,6 Dreux et al,8 and Bardin et al9
reported similar findings. Nevertheless, existing
platforms for analysis of GGT in serum or plasma
samples have not been thoroughly validated for
use with AF samples. Furthermore, an appropriate
reference range, essential for the interpretation
of AFGGT results, is difficult to establish due to
the limited availability of AF samples from normal
pregnancies. Thus, publications regarding gestational
age–specific reference ranges for AFGGT have been
scarce.
Burc et al6 established reference values for
five AF enzymes (AFEs), including GGT, using the
Hitachi 911 analyser (Roche Diagnostics). Despite a
large sample size of 508, no separate reference range
was constructed for each gestational age from 20
to 24 weeks, limiting clinical use of the findings.6 Bardin et al7 established another reference range for
AFGGT, from 16 to 22 weeks, using the Integra 800
analyser (Roche). However, the numbers of samples
at weeks 16, 21, and 22 were small and had relatively
large standard deviations, precluding clinical
application.7 Both reference ranges were derived
from Caucasian populations. Because the GGT
level in adult blood varies according to ethnicity,10
it is likely that AFGGT levels also vary according
to ethnicity; thus, there is a need to establish a
local AFGGT reference range. Furthermore, both
previous reference ranges covered the 5th to 95th
percentiles. A wider reference range, from the 2.5th
to 97.5th percentiles, would allow greater flexibility
in selecting cut-off values for clinical application.
In this study, we aimed to validate a serum/plasma matrix–based GGT assay for AF samples, establish a local gestational age–specific reference
range for AFGGT (from the 2.5th to 97.5th
percentiles), and evaluate the efficacy of AFGGT
for predicting fetal BA in pregnancies with NVFGB
using the constructed reference range.
Methods
This retrospective study used archived AF
supernatant obtained from amniocentesis
procedures that had been conducted to exclude
fetal chromosomal abnormalities between January 2012 and December 2021. All amniocenteses were
performed under ultrasound guidance with aseptic
technique by fetal-maternal medicine specialists who
also performed detailed ultrasound examinations to
document the presence or absence of fetal structural
abnormalities. All AF samples were centrifuged
at 100 g for 10 minutes; 1 mL of the resulting
supernatant was stored at -80℃ in plain aliquots
without additives (Axygen; BioGene, Union City
[CA], United States), whereas the pellet was used
for either CMA and/or karyotyping by G-banding
analysis. The cytogenetic laboratory information
system recorded the ultrasound findings, indication
for amniocentesis, gestational age at amniocentesis,
and CMA and/or karyotype results. Pregnancy
and fetal outcomes, including the presence of any
abnormalities at birth or autopsy findings, were
recorded in each patient’s electronic records.
Patients
Archived AF samples with known fetal and pregnancy outcomes, taken at 16+0 to 22+6 weeks of gestation from singleton pregnancies with a euploid
fetus (confirmed by CMA or karyotype) during the
period from January 2018 to December 2020, were
retrieved to establish a gestational age–specific
reference range for GGT. Pregnancies with fetal
chromosomal, gastrointestinal, or hepatobiliary
anomalies (particularly BA) polyhydramnios,
or oligohydramnios were excluded to eliminate
potential confounding effects of these conditions.
Non-visualisation of the fetal gallbladder was
incidentally detected during fetal morphology scans
in pregnancies with risk factors for fetal abnormalities
because the fetal gallbladder was not assessed in
low-risk routine anomaly scans, in accordance with
the International Society of Ultrasound in Obstetrics
and Gynecology guideline.11 It was defined as failure
to visualise the fetal gallbladder on two targeted
ultrasound examinations performed 1 week apart.
Isolated NVFGB was defined as NVFGB in the
absence of other abnormal ultrasound findings.
Pregnant women were counselled regarding possible
differential diagnoses and offered amniocentesis for
chromosomal analysis, as well as repeated ultrasound
scans until the fetal gallbladder was visible. After
birth, babies with persistent NVFGB were referred
to paediatricians for hepatobiliary ultrasound and
liver function tests. If the gallbladder was visible
during prenatal scans, paediatricians did not order
further tests in the absence of clinical suspicion. We
followed the progress of all babies until the time of
writing, using electronic hospital records for those
delivered in public hospitals and phone calls for
those delivered in private hospitals. With parental
consent, post-mortem examinations were arranged
in pregnancies terminated for serious associated
fetal abnormalities.
Validation and analytical performance
evaluation
Amniotic fluid samples were removed from -80℃ storage in batches, thawed, and equilibrated to room temperature immediately prior to analysis. Gamma-glutamyl
transferase levels were determined using
an International Federation of Clinical Chemistry
and Laboratory Medicine–standardised L-gamma-glutamyl-3-carboxy-4-nitroanilide (GGCNA) enzymatic colorimetric assay on a Cobas c502
analyser (Roche, Basel, Switzerland). Internal quality
controls were performed before and after each batch.
Details of the AFGGT assay validation and
analytical performance, including matrix effects;
linearity; intra- and inter-run precision at various
GGT levels; interference due to haemolysis, icterus,
and lipaemia; and sample stability, are summarised
in online supplementary Appendix 1.
Establishment of reference range
An AFGGT reference range was developed using the
Generalised Additive Models for Location (μ), Scale
(υ) and Shape (σ) [GAMLSS] package in R statistical
software (version 3.3.2; R Foundation for Statistical
Computing, Vienna, Austria). All GGT values were
transformed to their natural log equivalent before
model construction; the final model balanced
between percentile smoothness, goodness-of-fit,
and simplicity. Model fit was assessed using the
generalised Akaike information criterion and by
inspection of residuals with quantile-quantile plots
for all measurements, detrending of quantile-quantile
plots, and comparison of empirical percentiles
to fitted percentiles. Empirical percentiles were
determined for comparative purposes by grouping
GGT levels according to gestational age (in weeks).
The final model was used to determine reference
values for the 2.5th, 5th, 50th, 95th (z = ± 1.645),
and 97.5th percentiles (z = ± 1.964). Percentiles were
determined using the expression μ × (1 + zpυσ)1/υ,
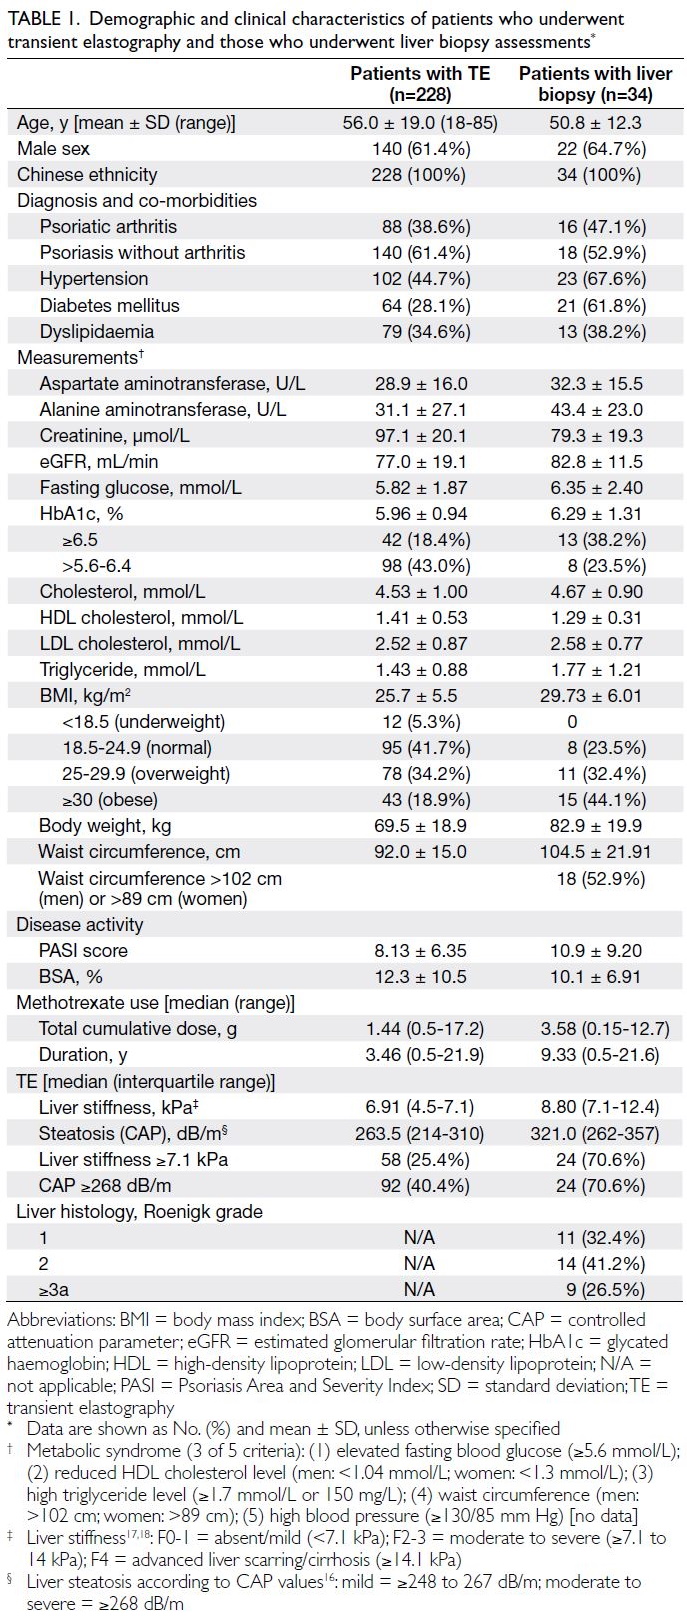
where zp is the percentile of interest and μ, υ, and σ
are dependent on the time covariate, gestational age.
The GGT reference range was constructed using R
statistical software and Microsoft Excel (Microsoft
Corporation, Redmond [WA], United States).
We estimated a priori that 293 AFGGT
measurements were needed to achieve a standard
error of 10% of the gestational age–specific
standard deviation for the 2.5th and 97.5th (z=1.96)
reference percentiles, assuming that the standard
error of the percentile of interest is expressed as a
multiple of standard deviation using the formula 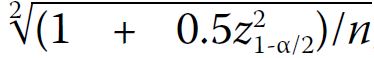 , where each gestational age
between 16+0 and 22+6 weeks has a minimum of 42
measurements.
, where each gestational age
between 16+0 and 22+6 weeks has a minimum of 42
measurements.
, where each gestational age
between 16+0 and 22+6 weeks has a minimum of 42
measurements.Performance evaluation
Measured levels of AFGGT in pregnancies with NVFGB were transformed to their gestational age–specific percentile values using the final model. We
then determined the positive predictive value (PPV)
and negative predictive value (NPV) of AFGGT
level <2.5th percentile for identifying BA in euploid
pregnancies with NVFGB.
Results
Validation and analytical performance
The performance of the GGT assay using AF is
summarised in online supplementary Appendix 2. Validation studies indicated that the GGCNA
enzymatic colorimetric assay for determination of
GGT activity in AF had linearity, precision, recovery,
interference profiles, and stability comparable to
the values reported for measurement of GGT in
plasma and serum samples. The verified analytical
measurement range was 10 to 1200 U/L. No
significant interference was observed in the presence
of 0.25 g/dL haemoglobin, 103 μmol/L bilirubin, or 16.8 mmol/L triglyceride. The limits of haemolysis/icterus/lipaemia indices above which interference
occurred were significantly higher than the degrees
of those indices in all analysed samples.
Gestational age–specific reference range
A database search identified 518 stored amniotic
samples (502 [97%] Chinese and 16 [3%] other Asian
ethnicities) suitable for use in establishing a local
gestational age–specific AFGGT reference range.
The median number of samples per week was 65;
there were 2 weeks with <42 samples (27 and 28
samples in the 16th and 19th week of gestation,
respectively). The online supplementary Table lists
the regressed values of AFGGT levels according to
percentile for each week of gestation.
The simplest best-fit model indicated a linear
relationship between natural log-transformed
GGT and gestational age. Table 1 and the online supplementary Figure show the final smoothing equations for median, coefficient of variation,
and skewness, along with gestational age–specific
smoothed percentile curves and values of AFGGT
for our local population. Residuals of the final model
had a mean skewness of 0 and a variance of 1; they
were almost mesokurtic, with kurtosis values close to 3.
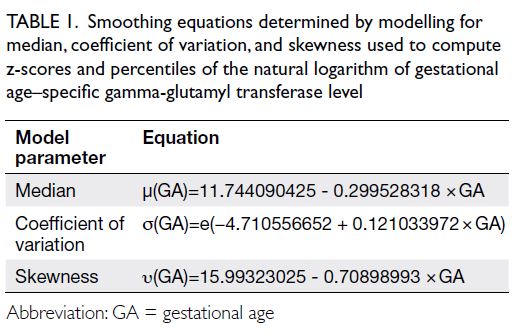
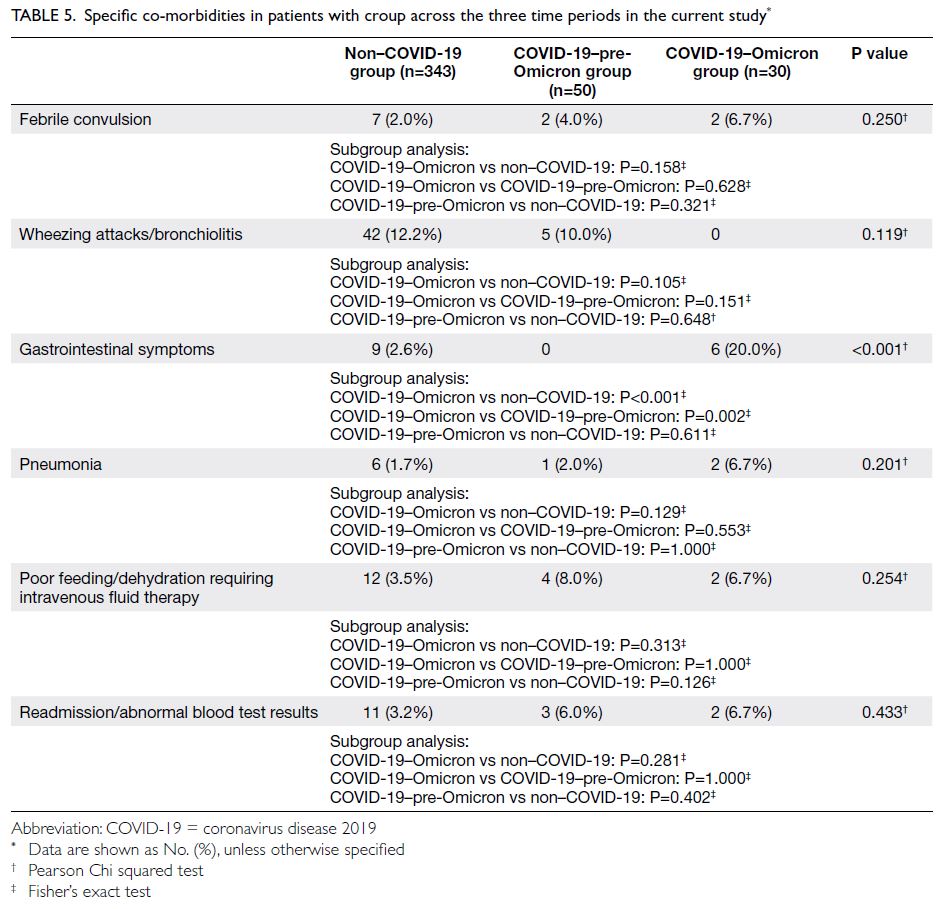
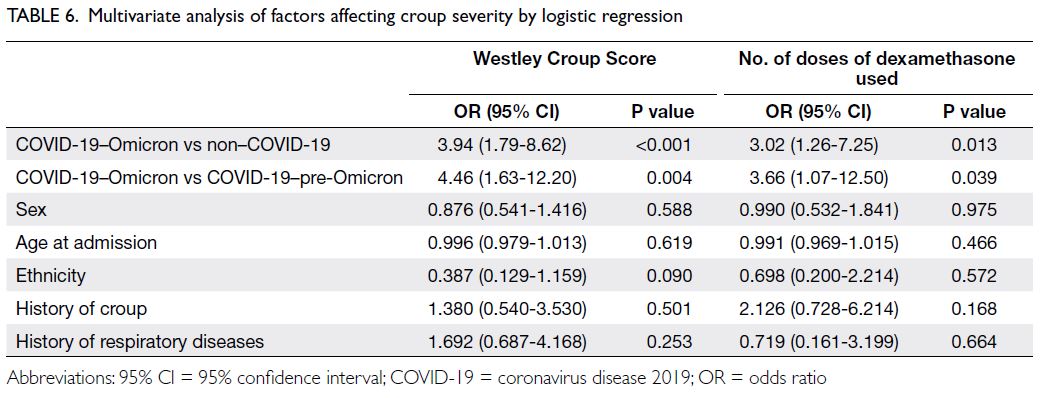
Table 1. Smoothing equations determined by modelling for median, coefficient of variation, and skewness used to compute z-scores and percentiles of the natural logarithm of gestational age–specific gamma-glutamyl transferase level
Performance evaluation
The database search identified 32 pregnancies with
NVFGB from 2012 to 2021, of which 18 had an
available AF sample (four isolated NVFGB and 14
non-isolated NVFGB). There were no cases of cystic
fibrosis. Nine cases were excluded from analysis,
including five with chromosomal abnormalities,
one with renal hypoplasia and oligohydramnios, one
with hydrops and polyhydramnios, and two in which
the biliary tract anatomy could not be identified.
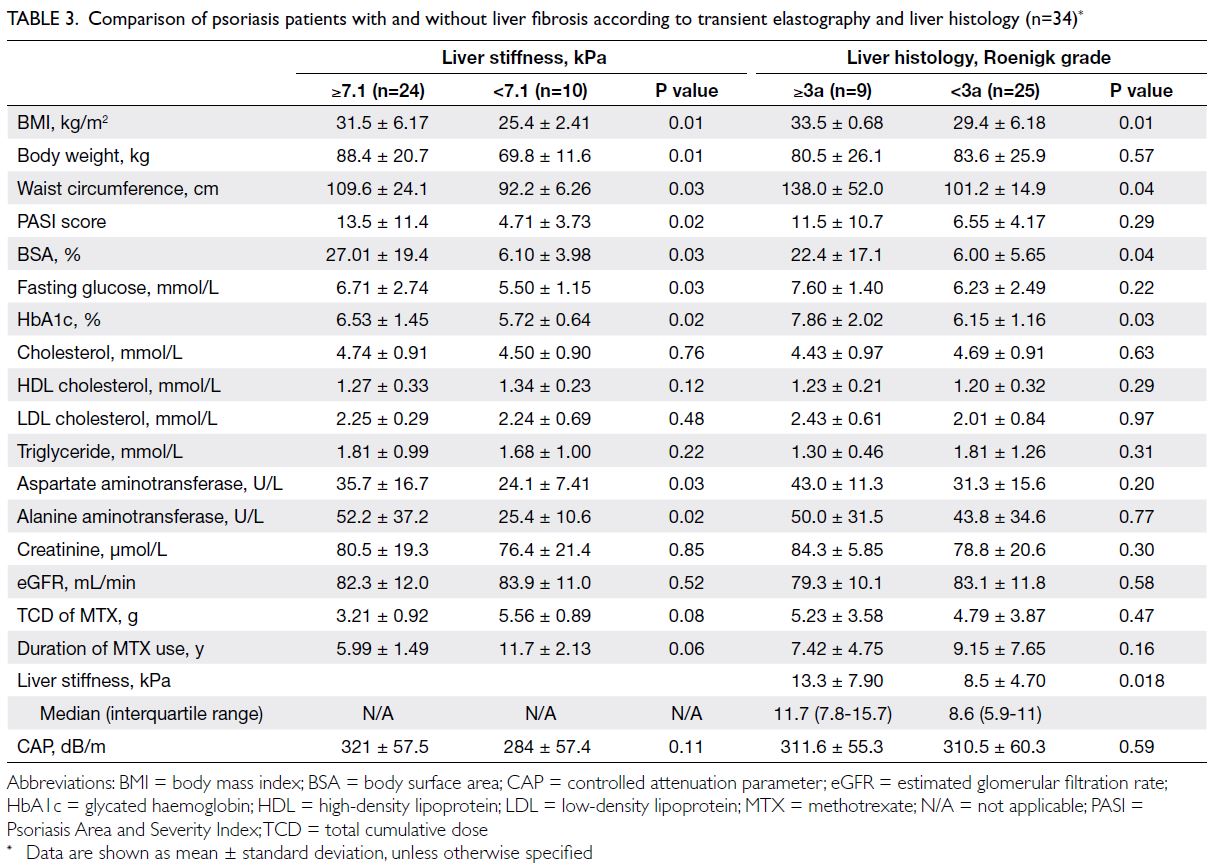
The nine remaining cases for analysis included
four with isolated NVFGB and five with non-isolated
NVFGB (Table 2). The median gestational
age at amniocentesis was 21.0 weeks (interquartile
range=20.7-22.1).
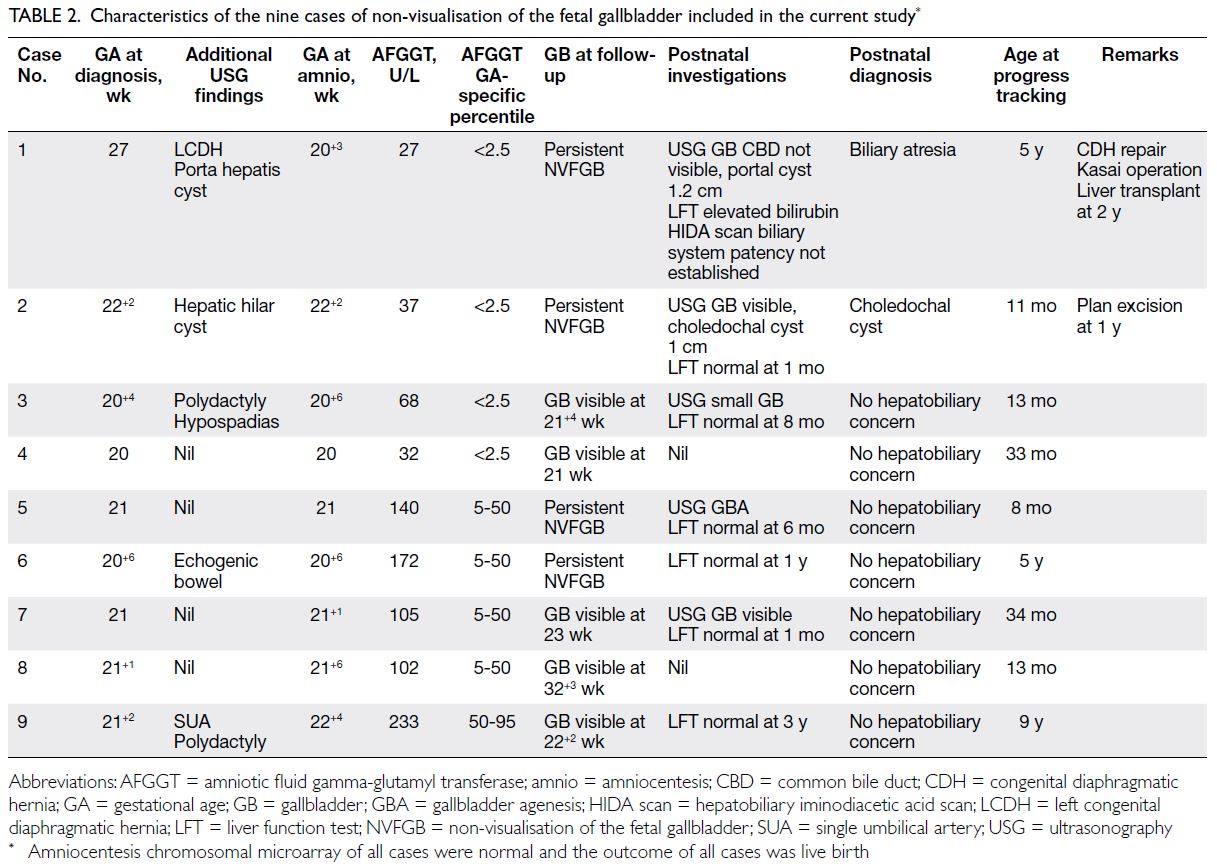
Table 2. Characteristics of the nine cases of non-visualisation of the fetal gallbladder included in the current study
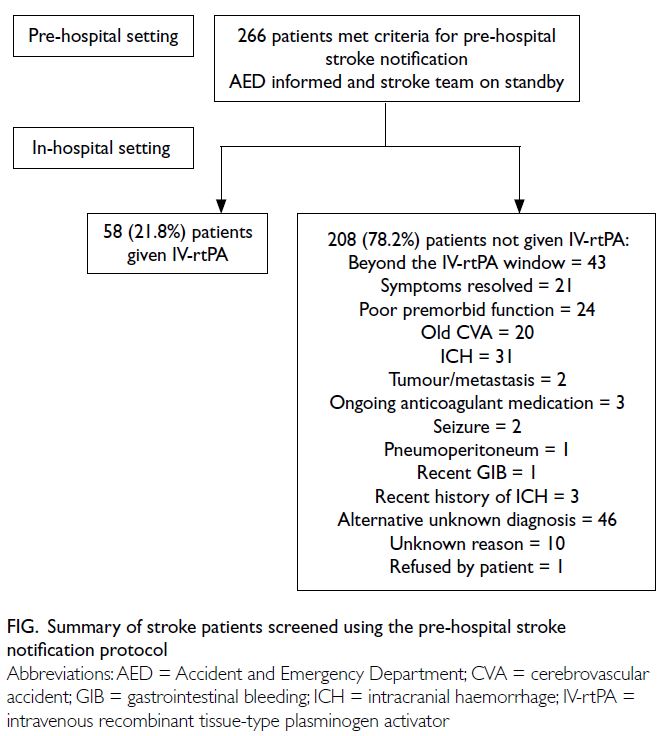
The Figure depicts the AFGGT levels in the
nine pregnancies for analysis compared with our
local gestational age–specific AFGGT reference
range. Four cases had AFGGT level <2.5th percentile,
including one with BA (AFGGT level of 27 U/L at 20+3
weeks) and three with transient non-visualisation
(AFGGT levels of 32, 68, and 37 U/L at 20+0, 20+6,
and 22+2 weeks, respectively). Five had AFGGT level
≥2.5th percentile, including one with gallbladder
agenesis and four with transient non-visualisation
(Table 2). Using AFGGT level <2.5th percentile as
the cut-off, the NPV and PPV for identifying fetal
BA in pregnancies with NVFGB were 100% and
25% (95% confidence interval=0, 53), respectively
(Table 3). Repeated analysis using AFGGT level <5th percentile or the reference ranges from Burc et al6 or Bardin et al7 yielded identical results.
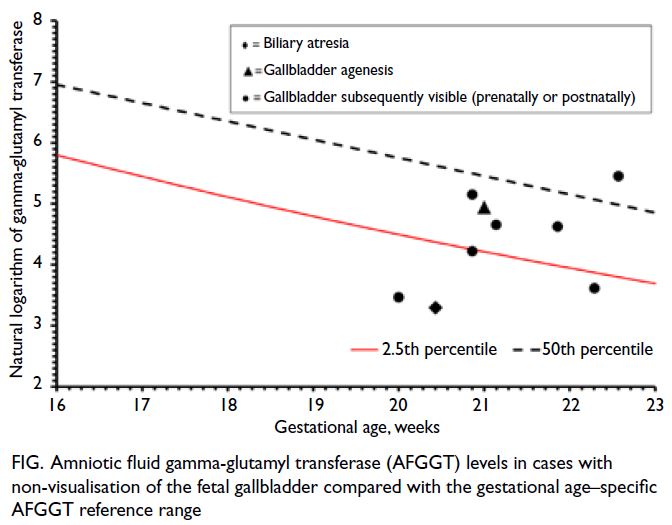
Figure. Amniotic fluid gamma-glutamyl transferase (AFGGT) levels in cases with non-visualisation of the fetal gallbladder compared with the gestational age–specific AFGGT reference range
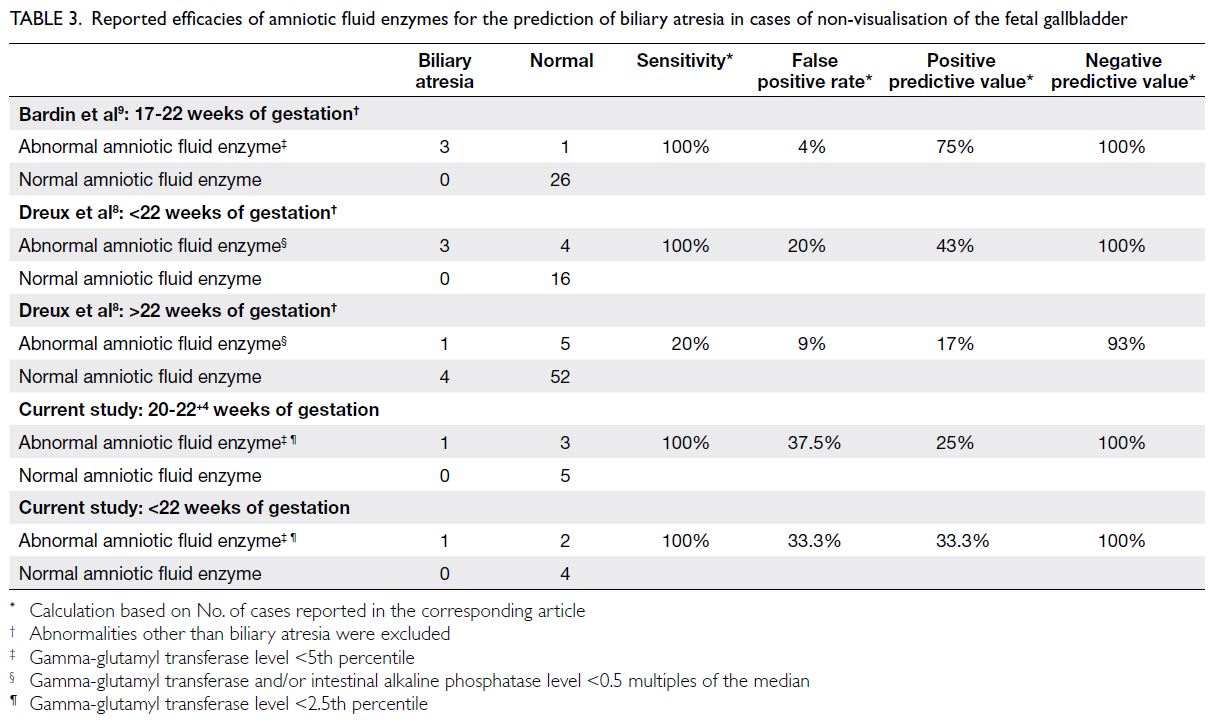
Table 3. Reported efficacies of amniotic fluid enzymes for the prediction of biliary atresia in cases of non-visualisation of the fetal gallbladder
Discussion
Biliary atresia is a rare congenital anomaly, with a
prevalence of 1 in 15 000 to 20 000 live births among
Caucasian populations.12 However, BA is more
common in East Asians; the prevalence is 1 in 5000
to 7000 among Chinese populations.13 14 Untreated
BA is a progressive and devastating disease that can
cause cirrhosis and death by 2 years of age.14 This
outcome can be prevented by early intervention
via palliative Kasai hepatoportoenterostomy, which
is essential for re-establishing biliary drainage.
If biliary drainage cannot be re-established, liver
transplantation is necessary. Indeed, BA is the
most common indication for liver transplantation
in children, contributing to 75% of transplantations
in children before 2 years of age.12 It is therefore
imperative to diagnose BA early, preferably during
the prenatal period. Nevertheless, prenatal diagnosis
of BA is challenging because ultrasound cannot
directly examine the patency of fetal bile ducts. When NVFGB is associated with a hepatic hilar cyst
or heterotaxy, it is highly suggestive of BA.15 Non-visualisation
of the fetal gallbladder with a hepatic
hilar cyst is an indicator of cystic BA, a rare subtype
representing 5% to 10% of BA cases16; therefore, this
prenatal combination is uncommon. Heterotaxy
is another rare condition with a prevalence of 1 in
10 000 live births,17 and concurrent BA is present in
only 10.4% of left atrial isomerism cases18; therefore,
this prenatal combination is even less common.
Consequently, NVFGB may be the only prenatal sign
indicating the possibility of BA. However, in cases
of isolated NVFGB, it is difficult to differentiate
between BA and gallbladder agenesis. The discovery
of the association between low AFGGT levels and
fetal BA has led to interest regarding the role of
AFGGT in the management of NVFGB.
Validation and analytical performance
To our knowledge, this study is the first to validate
the International Federation of Clinical Chemistry
and Laboratory Medicine–standardised GGCNA
enzymatic colorimetric assay on the Cobas c502 analyser, a common locally available plasma and serum
analyser, for use with AF. We have demonstrated that
accurate and precise measurements of GGT can be
achieved with AF samples, enabling adoption in
clinical settings. We have also established that the
analytical measurement range is 10 to 1200 U/L.
This is particularly important for an AFGGT assay
because AFGGT levels in euploid pregnancies can
vary across multiple orders of magnitude, whereas
plasma GGT levels in healthy individuals usually
remain below 100 U/L. This verification of the lower
limit of quantification and linearity range improves
confidence in our measurements. Furthermore, we
have excluded potential interference, particularly
from haemoglobin, because AF samples may
sometimes contain maternal blood. We were initially
concerned about GGT stability because some
samples had been stored for several years; however,
consistent with the World Health Organization
report that GGT is stable for years in frozen serum
and plasma samples,19 we found that AF stored
frozen in plain bottles without additives at -20℃ or
-80℃ remained stable for at least 6 months (online supplementary Appendix 1). This finding indicates
that supernatants can be stored and subsequently
retrieved for GGT assays, an important consideration
if amniocentesis is performed in the early second
trimester but an indication for AFGGT testing is
identified during a mid-trimester morphology scan.
Gestational age–specific reference range
We have established a reference range for AFGGT levels at 16+0 to 22+6 weeks of gestation using a large local reference population of 518 samples (all
Asian, 97% Chinese); this reference population is the
largest compared with similar previous publications.
The presence of an adequate sample size for each
week of gestation allowed us to establish a reference
range for each gestational age, thus overcoming the
aforementioned limitations regarding clinical use of
the two previous reference ranges.6 7 With respect
to the two previous reference ranges, the 5th, 50th,
and 95th percentiles in our study are similar to
those reported by Bardin et al7 but higher at most
gestational ages than those reported by Burc et al.6
The larger sample size in our study permitted the
calculation of the 2.5th and 97.5th percentiles,
such that a 95% central reference range could be
established; this allows greater flexibility in selecting
cut-off values for clinical application.
It has been reported that AFGGT levels are
increased in oesophageal atresia and duodenal
atresia, whereas they are decreased in anal atresia
without fistula.20 21 Although duodenal atresia
can easily be diagnosed prenatally by detection of
the double bubble sign, this sign usually appears
after 24 weeks of gestation.22 Prenatal diagnosis
of oesophageal atresia relies on the indirect sign of non-visualisation of the stomach bubble and polyhydramnios; the sensitivities of these ultrasound
findings range from 8.9% to 42%.20 Additionally,
prenatal detection of anal atresia without fistula
depends on the absence of the perianal muscular
complex, but the anal sphincter does not fully mature
until after 28 weeks of gestation.23 Further research
regarding the use of AFGGT for early detection of
these congenital gastrointestinal tract obstructions
is valuable, and the availability of a local gestational
age–specific reference range is crucial for supporting
such research.
Performance evaluation
In the present study, the NPV and PPV of AFGGT
level <2.5th percentile for identifying fetal BA in
NVFGB were 100% and 25%, respectively (Table 3).
Bardin et al9 assessed the efficacy of low AFGGT
levels in predicting BA among cases of NVFGB
between 17 and 22 weeks of gestation. Of the 26 cases
with AFGGT level ≥5th percentile, none had BA; of
the four cases with AFGGT level <5th percentile,
three had BA. The corresponding NPV and PPV were
100% and 75%, respectively. The PPV in their study
may have been higher because amniocentesis was
performed before 22 weeks of gestation in all cases.9
In our cohort, after exclusion of the two cases in
which amniocentesis was performed after 22 weeks
of gestation, the PPV only marginally improved to
33.3%. Our figures are more consistent with those of
Dreux et al,8 who analysed the efficacy of AFEs for
predicting BA in NVFGB before and after 22 weeks
of gestation. In that study, abnormal AFE was defined
as GGT and/or intestinal alkaline phosphatase level
<0.5 multiples of the median.8 Before 22 weeks of
gestation, there were three cases of BA among seven
cases with abnormal AFE and no cases of BA among
16 cases with normal AFE. The corresponding NPV
and PPV were 100% and 43%, respectively. However,
after 22 weeks of gestation, there was only one case
of BA among six cases with abnormal AFE and four
cases of BA among 56 cases with normal AFE. The
corresponding NPV and PPV were 93% and 17%,
respectively (Table 3). These findings confirmed the
expected decrease in AFE efficacy for predicting BA
after 22 weeks of gestation. By that gestational age,
the passage of GGT from the intestine into the AF is
impeded by mature anal sphincter muscles in normal
fetuses; thus, the AFGGT level is very low after 22
weeks of gestation, and it is difficult to distinguish
between a low level due to BA and a low level related
to normal development.5 6 7
In our cohort, there were three fetuses without
BA who had AFGGT level ≤2.5th percentile; one of
these fetuses had an extremely low AFGGT level
(Case 4) [Table 2]. In addition to its association with
fetal BA, low AFGGT is linked to chromosomal
abnormalities, cystic fibrosis, anal atresia without
fistula, and polyhydramnios. However, none of the three fetuses had any of these conditions. Although
one fetus (Case 2) [Table 2] had a small choledochal
cyst which might have impeded biliary drainage and
caused a mild decrease in AFGGT, we could not find
a potential explanation for the low AFGGT levels in
the other two fetuses.
Limitations
Limitations of our study include its retrospective
nature and small cohort size. The incidence of
NVFGB is low (0.1%).1 In the largest systematic
review concerning the outcomes of NVFGB,
encompassing seven studies, the total number of
cases was 280; among 170 cases of isolated NVFGB,
only six (3.5%) had BA.2 In Hong Kong, the fetal
gallbladder is not routinely assessed in low-risk
routine anomaly scans, in accordance with the
International Society of Ultrasound in Obstetrics
and Gynecology guideline.11 24 Among the 32 cases
of NVFGB in our cohort, one (3.1%) had BA; this
incidence is comparable to the findings in the
aforementioned review. However, only 18 cases had
an AF sample available for AFGGT testing; after the
exclusion of cases with abnormalities that might
affect the AFGGT level, we included nine cases in
the analysis. Because there was only one case of
BA in our cohort and 11 more were described in
the literature (Table 3), clinical application of these
research findings requires caution, as well as careful
pre- and post-test counselling.
In addition to the one case of BA in this cohort,
two additional cases of BA were not included in this
study because prenatal ultrasound scans did not
indicate NVFGB. The AFGGT levels in all three
cases were <30 U/L and <2.5th percentile (27, 28, and
29 U/L at 20+3, 21+5, and 21+6 weeks, respectively),
whereas the AFGGT levels in all samples used to
establish our reference range were >30 U/L. Thus,
an AFGGT level <30 U/L may be a useful absolute
cut-off for the prediction of BA. Notably, all three
cases of extrahepatic bile duct obstruction reported
by Muller et al5 also had an AFGGT level <30 U/L
(20 U/L for all three cases [<1st percentile]). Further
research with a larger cohort is required to confirm
the efficacy of using an AFGGT level <30 U/L as the
absolute cut-off for predicting BA in NVFGB.
Conclusion
Based on the present findings and published
literature, we conclude that AFGGT testing is useful
for the exclusion of fetal BA in pregnancies with
NVFGB. With a consistent NPV of 100% across all
published series, AFGGT level ≥2.5th percentile
can provide reassurance for parents that the fetus
is unlikely to have BA. However, considering its
PPV of 33.3% to 75% before 22 weeks of gestation
and 17% to 43% after 22 weeks of gestation, AFGGT level <2.5th percentile cannot be considered
diagnostic for BA. Instead, it serves as a warning
sign, indicating the need for prompt postnatal
investigation of possible BA. Because NVFGB is
also associated with chromosomal abnormalities,
amniocentesis is recommended; the advantages of
detecting underlying chromosomal abnormalities
by CMA and excluding BA through AFGGT testing
likely outweigh the 0.3% risk of procedure-related
miscarriage.25 Follow-up prenatal ultrasound scans
to visualise the fetal gallbladder should be arranged.
Paediatricians should also be alerted for prompt
postnatal assessment to facilitate early detection
of BA. Timely performance of the Kasai operation
can reduce the need for liver transplantation in
childhood and improve the rate of overall survival
into adulthood to 90%.26 27
Author contributions
Concept or design: YH Ting, DS Sahota, FCK Wong, TYT Cheung.
Acquisition of data: TYT Cheung, SR Subramaniam, FCK Wong, MHM Chan, YH Ting, NKL Wong, SL Lau, X Zhu, WT Lui, EKW Chan, YKY Kwok, KW Choy, TY Leung.
Analysis or interpretation of data: TYT Cheung, DS Sahota, FCK Wong, YH Ting, NKL Wong.
Drafting of the manuscript: YH Ting, TYT Cheung, DS Sahota, NKL Wong, FCK Wong, SR Subramaniam.
Critical revision of the manuscript for important intellectual content: DS Sahota, YH Ting, TYT Cheung, FCK Wong, NKL Wong.
All authors had full access to the data, contributed to the study, approved the final version for publication, and take responsibility for its accuracy and integrity.
Conflicts of interest
All authors have disclosed no conflicts of interest.
Funding/support
This research received no specific grant from any funding agency in the public, commercial, or not-for-profit sectors.
Ethics approval
This research was approved by the Joint Chinese University of
Hong Kong—New Territories East Cluster Clinical Research
Ethics Committee, Hong Kong (Ref No.: CRE 2020.060).
Informed consent for amniocentesis in the current study and
storage and use of excess amniotic fluid in future research was
obtained from the patients at the time of amniocentesis.
Supplementary material
The supplementary material was provided by the authors and
some information may not have been peer reviewed. Accepted
supplementary material will be published as submitted by the
authors, without any editing or formatting. Any opinions
or recommendations discussed are solely those of the
authors and are not endorsed by the Hong Kong Academy
of Medicine and the Hong Kong Medical Association.
The Hong Kong Academy of Medicine and the Hong Kong Medical Association disclaim all liability and responsibility arising from any reliance placed on the content.
References
1. Blazer S, Zimmer EZ, Bronshtein M. Nonvisualization of
the fetal gallbladder in early pregnancy: comparison with
clinical outcome. Radiology 2002;224:379-82. Crossref
2. Di Pasquo E, Kuleva M, Rousseau A, et al. Outcome of
non-visualization of fetal gallbladder on second-trimester
ultrasound: cohort study and systematic review of
literature. Ultrasound Obstet Gynecol 2019;54:582-8. Crossref
3. Ting YH, So PL, Cheung KW, Lo TK, Ma TW, Leung TY.
Non-visualisation of fetal gallbladder in a Chinese cohort.
Hong Kong Med J 2022;28:116-23. Crossref
4. Parolini F, Boroni G, Milianti S, et al. Biliary atresia: 20-40-year follow-up with native liver in an Italian centre. J
Pediatr Surg 2019;54:1440-4. Crossref
5. Muller F, Gauthier F, Laurent J, Schmitt M, Boué J.
Amniotic fluid GGT and congenital extrahepatic biliary
damage. Lancet 1991;337:232-3. Crossref
6. Burc L, Guibourdenche J, Luton D, et al. Establishment
of reference values of five amniotic fluid enzymes.
Analytical performances of the Hitachi 911. Application to
complicated pregnancies. Clin Biochem 2001;34:317-22. Crossref
7. Bardin R, Danon D, Tor R, Mashiach R, Vardimon D,
Meizner I. Reference values for gamma-glutamyl-transferase
in amniotic fluid in normal pregnancies. Prenat
Diagn 2009;29:703-6. Crossref
8. Dreux S, Boughanim M, Lepinard C, et al. Relationship
of non-visualization of the fetal gallbladder and amniotic
fluid digestive enzymes analysis to outcome. Prenat Diagn
2012;32:423-6. Crossref
9. Bardin R, Ashwal E, Davidov B, Danon D, Shohat M,
Meizner I. Nonvisualization of the fetal gallbladder: can
levels of gamma-glutamyl transpeptidase in amniotic fluid
predict fetal prognosis? Fetal Diagn Ther 2016;39:50-5. Crossref
10. Stewart SH, Connors GJ, Hutson A. Ethnicity and gamma-glutamyltransferase
in men and women with alcohol use disorders. Alcohol Alcohol 2007;42:24-7. Crossref
11. Salomon LJ, Alfirevic Z, Berghella V, et al. Practice
guidelines for performance of the routine mid-trimester
fetal ultrasound scan. Ultrasound Obstet Gynecol
2011;37:116-26. Crossref
12. Hartley JL, Davenport M, Kelly DA. Biliary atresia. Lancet 2009;374:1704-13. Crossref
13. Hsiao CH, Chang MH, Chen HL, et al. Universal screening
for biliary atresia using an infant stool color card in Taiwan.
Hepatology 2008;47:1233-40. Crossref
14. Zhan J, Chen Y, Wong KK. How to evaluate diagnosis
and management of biliary atresia in the era of liver
transplantation in China. World J Paediatr Surg
2018;1:e000002. Crossref
15. Chalouhi GE, Muller F, Dreux S, Ville Y, Chardot C.
Prenatal non-visualization of fetal gallbladder: beware of
biliary atresia! Ultrasound Obstet Gynecol 2011;38:237-8. Crossref
16. Rahamtalla D, Al Rawahi Y, Jawa ZM, Wali Y. Cystic biliary
atresia in a neonate with antenatally detected abdominal
cyst. BMJ Case Rep 2022;15:e246081. Crossref
17. Lin AE, Ticho BS, Houde K, Westgate MN, Holmes LB.
Heterotaxy: associated conditions and hospital-based
prevalence in newborns. Genet Med 2000;2:157-72. Crossref
18. Gottschalk I, Stressig R, Ritgen J, et al. Extracardiac
anomalies in prenatally diagnosed heterotaxy syndrome.
Ultrasound Obstet Gynecol 2016;47:443-9. Crossref
19. Ehret W. Use of Anticoagulants in Diagnostic Laboratory
Investigations. Geneva: World Health Organization; 1999.
20. Czerkiewicz I, Dreux S, Beckmezian A, et al. Biochemical
amniotic fluid pattern for prenatal diagnosis of esophageal
atresia. Pediatr Res 2011;70:199-202. Crossref
21. Muller C, Czerkiewicz I, Guimiot F, et al. Specific
biochemical amniotic fluid pattern of fetal isolated
esophageal atresia. Pediatr Res 2013;74:601-5. Crossref
22. The Fetal Medicine Foundation. Duodenal atresia.
Available from: https://fetalmedicine.org/education/fetal-abnormalities/gastrointestinal-tract/duodenal-atresia. Accessed 19 Jan 2023.
23. Ochoa JH, Chiesa M, Vildoza RP, Wong AE, Sepulveda W.
Evaluation of the perianal muscular complex in the prenatal diagnosis of anorectal atresia in a high-risk population.
Ultrasound Obstet Gynecol 2012;39:521-7. Crossref
24. Chen M, Leung TY, Sahota DS, et al. Ultrasound screening
for fetal structural abnormalities performed by trained
midwives in the second trimester in a low-risk population—an appraisal. Acta Obstet Gynecol Scand 2009;88:713-9. Crossref
25. Salomon LJ, Sotiriadis A, Wulff CB, Odibo A, Akolekar R.
Risk of miscarriage following amniocentesis or chorionic
villus sampling: systematic review of literature and updated
meta-analysis. Ultrasound Obstet Gynecol 2019;54:442-51. Crossref
26. Serinet MO, Wildhaber BE, Broué P, et al. Impact of age
at Kasai operation on its results in late childhood and
adolescence: a rational basis for biliary atresia screening.
Pediatrics 2009;123:1280-6. Crossref
27. Davenport M. Biliary atresia: clinical aspects. Semin Pediatr Surg 2012;21:175-84. Crossref