Glycaemic control and microvascular complications among paediatric type 2 diabetes mellitus patients in Hong Kong at 2 years after diagnosis

Hong Kong Med J 2024 Aug;30(4):291–9 | Epub 16 Aug 2024
© Hong Kong Academy of Medicine. CC BY-NC-ND 4.0
 
ORIGINAL ARTICLE
Glycaemic control and microvascular complications among paediatric type 2 diabetes mellitus patients in Hong Kong at 2 years after diagnosis
WI Yam, MB, ChB, FHKAM (Paediatrics)1; Shirley MY Wong, MB, BS, FHKAM (Paediatrics)1; PT Cheung, MB, BS, FHKAM (Paediatrics)2; Elaine YW Kwan, MB, BS, FHKAM (Paediatrics)3; YY Lam, MB, BS, FHKAM (Paediatrics)4; LM Wong, MB, BS, FHKAM (Paediatrics)5; KL Ng, MB, BS, FHKAM (Paediatrics)6; Sammy WC Wong, MB, ChB, FHKAM (Paediatrics)7; CY Lee, MB, BS, FHKAM (Paediatrics)8; MK Tay, LMCHK, FHKAM (Paediatrics)9; KT Chan, MB, BS, FHKAM (Paediatrics)3; Antony CC Fu, MB, ChB, FHKAM (Paediatrics)10; Joanna YL Tung, MB, BS, FHKAM (Paediatrics)11; Gloria SW Pang, MB, BS, FHKAM (Paediatrics)11; HC Yau, MB, ChB, FHKAM (Paediatrics)12; Queenie WS See, MB, BS, FHKAM (Paediatrics)2; Priscilla WC Lo, MB, BS, FHKAM (Paediatrics)6; Sharon WY To, MB, BS, FHKAM (Paediatrics)10; HW Yuen, MB, ChB, FHKAM (Paediatrics)4; Jacky YK Chung, MB, BS, FHKAM (Paediatrics)8; Eunice WY Wong, MB, BS, FHKAM (Paediatrics)5; Sarah WY Poon, MB, BS, FHKAM (Paediatrics)11; Charlotte HY Lam, MB, BS, FHKAM (Paediatrics)7; Suki SY Chan, LMCHK, MRCPCH12; Janez HC Tsui, MB, BS, MRCPCH3; Cindy SY Chan, MB, BS, MRCPCH9; Betty WM But, MB, BS, FHKAM (Paediatrics)1
1 Department of Paediatrics, Queen Elizabeth Hospital, Hong Kong SAR, China
2 Department of Paediatrics and Adolescent Medicine, Queen Mary Hospital, Li Ka Shing Faculty of Medicine, The University of Hong Kong, Hong Kong SAR, China
3 Department of Paediatrics and Adolescent Medicine, Pamela Youde Nethersole Eastern Hospital, Hong Kong SAR, China
4 Department of Paediatrics and Adolescent Medicine, Kwong Wah Hospital, Hong Kong SAR, China
5 Department of Paediatrics and Adolescent Medicine, Tuen Mun Hospital, Hong Kong SAR, China
6 Department of Paediatrics and Adolescent Medicine, United Christian Hospital, Hong Kong SAR, China
7 Department of Paediatrics and Adolescent Medicine, Alice Ho Miu Ling Nethersole Hospital, Hong Kong SAR, China
8 Department of Paediatrics, Caritas Medical Centre, Hong Kong SAR, China
9 Department of Paediatrics, Tseung Kwan O Hospital, Hong Kong SAR, China
10 Department of Paediatrics and Adolescent Medicine, Princess Margaret Hospital, Hong Kong SAR, China
11 Department of Paediatrics, Hong Kong Children’s Hospital, Hong Kong SAR, China
12 Department of Paediatrics, Prince of Wales Hospital, Hong Kong SAR, China
 
Corresponding author: Dr WI Yam (ywi817@ha.org.hk)
 
 Full paper in PDF
 
Abstract
Introduction: Type 2 diabetes mellitus (T2DM) is becoming increasingly common among children and adolescents worldwide, including those in Hong Kong. This study analysed the characteristics and prevalence of microvascular complications among paediatric T2DM patients in Hong Kong at diagnosis and 2 years after diagnosis.
 
Methods: All patients aged <18 years who had been diagnosed with DM at public hospitals in Hong Kong were recruited into the Hong Kong Childhood Diabetes Registry. Data collected at diagnosis and 2 years after diagnosis were retrospectively retrieved from the Registry for patients diagnosed from 2014 to 2018.
 
Results: Median haemoglobin A1c (HbA1c) levels were 7.5% (n=203) at diagnosis and 6.5% (n=135) 2 years after diagnosis; 59.3% of patients achieved optimal glycaemic control (HbA1c level <7%) at 2 years. A higher HbA1c level at diagnosis was associated with worse glycaemic control at 2 years (correlation coefficient=0.39; P<0.001). The presence of dyslipidaemia (adjusted odds ratio [aOR]=3.19; P=0.033) and fatty liver (aOR=2.50; P=0.021) at 2 years were associated with suboptimal glycaemic control. Diabetic neuropathy and retinopathy were rare in our cohort, but 18.6% of patients developed microalbuminuria (MA) within 2 years after diagnosis. Patients with MA had a higher HbA1c level at 2 years (median: 7.2% vs 6.4%; P=0.037). Hypertension was a risk factor for MA at 2 years, independent of glycaemic control (aOR=4.61; P=0.008).
 
Conclusion: These results highlight the importance of early diagnosis and holistic management (including co-morbidity management) for paediatric T2DM patients.
 
 
New knowledge added by this study
  • A total of 59.3% of paediatric type 2 diabetes mellitus patients in Hong Kong had achieved satisfactory glycaemic control at 2 years after diagnosis.
  • Factors associated with suboptimal glycaemic control at 2 years after diagnosis were higher haemoglobin A1c level at diagnosis, fatty liver at 2 years, and dyslipidaemia at 2 years.
  • Overall, 18.6% of patients had microalbuminuria at 2 years and exhibited hypertension as a risk factor, independent of glycaemic control.
Implications for clinical practice or policy
  • Early diagnosis of diabetes mellitus is important because initial disease severity predicts the risk of suboptimal glycaemic control at 2 years.
  • Management of co-morbidities, including fatty liver, dyslipidaemia, and hypertension, is important for the maintenance of glycaemic control and prevention of microalbuminuria.
 
 
Introduction
Type 2 diabetes mellitus (T2DM) in children and adolescents (hereinafter, youth) is becoming increasingly common worldwide.1 2 A recent meta-analysis estimated that approximately 41 600 new cases of T2DM were identified among youth in 2021.3 Type 2 DM in youth exhibits relatively rapid clinical progression with a sharp decline in beta-cell function and high risk of complications.4 In a study recently published by the TODAY (Type 2 Diabetes in Adolescents and Youth) Study Group, which analysed 500 young adults with youth-onset T2DM, 60.1% of patients developed at least one microvascular complication (diabetic kidney, nerve, or retinal disease) and 28.4% of patients developed at least two complications.5 In addition to hyperglycaemia, the presence of co-morbidities (eg, hypertension and dyslipidaemia) was associated with an increased risk of complications.5
 
A similar increase in the incidence of T2DM has been observed in Hong Kong. We previously reported that the crude incidence rate increased from 1.27 per 100 000 person-years in 1997-2007 to 3.42 per 100 000 person-years in 2008-2017.6 However, there have been limited data regarding the outcomes of paediatric T2DM patients in Hong Kong. In this study, we reviewed the glycaemic control findings and microvascular complication rates among recently diagnosed paediatric T2DM patients in Hong Kong, with a focus on outcomes at 2 years after diagnosis; we sought to identify factors associated with poor glycaemic control and the development of microalbuminuria (MA).
 
Methods
Setting
Data analysed in this study were retrieved from the Hong Kong Childhood Diabetes Registry, a database established in 2016. The Registry was approved by the Research Ethics Committee of the Hospital Authority of Hong Kong, which includes 11 public hospitals. Investigators retrieved information from medical records and entered relevant data into the Registry. Standardised data entry forms for recording baseline clinical characteristics and annual entry forms were provided for investigators to enter data into the Registry at diagnosis and annually thereafter. Data were cross-checked by at least two investigators.
 
Inclusion and exclusion criteria
All patients aged <18 years who had been diagnosed with DM at public hospitals in Hong Kong were recruited. All recruited patients met the diagnostic criteria for DM according to the International Society for Paediatric and Adolescent Diabetes Clinical Practice Consensus Guidelines: patients were symptomatic and had either fasting blood glucose level ≥7 mmol/L, 2-hour blood glucose level ≥11.1 mmol/L during an oral glucose tolerance test, random blood glucose level ≥11.1 mmol/L, or haemoglobin A1c (HbA1c) level ≥6.5%.4 Asymptomatic patients underwent repeat testing with a different test, as suggested in the Guidelines.4 The classification of DM was based on the attending clinician’s assessment of clinical symptoms and laboratory findings, including obesity status, family history, autoimmunity, and clinical course. Patients diagnosed with T2DM from 2014 to 2018 were included in the analysis, including those who had an initial diagnosis of type 1 DM that was subsequently revised to T2DM. Patients who refused Registry recruitment and patients whose diagnosis was revised to type 1 DM or maturity-onset DM of the young were not included in the analysis.
 
Data collection and definitions
The following data were retrieved from the Registry: patient age, sex, family history of T2DM (in first- or second-degree relatives), symptoms at presentation, anti-islet cell antibody test results, body mass index (BMI), HbA1c level, presence of co-morbidities (non-alcoholic fatty liver disease, dyslipidaemia, hypertension, and obstructive sleep apnoea), presence of complications (MA, retinopathy, and neuropathy), treatments received, and frequency of blood glucose self-monitoring. Overweight and obesity were defined using age- and sex-specific cut-offs established by the International Obesity Task Force, which predicted BMI values at 18 years (25, 30, and 35 kg/m2) by the respective standard deviations to define overweight, obesity and morbid obesity, respectively; standard deviations of BMI were calculated according to age- and sex-specific reference data provided by the International Obesity Task Force.7 In this study, weight loss was defined as any decrease in BMI z-score, and improvement in HbA1c level was defined as any decrease in HbA1c level. Non-alcoholic fatty liver disease was defined as an elevated alanine transferase level (based on age- and sex-specific reference data) or compatible ultrasound findings. Dyslipidaemia was defined as an elevated low-density lipoprotein level of ≥2.6 mmol/L, a triglyceride level ≥1.7 mmol/L, or the receipt of lipid-lowering agents. Hypertension was defined as an elevated systolic blood pressure ≥95th percentile for age, height, and sex—on at least two occasions—or the receipt of anti-hypertensive medication. Obstructive sleep apnoea was defined as the presence of clinical symptoms indicating sleep-disordered breathing, along with polysomnography findings of obstructive apnoeas/hypopneas. Microalbuminuria was defined as an elevated spot urine albumin-creatinine ratio >2.5 mg/mmol for boys and >3.5 mg/mmol for girls in at least two of three samples within a 6-month period, or as the receipt of any treatment for MA. Retinopathy (eg, non-proliferative and proliferative diabetic retinopathy, as well as macula oedema) was identified by digital fundus photography and confirmed via referral to an ophthalmologist. Neuropathy was clinically identified by the presence of symptoms (numbness and paraesthesia) and through clinical examinations including the 10-g monofilament test, vibration sense assessment, and ankle reflex evaluation. Suboptimal glycaemic control was defined as HbA1c level ≥7%, as suggested by the International Society for Paediatric and Adolescent Diabetes Clinical Practice Consensus Guidelines.4
 
Data analysis
Statistical analyses were performed using SPSS software (Windows version 23; IBM Corp, Armonk [NY], United States). All available data were included in the statistical analysis, and the numbers of available values are listed in the tables. Continuous variables, including age, HbA1c level, and BMI z-score, were tested for normality using the Shapiro–Wilk test. Data with skewed distributions were expressed as medians and interquartile ranges (IQRs), and comparisons were made using the Mann-Whitney U test. Analyses of relationships between two continuous variables were assessed by Spearman rank correlation and expressed using the Spearman correlation coefficient (ρ). Categorical variables were expressed as exact numbers of patients with percentages. Binary logistic regression analysis was used to assess risk factors for suboptimal glycaemic control at 2 years and MA at 2 years. Univariate analyses were performed to determine unadjusted odds ratios and 95% confidence intervals. Multivariate analyses of factors associated with suboptimal glycaemic control at 2 years were performed while including HbA1c level at diagnosis to adjust for initial disease severity. Multivariate analyses of factors associated with MA at 2 years were performed while including HbA1c level at 2 years to eliminate the effect of glycaemic control at 2 years; this approach was intended to independently assess the effects of co-morbidities. Missing data were not included in regression analyses. Statistical tests were two-sided and were performed with a 5% significance threshold (ie, alpha=0.05). The STROBE (Strengthening the Reporting of Observational Studies in Epidemiology) checklist for cohort studies was used when reporting the study findings.
 
Results
Study population
In total, 212 patients diagnosed with T2DM between 2014 and 2018 were recruited into the Registry. Their baseline demographics are summarised in Tables 1 and 2. Of these patients, 71.3% had a family history of T2DM, and 21.7% were symptomatic at diagnosis (Table 1). At 2 years after the diagnosis of DM, 143 patients (67.5%) continued attending follow-up visits. There were no significant differences in baseline characteristics between the groups with and without follow-up at 2 years, except for a higher age at diagnosis in the loss to follow-up group (online supplementary Table).
 

Table 1. Baseline patient demographics
 

Table 2. Glycaemic control, co-morbidities and microvascular complications, and treatment received
 
Glycaemic control
Haemoglobin A1c levels at diagnosis, 1 year after diagnosis, and 2 years after diagnosis were available for 203, 176, and 135 patients, respectively. The median HbA1c levels at diagnosis, 1 year after diagnosis, and 2 years after diagnosis were 7.5% (IQR=6.5%-10.6%), 6.3% (IQR=5.8%-7.4%), and 6.5% (IQR=5.8%-8.0%), respectively; at these times, 65.5%, 29.0%, and 40.7% of patients had suboptimal glycaemic control (ie, HbA1c level ≥7%), respectively [Table 2].
 
Co-morbidities
There was an overall improvement in BMI z-score at 2 years after diagnosis (median BMI z-score decreased from 2.5 at diagnosis to 2.3 at 2 years). Overall, 146 of 191 patients (76.4%) had dyslipidaemia at diagnosis, whereas 62 of 95 patients (65.3%) had dyslipidaemia at 2 years. However, more patients had hypertension at 2 years—the number increased from 45 of 212 patients (21.2%) at diagnosis to 55 of 143 patients (38.5%) at 2 years (Table 2).
 
Microvascular complications
Overall, 21 of 113 (18.6%) patients screened at 2 years after diagnosis developed MA, compared with 9.0% at diagnosis. Two patients (1.8%) developed retinopathy, whereas one patient (0.9%) developed neuropathy, at 2 years after diagnosis (Table 2).
 
Treatments received and monitoring
At diagnosis, 24.1% of patients were not receiving any pharmacological treatment, 58.0% were receiving anti-diabetic drugs, and 18% required insulin. At 2 years, only 12.6% of patients were not receiving any medications. The proportions of patients requiring insulin were similar at diagnosis and 2 years (2.1%). In total, 64.9% of patients did not perform daily blood glucose self-monitoring (Table 2).
 
Factors affecting glycaemic control at 2 years
A higher initial HbA1c level was associated with suboptimal glycaemic level at 2 years (correlation coefficient=0.39, P<0.001; n=130). There were no significant correlations of HbA1c level at 2 years with age at diagnosis (correlation coefficient=0.02, P=0.852; n=135), BMI z-score at diagnosis (correlation coefficient=-0.10, P=0.277; n=133), or BMI z-score at 2 years (correlation coefficient=0.04, P=0.638; n=131). Greater decline in BMI z-score was associated with a lower HbA1c level at 2 years (correlation coefficient=-0.22, P=0.011; n=129). However, there was no correlation between the change in BMI z-score and the change in HbA1c level (correlation coefficient <0.01, P=0.973; n=126).
 
Table 3 shows factors associated with suboptimal glycaemic control at 2 years. The effect of a family history of T2DM was not statistically significant after adjustment for initial HbA1c level (adjusted odds ratio [aOR]=2.29; P=0.075). A similar result was observed regarding the effect of symptomatic disease at diagnosis (aOR=2.01; P=0.174) and weight loss (aOR=0.53; P=0.128). The presence of fatty liver (aOR=2.50; P=0.021) and dyslipidaemia (aOR=3.19; P=0.033) at 2 years were associated with suboptimal glycaemic control at 2 years, even after adjustment for initial HbA1c level.
 

Table 3. Factors associated with suboptimal glycaemic control (haemoglobin A1c level ≥7%) at 2 years
 
Factors associated with the development of microalbuminuria at 2 years
Patients with MA had higher HbA1c levels at 2 years compared with patients who did not exhibit MA (median HbA1c level: 7.2% vs 6.4%; P=0.037) [Table 4]. Dyslipidaemia at 2 years was associated with MA at 2 years in the univariate analysis (unadjusted odds ratio=5.51; P=0.030), but the effect did not remain statistically significant after adjusting for glycaemic control at 2 years (Table 5). The presence of hypertension at 2 years was a risk factor for MA at 2 years, independent of glycaemic control at 2 years (aOR=4.61; P=0.008) [Table 5].
 

Table 4. Univariate analysis of factors associated with the development of microalbuminuria at 2 years
 

Table 5. Multivariate analysis of factors associated with the development of microalbuminuria at 2 years
 
Discussion
Glycaemic control
The results of this study provide insights into the early post-diagnosis clinical course of T2DM among youth in Hong Kong. Nearly 60% of patients (59.3%) in our cohort had optimal glycaemic control with HbA1c level <7% at 2 years after diagnosis. Previous studies regarding glycaemic control among youth with T2DM showed variable results, presumably due to heterogeneity in the study populations, follow-up periods, and glycaemic targets.8 9 10 11 A clinical trial by the TODAY Study Group8 followed up 234 youth with DM, who were put on metformin and lifestyle modifications and with initial HbA1c level <8%, for 3.86 years on average. It showed that 46.6% of youth with DM exhibited loss of glycaemic control, defined by HbA1c level >8%.8 In a study of 301 paediatric T2DM patients with initial HbA1c level ≥7% in the United States, Barr et al9 found that after 1 year, 37% of patients achieved optimal control (HbA1c level ≤6.5%) and 58% achieved durable glycaemic control (HbA1c level ≤8%). However, at 3 years, only 26% of patients achieved HbA1c level ≤6.5%, whereas 59% exhibited HbA1c level ≤8%.9 Candler et al10 followed 100 paediatric T2DM patients in the United Kingdom; the median HbA1c level was 7% after 1 year, and 38.8% of patients exhibited HbA1c level <6.5%. Notably, no data regarding HbA1c levels at diagnosis were provided in the study.10 In a study of 96 patients in Israel, Meyerovitch et al11 found that the median HbA1c level was 7.97% after an average follow-up period of 3.11 years, compared with 7.8% at diagnosis. Additionally, >50% of patients required insulin at the end of the follow-up period.11 Although our cohort appeared to have better glycaemic control compared with the previous studies, our patients might have had lower initial HbA1c levels at diagnosis, considering that most of them were asymptomatic (78.3%). Our study also showed that patients with a higher initial HbA1c level tended to have a persistently high HbA1c level at 2 years. These findings emphasise the importance of early diagnosis and treatment before patients develop clinically significant hyperglycaemia, which makes DM more difficult to control. Most of our patients were overweight or obese (89.8%); many of them also had co-morbidities including hypertension, dyslipidaemia, and fatty liver (Table 2). Previous studies in Hong Kong showed a high risk of metabolic syndrome (OR up to 32.2) in overweight and obese children.12 13 Active screening for metabolic syndrome would enable early diagnosis and treatment of DM and its co-morbidities.
 
Co-morbidities
Factors associated with suboptimal glycaemic control were dyslipidaemia and fatty liver at 2 years after diagnosis. A recent study showed that each 1% increase in HbA1c level was associated with 13% and 20% increases in the risks of abnormal triglyceride and low-density lipoprotein levels, respectively.14 The importance of weight loss has been emphasised in various guidelines, for example, The American Diabetes Association recommends weight loss of at least 5% in adult overweight or obese DM patients.15 However, a specific weight loss target cannot be established in growing children. The study by Candler et al10 regarding youth with T2DM showed that each one-unit increase in BMI z-score was associated with a 34.9% increase in HbA1c level. Although the present study indicated that a greater drop in BMI z-score was associated with lower HbA1c level at 2 years, the association between weight loss and prevention of suboptimal glycaemic control at 2 years was not significant after adjustment for initial HbA1c level.
 
Microvascular complications
Diabetic retinopathy and neuropathy were rare among youth with T2DM. However, the proportion of patients with MA increased from 9.0% at diagnosis to 18.6% at 2 years (Table 2). Previous studies regarding the prevalence of diabetic complications in youth have shown mixed results, probably due to genetic variation and differences in DM duration. High prevalences have been observed in cohorts with long DM durations.16 The MA prevalence has been approximately 20% to 30% in most studies of youth with a short duration of T2DM. In the SEARCH for Diabetes in Youth study, the MA prevalence in youth with T2DM was 22.2%, and the average duration of disease was 1.9 years.17 In an Australian population, Eppens et al18 found that 28% of patients had MA, with a median disease duration of 1.3 years. Candler et al10 showed that the MA prevalence increased from 4.2% to 16.4% within 1 year after diagnosis. Our cohort showed a similar prevalence compared with other cohorts. Nevertheless, the increasing trend is concerning, particularly because MA has been identified as an independent predictor of mortality risk in adults.19 Thus, we conducted further analysis of risk factors for MA, revealing the associations of higher HbA1c level and hypertension at 2 years, consistent with the SEARCH for Diabetes in Youth study.17 The deleterious effects of hypertension on the kidneys explain the additional increase in MA risk, independent of glycaemic control.
 
Strengths and limitations
Strengths of this study included its provision of insights regarding the early outcomes of youth with T2DM in Hong Kong, particularly concerning glycaemic control and associated factors. First, our findings supported the implementation of active screening in overweight and obese individuals to allow early diagnosis of DM, considering the high prevalence of overweight or obesity and the relationship of lower initial HbA1c level with better glycaemic control at 2 years. Second, our findings indicated that the presence of co-morbidities at 2 years, rather than baseline, was associated with suboptimal glycaemic control and MA, demonstrating the reversibility of the risk factors and highlighting the importance of co-morbidity management. Third, our study identified challenges in managing youth with T2DM, including a high loss to follow-up rate (n=69, 23.5%) [online supplementary Table], suboptimal glycaemic control in >40% of patients at 2 years, infrequent blood glucose self-monitoring by the patients, and increasing trends in MA and hypertension.
 
Indeed, the high loss to follow-up rate was a major limitation of our study. Many patients did not return for clinical assessment or were transferred to an adult endocrinology clinic. Although the loss to follow-up group had a higher age at diagnosis (online supplementary Table), this presumably did not have a substantial impact on the results because age was not a significant risk factor for poor glycaemic control or the likelihood of MA onset. Although a high loss to follow-up rate is a common phenomenon in studies of children with T2DM,20 this obstacle hindered the achievement of good glycaemic control and prevention of complications. It also created difficulty in acquiring long-term follow-up data. Another limitation was that our patients were managed by different doctors in different hospitals; there remains no standardised protocol for the management of paediatric T2DM patients in Hong Kong, which may be a confounding factor for multicentre studies such as ours.
 
Conclusion
Approximately 60% of youth with T2DM in Hong Kong achieved HbA1c level <7% at 2 years after diagnosis. A higher HbA1c level at diagnosis was associated with worse glycaemic control at 2 years. The presence of dyslipidaemia and fatty liver at 2 years were factors associated with suboptimal glycaemic control. Overall, 18.6% of patients developed MA at 2 years; other microvascular complications were rare. These results highlight the importance of early diagnosis and holistic management, including co-morbidity management. The high loss to follow-up rate, high proportion of patients with suboptimal glycaemic control, and increasing number of patients with MA and hypertension are ongoing challenges in the management of youth with DM. The establishment of a standardised protocol may improve outcomes in our patient population. Future research could include studies regarding the effects of insulin resistance and beta-cell function on metabolic outcomes in youth with DM.
 
Author contributions
Concept or design: All authors.
Acquisition of data: All authors.
Analysis or interpretation of data: WI Yam, SMY Wong.
Drafting of the manuscript: WI Yam.
Critical revision of the manuscript for important intellectual content: All authors.
 
All authors had full access to the data, contributed to the study, approved the final version for publication, and take responsibility for its accuracy and integrity.
 
Conflicts of interest
All authors have disclosed no conflicts of interest.
 
Funding/support
This research received no specific grant from any funding agency in the public, commercial, or not-for-profit sectors.
 
Ethics approval
The research was conducted as a part of the Hong Kong Childhood Diabetes Registry, which was approved by the Kowloon Central / Kowloon East Cluster Research Ethics Committee of Hospital Authority, Hong Kong (Ref No.: KC/KE-16-0087/ER-3). Written informed consent was obtained from parents for patients aged <16 years and from both parents and patients for patients aged between ≥16 and <18 years.
 
Supplementary material
The supplementary material was provided by the authors and some information may not have been peer reviewed. Accepted supplementary material will be published as submitted by the authors, without any editing or formatting. Any opinions or recommendations discussed are solely those of the author(s) and are not endorsed by the Hong Kong Academy of Medicine and the Hong Kong Medical Association. The Hong Kong Academy of Medicine and the Hong Kong Medical Association disclaim all liability and responsibility arising from any reliance placed on the content.
 
References
1. Lawrence JM, Divers J, Isom S, et al. Trends in prevalence of type 1 and type 2 diabetes in children and adolescents in the US, 2001-2017. JAMA 2021;326:717-27. Crossref
2. Haynes A, Kalic R, Cooper M, Hewitt JK, Davis EA. Increasing incidence of type 2 diabetes in indigenous and non-indigenous children in Western Australia, 1990-2012. Med J Aust 2016;204:303. Crossref
3. Wu H, Patterson CC, Zhang X, et al. Worldwide estimates of incidence of type 2 diabetes in children and adolescents in 2021. Diabetes Res Clin Pract 2022;185:109785. Crossref
4. Shah AS, Zeitler PS, Wong J, et al. ISPAD Clinical Practice Consensus Guidelines 2022: type 2 diabetes in children and adolescents. Pediatr Diabetes 2022;23:872-902. Crossref
5. TODAY Study Group; Bjornstad P, Drews KL, et al. Long-term complications in youth-onset type 2 diabetes. N Engl J Med 2021;385:416-26. Crossref
6. Tung JY, Kwan EY, But BW, et al. Incidence and clinical characteristics of pediatric-onset type 2 diabetes in Hong Kong: the Hong Kong Childhood Diabetes Registry 2008 to 2017. Pediatr Diabetes 2022;23:556-61. Crossref
7. Cole TJ, Lobstein T. Extended international (IOTF) body mass index cut-offs for thinness, overweight and obesity. Pediatr Obes 2012;7:284-94. Crossref
8. TODAY Study Group; Zeitler P, Hirst K, et al. A clinical trial to maintain glycemic control in youth with type 2 diabetes. N Engl J Med 2012;366:2247-56. Crossref
9. Barr MM, Aslibekyan S, Ashraf AP. Glycemic control and lipid outcomes in children and adolescents with type 2 diabetes. PLoS One 2019;14:e0219144. Crossref
10. Candler TP, Mahmoud O, Lynn RM, Majbar AA, Barrett TG, Shield JP. Treatment adherence and BMI reduction are key predictors of HbA1c 1 year after diagnosis of childhood type 2 diabetes in the United Kingdom. Paediatr Diabetes 2018;19:1393-9. Crossref
11. Meyerovitch J, Zlotnik M, Yackobovitch-Gavan M, Phillip M, Shalitin S. Real-life glycemic control in children with type 2 diabetes: a population-based study. J Paediatr 2017;188:173-80.e1. Crossref
12. Ozaki R, Qiao Q, Wong GW, et al. Overweight, family history of diabetes and attending schools of lower academic grading are independent predictors for metabolic syndrome in Hong Kong Chinese adolescents. Arch Dis Child 2007;92:224-8. Crossref
13. Kong AP, Ko GT, Ozaki R, Wong GW, Tong PC, Chan JC. Metabolic syndrome by the new IDF criteria in Hong Kong Chinese adolescents and its prediction by using body mass index. Acta Paediatr 2008;97:1738-42. Crossref
14. Brady RP, Shah AS, Jensen ET, et al. Glycemic control is associated with dyslipidemia over time in youth with type 2 diabetes: the SEARCH for Diabetes in Youth study. Pediatr Diabetes 2021;22:951-9. Crossref
15. American Diabetes Association Professional Practice Committee. 8. Obesity and weight management for the prevention and treatment of type 2 diabetes: standards of medical care in diabetes—2022. Diabetes Care 2022;45(Supp 1):S113-24. Crossref
16. Amutha A, Mohan V. Diabetes complications in childhood and adolescent onset type 2 diabetes—a review. J Diabetes Complications 2016;30:951-7. Crossref
17. Maahs DM, Snively BM, Bell RA, et al. Higher prevalence of elevated albumin excretion in youth with type 2 than type 1 diabetes: the SEARCH for Diabetes in Youth study. Diabetes Care 2007;30:2593-8. Crossref
18. Eppens MC, Craig ME, Cusumano J, et al. Prevalence of diabetes complications in adolescents with type 2 compared with type 1 diabetes. Diabetes Care 2006;29:1300-6. Crossref
19. Chronic Kidney Disease Prognosis Consortium; Matsushita K, van der Velde M, et al. Association of estimated glomerular filtration rate and albuminuria with all-cause and cardiovascular mortality in general population cohorts: a collaborative meta-analysis. The Lancet 2010;375:2073-81. Crossref
20. Shoemaker A, Cheng P, Gal RL, et al. Predictors of loss to follow-up among children with type 2 diabetes. Horm Res Paediatr 2017;87:377-84. Crossref

Changes in the epidemiology and clinical manifestations of human immunodeficiency virus–associated tuberculosis in Hong Kong

Hong Kong Med J 2024 Aug;30(4):281–90 | Epub 16 Jul 2024
© Hong Kong Academy of Medicine. CC BY-NC-ND 4.0
 
ORIGINAL ARTICLE
Changes in the epidemiology and clinical manifestations of human immunodeficiency virus–associated tuberculosis in Hong Kong
Alan CK Chan, MRCP, FHKAM (Medicine)1; SS Huang, FHKCP, FHKAM (Medicine)1; KH Wong, FFPH, FHKAM (Medicine)2; CC Leung, FFPH, FHKAM (Medicine)3; MP Lee, MB, BS, FHKAM (Medicine)4; TY Tsang, MSc (LON), FRCP (Lond)5; WS Law, FHKCP, FHKAM (Medicine)1; LB Tai, MRCP, FHKAM (Medicine)1
1 Tuberculosis and Chest Service, Department of Health, Hong Kong SAR, China
2 Special Preventive Programme, Department of Health, Hong Kong SAR, China
3 Hong Kong Tuberculosis, Chest and Heart Diseases Association, Hong Kong SAR, China
4 Department of Medicine, Queen Elizabeth Hospital, Hong Kong SAR, China
5 Department of Medicine and Geriatrics, Princess Margaret Hospital, Hong Kong SAR, China
 
Corresponding author: Dr Alan CK Chan (chikuen_chan@dh.gov.hk)
 
 Full paper in PDF
 
Abstract
Introduction: Human immunodeficiency virus (HIV)–associated tuberculosis (TB) remains an important health challenge worldwide. Although TB prevalence has decreased in the general population, there is limited information regarding temporal trends in the incidence of HIV-associated TB in Hong Kong. There are also insufficient data regarding changes in clinical manifestation patterns among HIV-associated TB patients over time. This study aimed to describe temporal trends in the epidemiology and clinical manifestations of HIV-associated TB in Hong Kong.
 
Methods: We retrospectively reviewed data regarding HIV-associated TB patients that were reported to the TB-HIV Registry of the Department of Health during the period 2007 to 2020. Trends of TB as a primary acquired immunodeficiency syndrome (AIDS)–defining illness, as well as changes in demographic features and clinical manifestations of HIV-associated TB during this period were examined using Cochran–Armitage trend test.
 
Results: A decreasing trend was observed in the proportion of all reported cases of AIDS in which TB was a primary AIDS-defining illness during the study period. The proportions of female patients and patients with extrapulmonary involvement significantly increased, whereas the proportions of ever-smokers and patients with sputum smear positivity significantly decreased during the same period. A decreasing trend was observed in the proportion of patients with pulmonary TB in which the lower zone was the predominant site of lung parenchymal lesions. Among patients with a diagnosis of HIV infection before TB, an increasing trend was observed in the proportion of patients receiving antiretroviral therapy.
 
Conclusion: Important temporal changes were observed in the epidemiology and clinical manifestations of HIV-associated TB. These results highlight the need for continued surveillance regarding the patterns of demographic features and clinical manifestations to inform policymakers when planning control strategies for HIV-associated TB.
 
 
New knowledge added by this study
  • Tuberculosis (TB) has assumed a less important role as a primary acquired immunodeficiency syndrome–defining illness in Hong Kong over the 14 years of the study period.
  • Significant temporal changes were observed in the clinical manifestations of human immunodeficiency virus (HIV)–associated TB.
Implications for clinical practice or policy
  • Knowledge of the changing patterns of demographic features and clinical manifestations will help policymakers plan control strategies for HIV-associated TB.
  • Recognition of changes in clinical manifestations will also help optimise TB and HIV management and improve treatment outcome.
 
 
Introduction
The advent of highly active antiretroviral therapy (HAART) in 1996 led to a substantial decrease in the incidence of opportunistic infections among people living with human immunodeficiency virus (HIV) in many regions.1 2 3 Nonetheless, HIV-associated tuberculosis (TB) remains an important global health challenge. The World Health Organization estimated that 10.6 million people were living with TB worldwide in 2021, 6.7% of whom were living with HIV.4 In the same year, 1.6 million people died of TB, including 187 000 people who were living with HIV.4 The burden of HIV-associated TB considerably varies across countries and regions.5 6 The prevalence of HIV-associated TB in individual areas reportedly changes over time.7 8 9 Awareness of changes in the epidemiology and clinical manifestations of patients with HIV-associated TB can help policymakers formulate timely relevant prevention and control measures. It can also help improve treatment outcomes for patients with HIV-associated TB.
 
In Hong Kong, the TB case notification rate has exhibited an overall decreasing trend over the past few decades.10 In 2021, the provisional number of TB cases reported to the Department of Health was 3741.11 The corresponding TB notification rate was 50.5 per 100 000 inhabitants, a substantial decrease from 84.1 per 100 000 inhabitants in 2006.11 The overall prevalence of HIV infection in the general adult population has remained low (<0.1%).12 The epidemiology and clinical manifestations of HIV-associated TB during the period 1996 to 2006 in Hong Kong have been reported.13 Notably, the report showed that TB had become an increasingly important acquired immunodeficiency syndrome (AIDS)–defining illness in Hong Kong, surpassing Pneumocystis jirovecii pneumonia as the most common primary AIDS-defining illness in 2005; the two illnesses represented 39% and 31% of all such illnesses, respectively, in 2005.13 The presentation of HIV-associated TB is often atypical.13 Considering the declining prevalence of TB in the general population and accompanying decrease in TB transmission in Hong Kong, the implementation of strategies to enhance screening for latent TB infection, the increased use of molecular tests for TB diagnosis, and the expansion of HAART in recent years, we conducted a retrospective review of data regarding patients with HIV-associated TB that were reported to the TB-HIV Registry of the Department of Health during the period 2007 to 2020. We aimed to identify temporal trends in the epidemiology and clinical manifestations of HIV-associated TB during that period.
 
Methods
We retrospectively reviewed data contained within the TB-HIV Registry, which captured information regarding nearly all cases of HIV-associated TB diagnosed in the Tuberculosis and Chest Service and Special Preventive Programme (SPP) under the Department of Health, as well as cases referred from regional hospitals of the Hong Kong Hospital Authority, during the period 2007 to 2020. The details of data contained in the TB-HIV Registry, along with the criteria for TB as a primary AIDS-defining illness, were described in a previous report.13 There have been no changes in the criteria for TB as a primary AIDS-defining illness since the last report. Where necessary, both clinic records and hospital discharge records were reviewed. All data were imported into Epi Info14 and exported to statistical software SPSS (Windows version 26.0; IBM Corp, Armonk [NY], US) for analysis. The Cochran–Armitage trend test in XLSTAT software (Lumivero, Denver [CO], US) was used to identify trends in the proportion of reported AIDS cases with TB as a primary AIDS-defining illness during the study period. The Cochran–Armitage trend test was also used to examine changes in demographic features and clinical manifestations during the same period. Where relevant, we compared the demographic features of patients reported to the TB-HIV Registry during the study period with the features of a historical cohort from the period 1996 to 200613 using the Chi squared test. P values <0.05 were considered statistically significant.
 
This study was an extension of a previous study designed to evaluate the public health programme for HIV-associated TB in Hong Kong15; it did not constitute research on human participants. Throughout the review process, we implemented all reasonable precautions to protect the confidentiality of personal data and excluded personally identifiable information from the electronic database.
 
Results
Tuberculosis as a primary acquired immunodeficiency syndrome–defining illness
All 390 cases reported to the TB-HIV Registry from 1 January 2007 to 31 December 2020 were included in this retrospective analysis. Information about whether TB constituted a primary AIDS-defining illness was available for 363 of 390 (93.1%) patients, where TB was listed as a primary AIDS-defining illness in 251 of those cases (69.1%). Overall, TB as a primary AIDS-defining illness represented a decreasing trend of 18.3% of 1375 reported AIDS cases during the period 2007 to 202012 (Cochran–Armitage trend test, P<0.001) [Fig], compared with 28.2% (192/680; Chi squared test, P<0.001) among the historical cohort of patients reported during the period 1996 to 2006.13
 

Figure. Tuberculosis as a primary acquired immunodeficiency syndrome–defining illness in Hong Kong among 390 cases reported to the Tuberculosis–Human Immunodeficiency Virus Registry from 2007 to 2020
 
Demographic features
Trends in demographic features, including age, sex, case category, ethnicity, residence, primary source of care (first presentation), and smoking status, for the 390 HIV-associated TB cases reported to the TB-HIV Registry during the study period are shown in Table 1. The proportion of female patients significantly increased whereas that of ever-smokers significantly decreased (Cochran–Armitage trend test, P=0.035 and P=0.029, respectively). No significant trends were detected in other variables examined. Additionally, the proportions of Chinese individuals and permanent residents were lower in the present cohort than in the historical cohort of 1996 to 200613 (260/390, 66.7% vs 152/190, 80.0%; Chi squared test, P=0.001 and 258/390, 66.2% vs 144/190, 75.8%; Chi squared test, P=0.018, respectively). The proportion of female patients was significantly higher in the present cohort than in the historical cohort13 (82/390, 21.0% vs 21/190, 11.1%; Chi squared test, P=0.003).
 

Table 1. Demographics and modes of presentation of patients reported to the Tuberculosis–Human Immunodeficiency Virus Registry from 2007 to 2020 (n=390)
 
Clinical manifestations
Trends in clinical manifestations, including symptoms, presence of pulmonary TB, radiographic features (for cases with abnormalities on chest radiographs), presence of extrapulmonary TB (EPTB), most common EPTB sites, sputum smear positivity status, drug susceptibility patterns, presence of TB risk factors, CD4 cell count at TB diagnosis, presence of other AIDS-defining illnesses at the time of co-infection, and antiretroviral therapy (ART) status (among patients with a diagnosis of HIV infection before TB), among the 390 TB cases are presented in Tables 2 and 3. The proportions of patients presenting with site-specific symptoms (other than chest-related symptoms) and with EPTB both significantly increased during the period 2007 to 2020 (Cochran–Armitage trend test, P=0.029 and P=0.008, respectively) [Table 2]. The most common EPTB sites were lymph nodes (42.8%), pleura (21.5%), and abdomen (13.8%). Among patients who underwent sputum smear tests, the proportion of patients with sputum smear positivity significantly decreased (Cochran–Armitage trend test, P=0.006) [Table 2]. Among patients with lung parenchymal lesions on chest radiographs, a decreasing trend was observed in the proportion of patients in which the lower zone was the predominant lesion site (Cochran–Armitage trend test, P=0.045) [Table 3]. Among patients with a diagnosis of HIV infection before TB, the proportion of patients receiving ART at TB diagnosis significantly increased (Cochran–Armitage trend test, P=0.003) [Table 2].
 

Table 2. Clinical manifestations of patients reported to the Tuberculosis–Human Immunodeficiency Virus Registry from 2007 to 2020 (n=390)
 

Table 3. Radiographic features of patients with abnormalities on chest radiographs reported to the Tuberculosis–Human Immunodeficiency Virus Registry from 2007 to 2020
 
Discussion
This study revealed a decreasing trend in the proportion of reported AIDS cases with TB as a primary AIDS-defining illness during the period 2007 to 2020. The overall proportion (18.3%) was also lower than the proportion (28.2%) in the historical cohort of cases reported during the period 1996 to 2006.13 The proportions of Chinese individuals and permanent residents were lower, whereas the proportion of female patients was higher, in our cohort compared with the historical cohort.13 The proportions of female patients and patients with extrapulmonary involvement significantly increased, whereas the proportions of ever-smokers and the proportion with sputum smear positivity among pulmonary TB cases significantly decreased during the period 2007 to 2020. A decreasing trend was observed in the proportion of patients with pulmonary TB in which the lower zone was the predominant site of lung parenchymal lesions. Among patients with a diagnosis of HIV infection before TB, an increasing trend was observed in the proportion of patients receiving ART.
 
Decreasing trend of tuberculosis as an acquired immunodeficiency syndrome–defining illness
In Hong Kong, TB is considered an AIDS-defining illness when the disease is extrapulmonary. Pulmonary TB and cervical lymph node TB are considered AIDS-defining illnesses only when the CD4 cell count at the time of TB diagnosis is <200/μL, as recommended by the Scientific Committee of the Advisory Council on AIDS in 1994.16 Since then, there have been no changes in the criteria for TB as an AIDS-defining illness among individuals infected with HIV. The decreasing trend in Hong Kong regarding the proportion of reported AIDS cases with TB as a primary AIDS-defining illness might be due to decreased community transmission of TB through better TB control, the expansion of HAART since its introduction in 1997, and (perhaps to a lesser extent) increased acceptance of testing for latent TB infection and preventive treatment for TB among HIV-infected individuals since the early 2000s. Similar decreasing trends related to HAART-induced improvements in immune status among HIV-infected individuals have also been identified during studies conducted in some other countries.7 9 17 In an observational, retrospective study of AIDS cases included in the Barcelona AIDS register between 1994 and 2005, decreases were observed regarding the incidence of TB as an AIDS-defining illness among both native and immigrant populations.7 Another study examining trends in the incidence of AIDS-defining opportunistic illnesses over a 25-year period in Brazil showed a reduction in TB incidence from 1991-1993 to 2009-2012.9 A prospective cohort study of participants in the HIV Outpatient Study at 12 HIV clinics within the US indicated that TB incidence decreased after HAART introduction.17 Conversely, among participants in the HOMER cohort study (HAART Observational Medical Evaluation and Research) conducted during the period 1996 to 2007 in Canada, no statistically significant trends were observed in the proportion of cases with TB as the AIDS-defining illness, probably because the small number of TB cases reported in each time period limited the ability to detect significant changes in the reported cases.18 Another study examining AIDS notification data in Australia during the period 1993 to 2000 revealed that the proportion of AIDS cases with TB as the AIDS-defining illness was higher during 1996 to 2000 (post-HAART era) than during 1993 to 1995 (pre-HAART era); the authors attributed this difference to the increasing proportion of Australian patients with AIDS who had been born in sub-Saharan Africa and Asia during the 1990s, among whom the risk of TB was considerably higher.19 Further studies examining trends in TB as an AIDS-defining illness, as well as location-specific factors that may influence such trends in the post-HAART era, are warranted to facilitate control strategies for HIV-associated TB.
 
Changes in demographic features and their implications
Further attention is needed regarding the observation of higher proportions of non-Chinese individuals (mostly Asians and Africans, who have much higher TB incidence than the rate among Hong Kong Chinese individuals) and non-permanent residents of Hong Kong in the 2007-2020 cohort compared with the historical 1996-2006 cohort. Similar findings of higher incidences of AIDS-associated TB in foreign-born populations from countries with much higher TB incidence compared with the native population have been reported on the basis of some studies conducted in developed countries.7 20 21 These observations highlight the need for TB screening and prophylaxis for people living with HIV who were born in countries with a high background prevalence of TB.
 
Intriguingly, we observed an increasing trend in the proportion of women during the period 2007 to 2020. The reason for this increase is unclear; it may be related to changes in the societal roles of men and women that influence exposure risk. The role of an increased proportion of EPTB (reportedly associated with female sex and observed throughout our cohort, as discussed below) requires further investigation.
 
The proportion of ever-smokers significantly decreased during the period 2007 to 2020, consistent with the findings of some studies conducted in the US.22 23 In an analysis of patients from a HIV surveillance system in the US, the prevalence of current smoking declined from 37.6% in 2009 to 33.6% in 2014.22 In another prospective cohort study that examined smoking trends among HIV-positive patients in the US, a decline in the annual prevalence of current smoking from 1984 to 2012 was also reported; however, disparities were noted according to race, ethnicity, and education.23 Nonetheless, because smoking increases HIV-related and non–HIV-related morbidity and mortality among people living with HIV, smoking cessation interventions remain an essential component of routine care for such individuals.
 
Changes in clinical manifestations
The predominance of the lower zone as the site of lung parenchymal lesions on chest radiographs is a relatively common feature among patients with HIV-associated pulmonary TB, according to our previous report on the 1996 to 2006 cohort13 and some other reports.24 25 The present study showed that the lower zone was less frequently the predominant site of lung parenchymal lesions during the period 2007 to 2020. The proportion of patients in the 2007 to 2020 cohort with the lower zone as the predominant site (16.7%) was also lower compared with the proportion of patients in the historical 1996 to 2006 cohort (32.4%).13 This difference may be related to the higher CD4 cell count at TB diagnosis among patients in the current cohort compared with patients in the historical cohort (median CD4 cell counts at TB diagnosis: 100/μL and 78/μL, respectively). Nonetheless, lower zone involvement was present in approximately one-sixth of pulmonary TB cases reported during 2007 and 2020. A high index of suspicion is required for the accurate and timely diagnosis of pulmonary TB in people living with HIV.
 
A decreasing trend was observed in the proportion of patients with sputum smear positivity during the period 2007 to 2020. The overall proportion of patients with sputum smear positivity in the 2007 to 2020 cohort (36.6%) was also lower than the proportion in the historical cohort of 1996 to 2006 (42.2%)13; it was similar to the proportion identified during a population database study in South Korea (36.4%).26 These results suggest that TB cases have been diagnosed at increasingly earlier stages due to enhanced active TB screening efforts among people living with HIV, as well as the increased use of molecular testing that enhanced the diagnosis of smear-negative cases in Hong Kong. These results highlight the need for continued TB screening efforts and early detection of TB among people living with HIV.
 
Our findings indicate that EPTB became more common among HIV-associated TB patients during the period 2007 to 2020. The overall proportion of patients with EPTB was also higher in the present cohort compared to that reported in a local study that examined risk factors for mortality in an earlier cohort (2006 to 2015) and that in the historical 1996 to 2006 cohort (71.0%, 64.9%,15 and 62.6%,13 respectively). These differences may have arisen through enhanced diagnosis of EPTB with the increased use of molecular testing in Hong Kong. An increasing trend of extrapulmonary involvement among TB patients has also been reported in some other studies, although such studies are mostly population-based.27 28 29 Few reports have been published regarding temporal trends in EPTB specifically among HIV-associated TB patients.30 Further studies are needed to examine these trends and associated factors.
 
Strengths and limitations
Strengths of this study included its use of cohort data from the TB-HIV Registry covering a relatively long period (14 years) to study temporal changes in the epidemiology and clinical manifestations of HIV-associated TB. However, some limitations should be considered when interpreting the results of this study. First, the TB-HIV Registry may not capture all HIV-associated TB cases—some patients encountered in the SPP were not referred to a chest clinic but underwent anti-TB treatment in private clinics or other countries. The total number of HIV-associated TB cases in the HIV Surveillance Report of SPP was approximately 10% higher than the number in the TB-HIV Registry; the difference mostly comprised non-permanent residents temporarily staying in Hong Kong. Nonetheless, data from the HIV Surveillance Report showed a similar decreasing trend in TB as a primary AIDS-defining illness during the study period (data not shown). Second, this study utilised a retrospective design, and data present in the database of the TB-HIV Registry may be incomplete. Information regarding some parameters such as case category, co-morbidities, and CD4 cell count was unavailable for some patients. To overcome this limitation, we traced and reviewed relevant clinical records from chest clinics and hospitals when necessary. Therefore, we expect minimal bias due to missing data. Finally, the sample size may have led to insufficient statistical power for detecting temporal changes in some less common parameters.
 
Conclusion
This study showed that TB has become less important as a primary AIDS-defining illness in Hong Kong over the 14 years of the study period. Nonetheless, it remains the second most common primary AIDS-defining illness after P jirovecii pneumonia. Important temporal changes were also observed in the patterns of demographic features and clinical manifestations. Continued surveillance regarding the patterns of demographic features and clinical manifestations is needed to inform policymakers during the formulation of TB control strategies to improve patient care and treatment outcomes among people living with HIV. This surveillance is especially important in situations such as the coronavirus disease 2019 era, during which resources from TB programmes may be diverted to management of the global pandemic.
 
Author contributions
Concept or design: ACK Chan, SS Huang.
Acquisition of data: ACK Chan, SS Huang.
Analysis or interpretation of data: ACK Chan, SS Huang.
Drafting of the manuscript: ACK Chan, SS Huang.
Critical revision of the manuscript for important intellectual content: KH Wong, CC Leung, MP Lee, TY Tsang, WS Law, LB Tai.
 
All authors had full access to the data, contributed to the study, approved the final version for publication, and take responsibility for its accuracy and integrity.
 
Conflicts of interest
All authors have disclosed no conflicts of interest.
 
Acknowledgement
The authors thank all of their colleagues in the Tuberculosis and Chest Service and the Special Preventive Programme of the Department of Health who provided assistance and support to make this paper possible. The authors also thank Ms Ida KY Mak, Research Officer at the Tuberculosis and Chest Service of the Department of Health, for her dedicated efforts in maintaining the Tuberculosis–Human Immunodeficiency Virus Registry and assisting with the analysis.
 
Funding/support
This research received no specific grant from any funding agency in the public, commercial, or not-for-profit sectors.
 
Ethics approval
This research was a retrospective analysis of observational data routinely collected in a local Registry as part of the ongoing evaluation of the public health programme for human immunodeficiency virus–associated tuberculosis in Hong Kong. Approval for the evaluation and exemption from obtaining informed patient consent has been granted by the Ethics Committee of the Department of Health of the Hong Kong SAR Government (Ref No.: L/M 416/2017).
 
References
1. Low A, Gavriilidis G, Larke N, et al. Incidence of opportunistic infections and the impact of antiretroviral therapy among HIV-infected adults in low- and middleincome countries: a systematic review and meta-analysis. Clin Infect Dis 2016;62:1595-603. Crossref
2. B-Lajoie MR, Drouin O, Bartlett G, et al. Incidence and prevalence of opportunistic and other infections and the impact of antiretroviral therapy among HIV-infected children in low- and middle-income countries: a systematic review and meta-analysis. Clin Infect Dis 2016;62:1586-94. Crossref
3. Rubaihayo J, Tumwesigye NM, Konde-Lule J. Trends in prevalence of selected opportunistic infections associated with HIV/AIDS in Uganda. BMC Infect Dis 2015;15:187. Crossref
4. World Health Organization. Global Tuberculosis Report 2022. Geneva: World Health Organization; 2022. Available from: https://www.who.int/teams/global-tuberculosis-programme/tb-reports/global-tuberculosis-report-2022. Accessed 4 Jul 2024.
5. World Health Organization. WHO releases new global lists of high-burden countries for TB, HIV-associated TB and drug-resistant TB. 2021. Available from: https://www.who.int/news/item/17-06-2021-who-releases-new-global-lists-of-high-burden-countries-for-tb-hiv-associated-tb-and-drug-resistant-tb. Accessed 4 Jul 2024.
6. Benito N, Moreno A, Miro JM, Torres A. Pulmonary infections in HIV-infected patients: an update in the 21st century. Eur Respir J 2012;39:730-45. Crossref
7. Martin V, García de Olalla P, Orcau A, Caylà JA. Factors associated with tuberculosis as an AIDS-defining disease in an immigration setting. J Epidemiol 2011;21:108-13. Crossref
8. González-García A, Fortún J, Elorza Navas E, et al. The changing epidemiology of tuberculosis in a Spanish tertiary hospital (1995-2013). Medicine (Baltimore) 2017;96:e7219. Crossref
9. Coelho L, Cardoso SW, Amancio RT, et al. Trends in AIDS-defining opportunistic illnesses incidence over 25 years in Rio de Janeiro, Brazil. PLoS One 2014;9:e98666. Crossref
10. Centre for Health Protection, Department of Health, Hong Kong SAR Government. Annual Report. Tuberculosis and Chest Service. 2020. Available from: https://www.info.gov.hk/tb_chest/doc/Annual_Report_2020.pdf. Accessed 16 Nov 2022.
11. Centre for Health Protection, Department of Health, Hong Kong SAR Government. Notification & death rate of tuberculosis (all forms), 1947-2022. Available from: https://www.chp.gov.hk/en/statistics/data/10/26/43/88.html. Accessed 17 Nov 2022.
12. Centre for Health Protection, Department of Health, Hong Kong SAR Government. HIV Surveillance Report—2020 Update. 2021. Available from: https://www.chp.gov.hk/ files/pdf/aids20.pdf. Accessed 16 Nov 2022.
13. Chan CK, Alvarez Bognar F, Wong KH, et al. The epidemiology and clinical manifestations of human immunodeficiency virus–associated tuberculosis in Hong Kong. Hong Kong Med J 2010;16:192-8.
14. Centers for Disease Control and Prevention, United States Government. Epi Info. Available from: https://www.cdc.gov/epiinfo/index.html. Accessed 4 Jul 2024.
15. Chan CK, Wong KH, Lee MP, et al. Risk factors associated with 1-year mortality among patients with HIV-associated tuberculosis in areas with intermediate tuberculosis burden and low HIV prevalence. Hong Kong Med J 2018;24:473-83. Crossref
16. Scientific Committee of the Advisory Council on AIDS Hong Kong. Classification system for HIV infection and surveillance case definition for AIDS in adolescents and adults in Hong Kong. 1995. Available from: https://www.aids.gov.hk/pdf/g40.pdf. Accessed 16 Nov 2022.
17. Buchacz K, Baker RK, Palella FJ Jr, et al. AIDS-defining opportunistic illnesses in US patients, 1994-2007: a cohort study. AIDS 2010;24:1549-59. Crossref
18. Jafari S, Chan K, Aboulhosn K, et al. Trends in reported AIDS defining illnesses (ADIs) among participants in a universal antiretroviral therapy program: an observational study. AIDS Res Ther 2011;8:31. Crossref
19. Dore GJ, Li Y, McDonald A, Ree H, Kaldor JM; National HIV Surveillance Committee. Impact of highly active antiretroviral therapy on individual AIDS-defining illness incidence and survival in Australia. J Acquir Immune Defic Syndr 2002;29:388-95. Crossref
20. Camoni L, Regine V, Boros S, Salfa MC, Raimondo M, Suligoi B. AIDS patients with tuberculosis: characteristics and trend of cases reported to the National AIDS Registry in Italy—1993-2010. Eur J Public Health 2012;23:658-63. Crossref
21. Dore GJ, Li Y, McDonald A, Kaldor JM. Spectrum of AIDS-defining illnesses in Australia, 1992 to 1998: influence of country/region of birth. J Acquir Immune Defic Syndr 2001;26:283-90.
22. Frazier EL, Sutton MY, Brooks JT, Shouse RL, Weiser J. Trends in cigarette smoking among adults with HIV compared with the general adult population, United States—2009-2014. Prev Med 2018;111:231-4. Crossref
23. Akhtar-Khaleel WZ, Cook RL, Shoptaw S, et al. Trends and predictors of cigarette smoking among HIV seropositive and seronegative men: the multicenter AIDS cohort study. AIDS Behav 2016;20:622-32. Crossref
24. Affusim C, Abah V, Kesieme EB, et al. The effect of low CD4+ lymphocyte count on the radiographic patterns of HIV patients with pulmonary tuberculosis among Nigerians. Tuberc Res Treat 2013;2013:535769. Crossref
25. Chamie G, Luetkemeyer A, Walusimbi-Nanteza M, et al. Significant variation in presentation of pulmonary tuberculosis across a high resolution of CD4 strata. Int J Tuberc Lung Dis 2010;14:1295-302.
26. Kim JM, Kim NJ, Choi JY, Chin BS. History of acquired immune deficiency syndrome in Korea. Infect Chemother 2020;52:234-44. Crossref
27. Ben Ayed H, Koubaa M, Marrakchi C, et al. Extrapulmonary tuberculosis: update on the epidemiology, risk factors and prevention strategies. Int J Trop Dis 2018;1:006.
28. Peto HM, Pratt RH, Harrington TA, LoBue PA, Armstrong LR. Epidemiology of extrapulmonary tuberculosis in the United States, 1993-2006. Clin Infect Dis 2009;49:1350-7. Crossref
29. Sandgren A, Hollo V, van der Werf MJ. Extrapulmonary tuberculosis in the European Union and European Economic Area, 2002 to 2011. Euro Surveill 2013;18:20431. Crossref
30. Mohammed H, Assefa N, Mengistie B. Prevalence of extrapulmonary tuberculosis among people living with HIV/AIDS in sub-Saharan Africa: a systemic review and meta-analysis. HIV AIDS (Auckl) 2018;10:225-37. Crossref
Diagnostic accuracy of a prehospital electrocardiogram rule-based algorithm for ST-elevation myocardial infarction: results from a population-wide project

Hong Kong Med J 2024 Aug;30(4):271–80 | Epub 25 Jul 2024
© Hong Kong Academy of Medicine. CC BY-NC-ND 4.0
 
ORIGINAL ARTICLE  CME
Diagnostic accuracy of a prehospital electrocardiogram rule-based algorithm for ST-elevation myocardial infarction: results from a population-wide project
Joanne HY Lai, MB, BS, FHKAM (Emergency Medicine)1; CT Lui, MB, BS, FHKAM (Emergency Medicine)1; Total WT Chan, MB, ChB, FHKAM (Emergency Medicine)2; Ben CP Wong, MB, ChB, FHKAM (Emergency Medicine)2; Matthew SH Tsui, MB, BS, FHKAM (Emergency Medicine)3; Ben KA Wan, MB, BS, FHKAM (Emergency Medicine)4,5; KL Mok, MB, BS, FHKAM (Emergency Medicine)4,5
1 Department of Accident and Emergency, Tuen Mun Hospital, Hong Kong SAR, China
2 Department of Accident and Emergency, Tin Shui Wai Hospital, Hong Kong SAR, China
3 Department of Accident and Emergency, Queen Mary Hospital, Hong Kong SAR, China
4 Department of Accident and Emergency, Ruttonjee & Tang Shiu Kin Hospitals, Hong Kong SAR, China
5 Fire Services Department, Hong Kong SAR, China
 
Corresponding author: Dr Joanne HY Lai (joannelaihy@fellow.hkam.hk)
 
 Full paper in PDF
 
Abstract
Introduction: This study reviewed the diagnostic accuracy of the prehospital electrocardiogram (PHECG) rule-based algorithm for ST-elevation myocardial infarction (STEMI) universally utilised in Hong Kong.
 
Methods: This prospective observational study was linked to a population-wide project. We analysed 2210 PHECGs performed on patients who presented to the emergency medical service (EMS) with chest pain from 1 October to 31 December 2021. The diagnostic accuracy of the adopted rule-based algorithm, the Hannover Electrocardiogram System, was evaluated using the adjudicated blinded rating by two investigators as the primary reference standard. Diagnostic accuracy was also evaluated using the attending emergency physician’s diagnosis and the diagnosis on hospital discharge as secondary reference standards.
 
Results: The prevalence of STEMI was 5.1% (95% confidence interval [CI]=4.2%-6.1%). Using the adjudicated blinded rating by investigators as the reference standard, the rule-based PHECG algorithm had a sensitivity of 94.6% (95% CI=88.2%-97.8%), specificity of 87.9% (95% CI=86.4%-89.2%), positive predictive value of 29.4% (95% CI=24.8%-34.4%), and negative predictive value of 99.7% (95% CI=99.3%-99.9%) [all P<0.05].
 
Conclusion: The rule-based PHECG algorithm that is widely used in Hong Kong demonstrated high sensitivity and fair specificity for the diagnosis of STEMI.
 
 
New knowledge added by this study
  • The prehospital electrocardiogram (PHECG) diagnostic algorithm universally utilised in Hong Kong had high sensitivity for diagnosing ST-elevation myocardial infarction (STEMI) in a population-wide cohort of patients with chest pain.
  • One in eight ECGs showed false-positive results for STEMI; the leading causes were early repolarisation, left bundle branch block, and extreme tachycardia.
  • Evolving ECG patterns, subtle ST-segment elevation, and STEMI equivalents were responsible for false-negative diagnoses.
Implications for clinical practice or policy
  • Primary diversion of STEMI patients to centres capable of primary percutaneous coronary intervention should not be implemented solely based on the algorithm’s ECG diagnosis.
  • ST-elevation myocardial infarction can be reasonably excluded by the PHECG diagnostic algorithm.
  • Physicians should be aware of STEMI equivalents that are not identified by the algorithm.
 
 
Introduction
Heart disease is the third leading cause of death in Hong Kong. In 2019, an average of approximately 10.2 people died from coronary heart disease each day.1 International guidelines recommend prehospital 12-lead electrocardiogram (ECG) for the assessment of patients with suspected acute coronary syndrome who present to emergency medical services (EMS).2 3 Prehospital triage with direct transfer to the cardiac catheterisation laboratory for primary percutaneous coronary intervention is a strategy adopted by various healthcare systems to reduce reperfusion time in patients with ST-elevation myocardial infarction (STEMI).4 5 Previous studies have investigated the diagnostic performances of prehospital electrocardiograms (PHECGs) for STEMI by various automated algorithms,6 7 8 9 10 trained onsite EMS personnel,11 12 and emergency department (ED) physicians remotely interpreting the tele-transmitted ECGs13; the findings have implications for policymakers involved in planning systems of care to minimise inappropriate resource mobilisation.
 
In Hong Kong, the Hospital Authority, the local public healthcare service, and Hong Kong Fire Services Department, the primary EMS provider, jointly launched the Prehospital 12-Lead Electrocardiogram for Chest Pain Protocol on 1 February 2021. The Protocol covers the catchment areas of all EDs in Hong Kong and serves a population of 7.41 million. This study utilised data from a territory-wide audit of the Protocol to determine the diagnostic performance of the PHECG algorithm for STEMI.
 
Methods
Study design and setting
This prospective observational study analysed data from the territory-wide audit project regarding the Prehospital 12-Lead Electrocardiogram for Chest Pain Protocol, led by the Hong Kong Hospital Authority Coordinating Committee in Accident and Emergency. The Protocol was designed to include all patients with complaints of chest pain, excluding those <12 years of age; in cardiac arrest; with unmanageable airway or breathing; a Glasgow Coma Scale score of ≤13; a first systolic blood pressure of <90 mm Hg; a respiratory rate of <10 or >29 breaths per minute; or refusal or inability to give consent.
 
Ambulances were equipped with 12-lead ECG machines capable of automatic algorithm-based diagnosis. The selected machine model was a corpuls3 Monitor and Defibrillator (GS Elektromedizinische Geräte G Stemple GmbH, Kaufering, Germany), with the telemedicine application corpuls.mission (GS Elektromedizinische Geräte G Stemple GmbH, Kaufering, Germany). The selected ECG algorithm was the ECG diagnostic algorithm of the Hannover ECG System (Corscience GmbH & Co KG, Erlangen, Germany).
 
Upon encountering a patient who met the Protocol’s criteria, the ambulance personnel performed a 12-lead ECG on scene or in the stationary ambulance compartment. The ECG was immediately analysed by the computer algorithm and classified as ‘STEMI’, ‘Not STEMI’, or ‘N/A’ (not interpretable due to suboptimal ECG quality). Additional ECGs were performed as necessary to improve quality. The ECG(s) were tele-transmitted to the ED serving the particular catchment area for reading and interpretation by the ED attending physician. If the ECG was classified as ‘STEMI’ by the computer algorithm, the EMS personnel also directly called to alert the ED. The ED prepared the resuscitation room for patient arrival if the ECG was classified as STEMI by the ED physician.
 
Study population and data collection
This study adhered to the STARD (Standards for Reporting of Diagnostic Accuracy Studies) 2015 reporting guideline. Patients with PHECGs performed in accordance with the Protocol throughout Hong Kong were prospectively recruited from 1 October to 31 December 2021.
 
Prehospital ECGs performed and tele-transmitted during the study period were obtained from corpuls.mission’s online database and matched to clinical data from the Clinical Data Analysis and Reporting System and Accident and Emergency Information System (Information Technology and Health Informatics Division, Hospital Authority, Hong Kong). Electrocardiograms without matching patient data and those classified as ‘N/A’ by the algorithm were excluded from the analysis.
 
Three reference standards were used to investigate the diagnostic accuracy of the computer algorithm. The first reference standard, the primary outcome, was adjudicated blinded rating of the ECG. Each ECG was de-identified and independently interpreted as ‘STEMI’, ‘Not STEMI’ or ‘Not interpretable’ by two investigators: an emergency physician with ≥5 years of experience in emergency medicine practice and a specialist in Emergency Medicine. Electrocardiograms for which there was disagreement between the interpretations of the two blinded raters were classified according to the blinded interpretation of an adjudicator (a second Emergency Medicine specialist). The diagnosis of STEMI was based on the Fourth Universal Definition of Myocardial Infarction14 and the modified Sgarbossa criteria for left bundle branch block or ventricular paced rhythm.15 16 ST-elevation myocardial infarction mimics17 and STEMI equivalents, according to the 2022 ACC Expert Consensus Decision Pathway on the Evaluation and Disposition of Acute Chest Pain in the Emergency Department,18 were regarded as ‘Not STEMI’. ‘Not interpretable’ ECGs were those with substantial motion artefacts, wavering baseline, or disconnected lead(s); these ECGs were excluded from the analysis.
 
The second reference standard was the ED attending physician’s diagnosis, which considered the patient’s clinical condition, along with additional ECGs and other investigations performed upon arrival in the ED. Patients without ECGs performed in the ED were excluded from the analysis.
 
The third reference standard was the diagnosis on hospital discharge from the index admission. We excluded patients who died in the ED without an established diagnosis, who developed STEMI after admission, or were discharged with acknowledgement of medical advice and no definitive diagnosis.
 
Interrater agreement analysis was performed in three dimensions, namely, between the two blinded raters, between the adjudicated blinded rating and the ED diagnosis, and between the adjudicated blinded rating and the diagnosis on hospital discharge. If there was disagreement between the adjudicated blinded rating and the ED diagnosis, the prehospital and ED ECGs were reviewed by the principal investigator to differentiate between dynamic change or true disagreement. Dynamic change was defined as the lack of ST-segment elevation and ECG criteria fulfilment on the initial PHECG, with subsequent evidence on serial ECG performed in the ED.
 
False-positive and false-negative ECGs were reviewed and classified by the principal investigator. The following categories of ECG morphology were determined based on criteria described in existing literature: Brugada pattern,19 early repolarisation,20 left bundle branch block or paced rhythm not matching STEMI criteria,15 16 left ventricular hypertrophy,21 pericarditis,22 and ventricular ectopics.23
 
Statistical analysis
Continuous variables were presented as mean ± standard deviation and were analysed with the independent t test. Categorical variables were reported as absolute frequencies and percentages and were analysed with the Chi squared test or Fisher’s exact test. Interrater agreement regarding ECG diagnosis was analysed using Cohen’s kappa. Sensitivity, specificity, and predictive values were derived from 2 × 2 contingency tables and analysed with the Chi squared test.
 
The threshold for statistical significance was regarded as P<0.05. All statistical analyses were performed using SPSS software (Windows version 26.0; IBM Corp, Armonk [NY], US).
 
Results
Baseline characteristics
During the study period, 2801 PHECGs were performed, one for each patient who presented with chest pain. Of these ECGs, 2437 were matched to electronic patient records. After the exclusion of 103 ECGs classified as ‘N/A’ by the computer algorithm, 2334 ECGs were included in the analysis (Fig 1).
 

Figure 1. Patient selection for diagnostic accuracy analysis
 
The characteristics of the study population are presented in Table 1. Overall, 62.9% of the patients were men. The mean age of male patients, female patients, and both sexes were 63.9 years, 74.1 years, and 67.7 years, respectively. In total, 83.6% of patients were placed on stretchers upon arrival at the ED. Furthermore, 8.2% of patients were institutionalised in residential homes. Of the ECGs, 42.4% were performed during 0800 to 1559 hours, 35.4% were performed during 1600 to 2359 hours, and 22.3% were performed during 0000 to 0759 hours. A total of 405 (17.4%) PHECGs were classified as STEMI by the algorithm.
 

Table 1. Characteristics of the study population
 
Primary outcome
The primary outcome was diagnostic accuracy based on the adjudicated blinded rating. The prevalence of STEMI was 5.1% (Table 2). There was good interrater observed agreement (96.9%) between the two blinded ECG assessors. Cohen’s kappa was 0.84 (95% confidence interval [CI]=0.81-0.88; P<0.05) [Table 3]. The algorithm had a sensitivity of 94.6% (95% CI=88.2%-97.8%), specificity of 87.9% (95% CI=86.4%-89.2%), positive predictive value of 29.4% (95% CI=24.8%-34.4%), negative predictive value of 99.7% (95% CI=99.3%-99.9%), positive likelihood ratio of 7.8 (95% CI=6.9-8.8), and negative likelihood ratio of 0.06 (95% CI=0.03-0.13) [all P<0.05] (Table 2).
 

Table 2. Diagnostic performance of the prehospital electrocardiogram algorithm according to respective reference standards
 

Table 3. Analysis of interrater agreement
 
Secondary outcomes
Secondary outcomes were the algorithm’s diagnostic accuracy with reference to the ED attending physician’s diagnosis and to the diagnosis on hospital discharge.
 
Substantial agreement was observed between the diagnosis based on the adjudicated blinded rating and these two reference standards. Discrepancies in agreement between the adjudicated blinded rating of ECGs and these two reference standards reflected the presence of dynamic ECG changes. Observed agreement between the adjudicated blinded rating and ED physician’s diagnosis was 97.1%, with Cohen’s kappa of 0.69. Excluding patients with dynamic ECG changes in the ED, the observed agreement was 98.2% and Cohen’s kappa was 0.78. Observed agreement between the adjudicated blinded rating and final discharge diagnosis was 97.5%, with Cohen’s kappa of 0.74. Excluding patients with dynamic ECG changes in the ED, the observed agreement was 98.4% and Cohen’s kappa was 0.80 (Table 3). The diagnostic performance based on the three reference standards and the analysis of interrater agreement are summarised in Tables 2 and 3, respectively.
 
Characteristics of false-positive electrocardiograms
The 255 false-positive ECGs with the adjudicated blinded rating as the reference standard were reviewed and characterised as shown in Figure 2. The leading causes were early repolarisation (n=97; 38.0%), left bundle branch block (n=40; 15.7%), and tachycardia of >140 beats per minute (n=34; 13.3%). Excluding ECGs with suboptimal quality (classified as ‘N/A’ by the algorithm and ‘Not interpretable’ according to adjudicated blinded rating), false-positive ECGs due to artefacts constituted 8.6% (n=22).
 

Figure 2. Electrocardiogram features of false-positive electrocardiograms with the adjudicated blinded rating as the reference standard (n=255)
 
Characteristics of false-negative electrocardiograms
Using the diagnosis on hospital discharge as the reference standard, 22 STEMI cases were missed by the algorithm (Fig 3). Thirteen (59.1%) of the false-negative ECGs were due to the development of dynamic ECD changes in the ED; four (18.2%) of these had subtle ST-segment elevation. ST-segment elevation in lead augmented vector right and the STEMI equivalent morphology of de Winter’s T wave were noted in two (9.1%) ECGs each. One ECG was classified as ‘Not interpretable’ according to the adjudicated blinded rating because of substantial artefacts.
 

Figure 3. Electrocardiogram features of false-negative electrocardiograms with diagnosis on hospital discharge as the reference standard (n=22)
 
Discussion
Implications on prehospital care systems for ST-elevation myocardial infarction
This prospective observational study examined the diagnostic performance of a rule-based PHECG algorithm universally utilised in Hong Kong, based on three levels of reference standards. The primary outcome, adjudicated blinded rating, closely reflects diagnostic performance without the addition of patient clinical history and presentation or any other diagnostic aids. The American Heart Association recommends three levels of PHECG diagnosis, namely, EMS interpretation, computerised algorithm diagnosis, and ECG transmission for remote interpretation.24 However, in healthcare systems such as the Hospital Authority in Hong Kong, EMS are trained to perform but not interpret PHECGs. Thus, it is important to understand reliance on the computerised algorithm using the benchmark of physician-based remote interpretation; these data can guide the establishment and improvement of care systems.
 
One in eight of the PHECGs in this study showed false-positive results. Considering the fair specificity and positive predictive value of only 29.4% for the automated ECG diagnostic programme, this high false-positive rate reflected limitations in guiding prehospital treatment and streamlining care systems (eg, prehospital diversion to percutaneous coronary intervention–capable centres or prehospital triage for direct transfer to a cardiac catheterisation laboratory). A hybrid two-step ECG interpretation model, involving a physician’s remote (ie, telemedicine-based) interpretation of ECGs that are classified as STEMI by the computerised algorithm, could be adopted to minimise overactivation and ensure prudent use of healthcare resources. Nonetheless, the algorithm exhibited good sensitivity in terms of identifying STEMI patients. Its high negative predictive value allowed STEMI to be reasonably excluded based on ECG results. Although remote PHECG interpretation is considered relatively accurate, it generally results in STEMI misdiagnosis rates of 6% to 8%.13 Therefore, we included secondary outcomes, namely, the algorithm’s diagnostic performance based on the ED attending physician’s diagnosis and the final discharge diagnosis; we assessed interrater agreement between these reference standards. We adopted an operational approach focused on the ‘appropriateness of cardiac catheterisation laboratory activation’, rather than a strictly patient-centred approach based on primary percutaneous coronary intervention findings or cardiac biomarkers.
 
Diagnostic performance varies across electrocardiogram machine models and algorithms
The inclusion of three reference standards was intended to address the heterogeneous estimates of PHECG diagnostic performance for STEMI in existing literature. Prior studies have been based on various reference standards, including blinded physician rating,25 ED attending physician’s diagnosis,6 26 hospital discharge diagnosis,7 and the appropriateness of coronary angiography activation.8 The results have varied according to STEMI prevalence in the study population, as well as the reference standard, ECG machine, and computerised algorithm. Using ED clinical diagnosis as the reference standard, a single-centre pilot study in Hong Kong by Cheung et al6 utilising the X Series Monitor/Defibrillator and Inovise 12L Interpretive Algorithm (Zoll Medical Corporation, Chelmsford [MA], US) demonstrated a low sensitivity (53.8%) and high specificity (99.6%). Bhalla et al26 utilised LIFEPAK 12 monitors (Physio-Control, Redmond [WA], US) equipped with a Marquette 12SL ECG analysis programme (General Electric Company, Fairfield [CT], US) to evaluate PHECGs from 100 STEMI patients and 100 control participants; they found a similarly low sensitivity (58%) and very high specificity (100%). Bosson et al7 examined ECGs obtained with the LIFEPAK 15 monitor (Physio-Control, Inc, Minneapolis [MN], US) and analysed using the University of Glasgow 12-Lead ECG Analysis Programme (version 27); their results showed 92.8% sensitivity and 98.7% specificity, based on the reference standard of appropriateness for emergency coronary angiography.7 The prevalence of STEMI was much lower in their study than in our study (1.4%7 vs 5.1% [Table 2]) because their dataset also included PHECGs performed for symptoms other than chest pain. Using the same ECG machine model as the aforementioned study,7 Fakhri et al8 tested an automated analysis method with a high-specificity STEMI configuration. In a carefully selected STEMI population, the sensitivity and specificity were 69.8% and 51.5%, respectively, based on discharge diagnosis.8 A meta-analysis conducted by Tanaka et al27 suggested that computer-assisted ECG interpretation had a high pooled specificity (95.4%; 95% CI=87.3%-98.4%) with an acceptable estimated number of false-positive results, whereas the pooled sensitivity was relatively low (85.4%; 95% CI=74.1%-92.3%), for identifying STEMI on PHECG. All of these studies utilised ECG machines and diagnostic algorithms that differed from our method, emphasising that diagnostic performance varies across models; evaluations of specific ECG machines and algorithms should be conducted by individual healthcare systems to suit their operational needs.
 
Major patterns of false-positive and falsenegative electrocardiograms
The Hannover ECG System algorithm utilised in our study was one of nine computer programmes investigated in the international Common Standards for Quantitative Electrocardiography Diagnostic Study,28 using clinical diagnosis as the reference standard. This statistics-based algorithm exhibited one of the highest sensitivities (79.0%) for detecting myocardial infarction compared with all algorithms combined (72.2%); its sensitivity also was similar to that of the combined independent ratings of eight cardiologists (80.3%). However, its ability to correctly classify normal ECGs (86.6%) was lower than that of the combined ratings of cardiologists (97.1%) and the combined algorithms (96.7%). Our findings are consistent with the results of the Common Standards for Quantitative Electrocardiography Diagnostic Study. The presence of artefacts contributed to 8.6% of false-positive ECGs; this rate could be improved by enhancing ECG technique. The major patterns of misdiagnosis were early repolarisation (38.0%), left bundle branch block (15.7%), and tachycardia of >140 beats per minute (13.3%) [Fig 2]. Artefacts on ECG were responsible for the largest proportion of false-positive ECGs8; they contributed a smaller proportion in our dataset because we excluded ECGs considered ‘Not interpretable’ by the algorithm or blinded raters. Early repolarisation remained a leading cause of false-positive ECGs, and existing consensus papers on early repolarisation may help guide future algorithm development.20 29 Further collaboration with the software provider to optimise the algorithm may enhance its accuracy.
 
Among cases of STEMI missed by the algorithm using diagnosis on hospital discharge as the reference standard, more than half were caused by ECG changes after patient arrival in the ED. False-negative ECGs due to subtle ST-segment elevation represented only 3.45% of all STEMI patients. Remote physician interpretation of these PHECGs would likely be equivocal and uncertain. It presumably would not be beneficial to adjust the algorithm to correct this margin of error, considering the potential for additional false-positives. However, it might be useful to refine the algorithm for enhanced detection of STEMI equivalents, which were missed in the current cohort.
 
The rise of artificial intelligence
Although the diagnostic limitations of rule-based algorithms are recognised, Zhao et al9 described an artificial intelligence diagnostic algorithm that showed promising results (96.8% sensitivity and 99% specificity) using coronary angiography findings as the reference standard. The potential role of artificial intelligence in PHECG diagnosis merits further exploration to increase accuracy.
 
Paradigm shift in classifying myocardial infarction
Meyers et al30 proposed a new paradigm of occlusion myocardial infarction (OMI) vs non-OMI, which they compared with the conventional STEMI vs non-STEMI paradigm. Occlusion myocardial infarction refers to type 1 myocardial infarction that involves acute total or near-total occlusion of a major epicardial coronary vessel with insufficient collateral circulation, causing acute infarction. Meyers et al30 showed that 38% of OMI patients did not meet ECG-based STEMI criteria, as stated in the 4th Universal Definition of Myocardial Infarction.14 Compared with OMI patients who met STEMI criteria, patients not meeting the criteria experienced significant delays in cardiac catheterisation but exhibited similar adverse outcome profiles. These findings highlight the need to re-evaluate classification strategies for acute coronary syndrome, with a focus on rapidly recognising this underserved and poorly understood subgroup of patients who would benefit from emergent reperfusion therapy. Future research should emphasise identifying ECG features of OMI beyond the STEMI criteria.
 
Limitations
First, 13% of PHECGs were not matched to electronic patient records, resulting in the loss of data for interpretation. Second, during adjudicated blinded rating of the ECGs, STEMI equivalents were not included in the definition of STEMI because the algorithm was not designed to include these characteristics. This exclusion differs from real-world scenarios in which the recognition of STEMI equivalents would prompt ED physicians to implement STEMI management. Third, this study evaluated a single rule-based algorithm combined with a single ECG machine model utilised by a single urban EMS service provider serving a predominantly ethnic Chinese population. Fourth, intraobserver variability was not assessed for each ECG reviewer. Finally, ECGs considered ‘Not interpretable’ by ECG reviewers due to substantial artefacts were excluded from data analysis, which might lead to underestimation regarding the contributions of artefacts to false positivity.
 
Conclusion
In this territory-wide study, a rule-based PHECG algorithm demonstrated good sensitivity and fair specificity for the diagnosis of STEMI.
 
Author contributions
Concept or design: JHY Lai, CT Lui.
Acquisition of data: JHY Lai, TWT Chan, BCP Wong.
Analysis or interpretation of data: JHY Lai, CT Lui.
Drafting of the manuscript: JHY Lai.
Critical revision of the manuscript for important intellectual content: CT Lui, TWT Chan, BCP Wong, MSH Tsui, BKA Wan, KL Mok.
 
All authors had full access to the data, contributed to the study, approved the final version for publication, and take responsibility for its accuracy and integrity.
 
Conflicts of interest
All authors have disclosed no conflicts of interest.
 
Funding/support
This research received no specific grant from any funding agency in the public, commercial, or not-for-profit sectors.
 
Ethics approval
The research was approved by the New Territories West Cluster Research Ethics Committee of Hospital Authority, Hong Kong (Ref No.: NTWC/REC/21097). The requirement for patient consent was waived by the Committee because the study was conducted within a preexisting prehospital clinical service.
 
References
1. HealthyHK, Hong Kong SAR Government. Coronary heart diseases. 2021. Available from: https://www.healthyhk.gov.hk/phisweb/en/chart_detail/24/. Accessed 3 Dec 2022.
2. O’Gara PT, Kushner FG, Ascheim DD, et al. 2013 ACCF/AHA guideline for the management of ST-elevation myocardial infarction: executive summary: a report of the American College of Cardiology Foundation/American Heart Association Task Force on Practice Guidelines. J Am Coll Cardiol 2013;61:485-510. Crossref
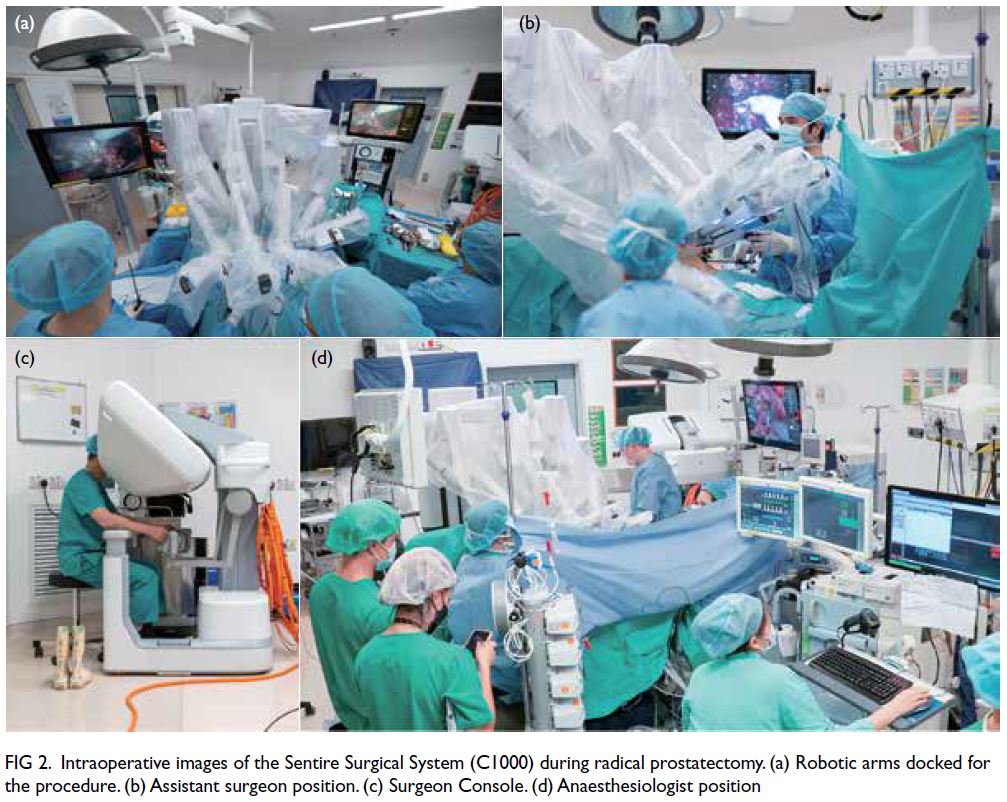
3. Ibánez B, James S, Agewall S, et al. 2017 ESC Guidelines for the management of acute myocardial infarction in patients presenting with ST-segment elevation [in English, Spanish]. Rev Esp Cardiol (Engl Ed) 2017;70:1082. Crossref
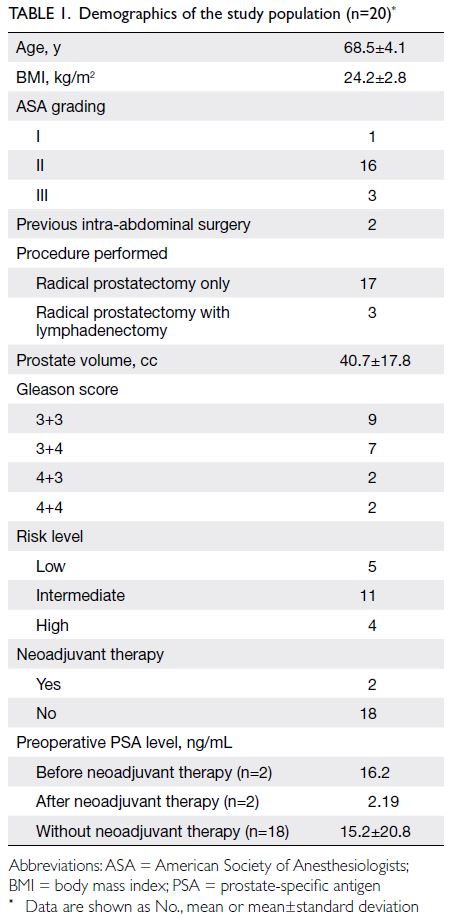
4. Kontos MC, Gunderson MR, Zegre-Hemsey JK, et al. Prehospital activation of hospital resources (PreAct) ST-segment-elevation myocardial infarction (STEMI): a standardized approach to prehospital activation and direct to the catheterization laboratory for STEMI recommendations from the American Heart Association’s mission: lifeline program. J Am Heart Assoc 2020;9:e011963. Crossref
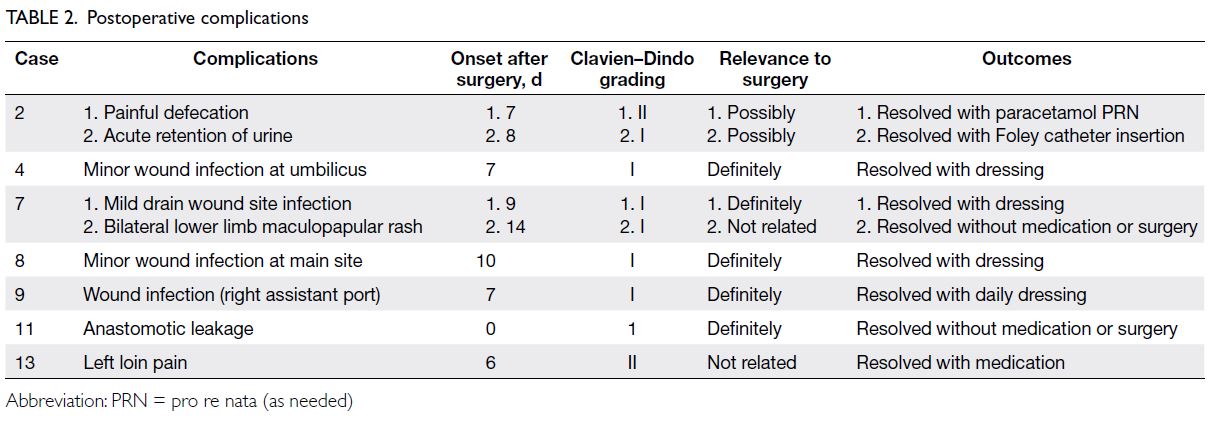
5. Brunetti ND, De Gennaro L, Correale M, et al. Prehospital electrocardiogram triage with telemedicine near halves time to treatment in STEMI: a meta-analysis and meta-regression analysis of non-randomized studies. Int J Cardiol 2017;232:5-11. Crossref
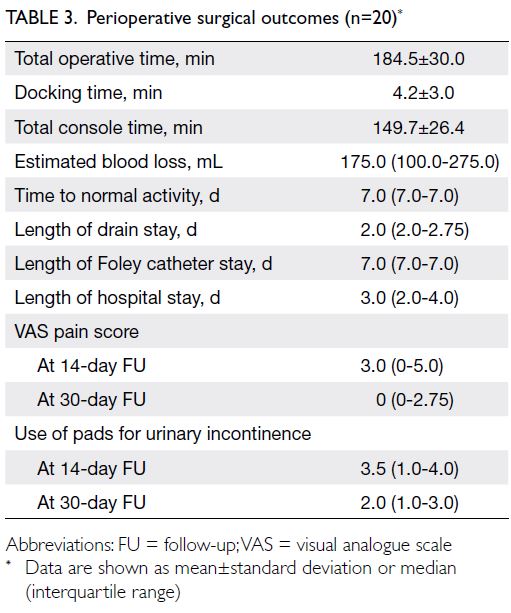
6. Cheung KS, Leung LP, Siu YC, et al. Prehospital 12-lead electrocardiogram for patients with chest pain: a pilot study. Hong Kong Med J 2018;24:484-91. Crossref
7. Bosson N, Sanko S, Stickney RE, et al. Causes of prehospital misinterpretations of ST elevation myocardial infarction. Prehosp Emerg Care 2017;21:283-90. Crossref
8. Fakhri Y, Andersson H, Gregg RE, et al. Diagnostic performance of a new ECG algorithm for reducing false positive cases in patients suspected acute coronary syndrome. J Electrocardiol 2021;69:60-4. Crossref
9. Zhao Y, Xiong J, Hou Y, et al. Early detection of ST-segment elevated myocardial infarction by artificial intelligence with 12-lead electrocardiogram. Int J Cardiol 2020;317:223-30. Crossref
10. Goebel M, Vaida F, Kahn C, Donofrio JJ. A novel algorithm for improving the diagnostic accuracy of prehospital STelevation myocardial infarction. Prehosp Disaster Med 2019;34:489-96. Crossref
11. Le May MR, Dionne R, Maloney J, et al. Diagnostic performance and potential clinical impact of advanced care paramedic interpretation of ST-segment elevation myocardial infarction in the field. CJEM 2006;8:401-7. Crossref
12. Ducas RA, Wassef AW, Jassal DS, et al. To transmit or not to transmit: how good are emergency medical personnel in detecting STEMI in patients with chest pain? Can J Cardiol 2012;28:432-7. Crossref
13. Tanguay A, Lebon J, Brassard E, Hébert D, Bégin F. Diagnostic accuracy of prehospital electrocardiograms interpreted remotely by emergency physicians in myocardial infarction patients. Am J Emerg Med 2019;37:1242-7. Crossref
14. Thygesen K, Alpert JS, Jaffe AS, et al. Fourth universal definition of myocardial infarction (2018). J Am Coll Cardiol 2018;72:2231-64. Crossref
15. Meyers HP, Limkakeng AT Jr, Jaffa EJ, et al. Validation of the modified Sgarbossa criteria for acute coronary occlusion in the setting of left bundle branch block: a retrospective case-control study. Am Heart J 2015;170:1255-64. Crossref
16. Smith SW, Dodd KW, Henry TD, Dvorak DM, Pearce LA. Diagnosis of ST-elevation myocardial infarction in the presence of left bundle branch block with the ST-elevation to S-wave ratio in a modified Sgarbossa rule. Ann Emerg Med 2012;60:766-76. Crossref
17. Wang K, Asinger RW, Marriott HJ. ST-segment elevation in conditions other than acute myocardial infarction. N Engl J Med 2003;349:2128-35. Crossref
18. Writing Committee; Kontos MC, de Lemos JA, et al. 2022 ACC Expert Consensus Decision Pathway on the evaluation and disposition of acute chest pain in the emergency department: a report of the American College of Cardiology Solution Set Oversight Committee. J Am Coll Cardiol 2022;80:1925-60. Crossref
19. Wilde AA, Antzelevitch C, Borggrefe M, et al. Proposed diagnostic criteria for the Brugada syndrome: consensus report. Circulation 2002;106:2514-9. Crossref
20. Patton KK, Ellinor PT, Ezekowitz M, et al. Electrocardiographic early repolarization: a scientific statement from the American Heart Association. Circulation 2016;133:1520-9. Crossref
21. Armstrong EJ, Kulkarni AR, Bhave PD, et al. Electrocardiographic criteria for ST-elevation myocardial infarction in patients with left ventricular hypertrophy. Am J Cardiol 2012;110:977-83. Crossref
22. Bischof JE, Worrall C, Thompson P, Marti D, Smith SW. ST depression in lead aVL differentiates inferior ST-elevation myocardial infarction from pericarditis. Am J Emerg Med 2016;34:149-54. Crossref
23. Mond HG, Haqqani HM. The electrocardiographic footprints of ventricular ectopy. Heart Lung Circ 2020;29:988-99. Crossref
24. Ting HH, Krumholz HM, Bradley EH, et al. Implementation and integration of prehospital ECGs into systems of care for acute coronary syndrome: a scientific statement from the American Heart Association Interdisciplinary Council on Quality of Care and Outcomes Research, Emergency Cardiovascular Care Committee, Council on Cardiovascular Nursing, and Council on Clinical Cardiology. Circulation 2008;118:1066-79. Crossref
25. Wilson RE, Kado HS, Percy RF, et al. An algorithm for identification of ST-elevation myocardial infarction patients by emergency medicine services. Am J Emerg Med 2013;31:1098-102. Crossref
26. Bhalla MC, Mencl F, Gist MA, Wilber S, Zalewski J. Prehospital electrocardiographic computer identification of ST-segment elevation myocardial infarction. Prehosp Emerg Care 2013;17:211-6. Crossref
27. Tanaka A, Matsuo K, Kikuchi M, et al. Systematic review and meta-analysis of diagnostic accuracy to identify ST-segment elevation myocardial infarction on interpretations of prehospital electrocardiograms. Circ Rep 2022;4:289-97. Crossref
28. Willems JL, Abreu-Lima C, Arnaud P, et al. The diagnostic performance of computer programs for the interpretation of electrocardiograms. N Engl J Med 1991;325:1767-73. Crossref
29. Macfarlane PW, Antzelevitch C, Haissaguerre M, et al. The early repolarization pattern: a consensus paper. J Am Coll Cardiol 2015;66:470-7. Crossref
30. Meyers HP, Bracey A, Lee D, et al. Comparison of the ST-elevation myocardial infarction (STEMI) vs. NSTEMI and occlusion MI (OMI) vs. NOMI paradigms of acute MI. J Emerg Med 2021;60:273-84. Crossref

Transurethral water vapour thermal therapy for benign prostatic hyperplasia under local anaesthesia alone: initial experience in Chinese patients

Hong Kong Med J 2024 Jun;30(3):227–32 | Epub 10 May 2024
© Hong Kong Academy of Medicine. CC BY-NC-ND 4.0
 
ORIGINAL ARTICLE
Transurethral water vapour thermal therapy for benign prostatic hyperplasia under local anaesthesia alone: initial experience in Chinese patients
KL Lo, MB, ChB, FRCSEd; Alex Mok, MB, ChB; Ivan CH Ko, MB, ChB; Steffi KK Yuen, MB, BS, FRCSEd; Peter KF Chiu, MB, BS, FRCSEd; CF Ng, MD, FRCSEd
SH Ho Urology Centre, Department of Surgery, The Chinese University of Hong Kong, Hong Kong SAR, China
 
Corresponding author: Prof CF Ng (ngcf@surgery.cuhk.edu.hk)
 
 Full paper in PDF
 
Abstract
Introduction: This study evaluated the perioperative and early postoperative outcomes of transurethral water vapour thermal therapy (WVTT) under local anaesthesia alone for benign prostatic enlargement in Chinese patients.
 
Methods: This retrospective review of transurethral WVTT for benign prostatic enlargement focused on 50 Chinese patients who exhibited clinical indications (acute retention of urine or symptomatic lower urinary tract symptoms due to benign prostatic enlargement) for surgical treatment between June 2020 and December 2021 in Hong Kong. Exclusion criteria included active urinary tract problems and urological malignancies. Follow-up was conducted at 3 months postoperatively.
 
Results: The median patient age was 71.5 years. The mean preoperative prostatic volume was 56.7 mL. The mean operation time was 25.1 minutes. All procedures were performed under local anaesthesia alone. The mean pain scores for transrectal ultrasound probe insertion, transperineal local anaesthesia injection, and transurethral WVTT were 2, 5, and 4, respectively. Forty-nine patients (98%) were discharged on the same day with a urethral catheter. Forty-eight patients (96%) successfully completed a trial without catheter within 3 weeks postoperatively. Five patients (10%) had unplanned hospital admission within 30 days postoperatively due to surgical complications (Clavien–Dindo grade 1).
 
Conclusion: Transurethral WVTT, an advanced surgical treatment for benign prostatic enlargement, is a safe procedure that relieves lower urinary tract symptoms with minimal hospital stay. It can be performed in an office-based setting under local anaesthesia, maximising utilisation of the surgical theatre.
 
 
New knowledge added by this study
  • This is the first study concerning the efficacy and safety profile of water vapour thermal therapy (WVTT) in Asian patients. It can relieve lower urinary tract symptoms with minimal hospital stay.
  • This is the first study of WVTT in an office-based setting under local anaesthesia, maximising utilisation of the surgical theatre.
Implications for clinical practice or policy
  • Water vapour thermal therapy is an effective and safe alternative for patients who have high surgical risk of benign prostatic enlargement under general or spinal anaesthesia.
 
 
Introduction
Benign prostatic hyperplasia (BPH) is characterised by a non-malignant growth in the prostate gland that can cause a wide range of lower urinary tract symptoms (LUTS). These symptoms can greatly reduce a patient’s quality of life (QoL) and may eventually lead to acute retention of urine (AROU).
 
Current standard treatments for BPH include conservative, pharmacological, and surgical approaches. For patients who fail to successfully complete a trial without catheter (TWOC) after AROU secondary to BPH, surgical intervention remains the main therapeutic approach. Surgical treatment options for BPH have evolved from electrosurgical resection to enucleation, ablation of the prostate, and other techniques.1 Transurethral resection of the prostate (TURP), first performed over 90 years ago, continues to be regarded as the gold standard for the treatment of BPH with prostatic volumes of 30 to 80 mL.2 Although TURP results in statistically significant improvements in symptom scores and maximum urinary flow rate (Qmax), it has some limitations. Perioperative morbidities and complications of TURP include infection, bleeding, urinary retention, incontinence, urethral stricture, erectile dysfunction, and ejaculatory dysfunction. Additionally, TURP requires general or spinal anaesthesia and postoperative hospitalisation. Through technological advancements, several minimally invasive procedures (eg, UroLift and prostatic artery embolisation) have been developed for specific groups of patients with BPH to minimise the aforementioned limitations.3 4 5 Among these new-generation BPH surgical approaches, transurethral water vapour thermal therapy (WVTT) provides some of the best surgical outcomes.
 
Transurethral WVTT uses the thermodynamic principle of convective energy transfer, whereas other techniques (eg, transurethral microwave thermotherapy or transurethral needle ablation of the prostate) involve conductive heat transfer.6 The thermal therapy system consists of a generator with a radiofrequency power supply that creates water vapour from sterile water, as well as a disposable transurethral delivery device. The tip of the delivery device contains an 18-gauge needle with 12 small emitter holes circumferentially arranged for water vapour dispersion into the targeted prostatic tissue. The release of thermal energy causes tissue necrosis. The most important characteristic of this technique is that, during treatment of the transitional zone, energy is only deposited within this specific region of the prostate. Reviews of histological evidence and magnetic resonance images have revealed that thermal lesions are limited to the transitional zone without affecting the peripheral zone, bladder, rectum, or striated urinary sphincter.7 8 At 6 months after treatment, the total prostatic volume is reduced by 28.9% and the resolution of thermal lesions, as determined by gadolinium-enhanced magnetic resonance imaging, is almost complete.8
 
A pilot study showed that transurethral WVTT can serve as a safe and effective treatment in men with LUTS due to BPH.8 In the first multicentre, randomised controlled study, 197 men were enrolled and randomised in a 2:1 ratio to treatment with the transurethral WVTT or a sham procedure.9 The sham procedure consisted of rigid cystoscopy with sound effects that mimicked the thermal treatment. The primary efficacy endpoint was met at 3 months: relief of symptoms, measured as a change in International Prostate Symptom Score (IPSS), was detected in 50% of patients in the thermal treatment group compared with 20% of patients in the sham procedure group (P<0.0001). In the thermal treatment group, the Qmax increased by 63%—from 9.9 mL/s to 16.1 mL/s (P<0.0001)—after 3 months. This clinical benefit was sustained throughout the study period, with a 54% improvement at the 12-month follow-up. In the most recent update regarding 5-year outcomes, the improvement in voiding (as measured by IPSS and uroflowmetry) had persisted for 5 years, with a surgical retreatment rate of 4.4%.10
 
Thus far, studies of transurethral WVTT for BPH have mainly focused on Caucasian populations. To provide information regarding its tolerability and effectiveness in the Chinese population, this study investigated the safety profile and efficacy of transurethral WVTT under local anaesthesia alone for BPH among Chinese patients in Hong Kong.
 
Methods
Study protocol
This retrospective study investigated transurethral WVTT for benign prostatic enlargement. The inclusion criteria included Chinese ethnicity and clinical indications for surgical treatment, including AROU or symptomatic LUTS due to benign prostatic enlargement. Exclusion criteria included active urinary tract problems such as infection, bleeding disorder, bladder pathologies (eg, bladder stones and neurogenic bladder), and urethral stricture, as well as urological malignancies including bladder and prostate cancer.
 
Intervention
The procedure was performed with perioperative antibiotic prophylaxis. Patients were placed in the dorsal lithotomy position. After local anaesthesia, cystoscopy was performed to assess the anatomy of the bladder and prostate. A specialised handpiece with an optical lens was inserted under direct visual guidance into the prostate channel. Treatment began with the needle tip visually positioned and inserted approximately 1 cm distal to the bladder neck. Each treatment lasted for 9 seconds. After 9 seconds, an audible signal was produced by the system and the treatment needle was retracted. The handpiece was then repositioned 1 cm distal to the previous treatment site; repositioning was repeated until reaching a treatment site immediately proximal to the verumontanum. During each water vapour injection, the majority of the targeted tissue was treated. All treatment cycles involving one lateral lobe were completed as a group to utilise residual heat from prior treatments involving that lobe. Subsequently, the contralateral lateral lobe was treated in a similar manner. An enlarged median lobe could be treated by positioning the needle at a 45-degree angle towards the targeted lobe using the same technique. After the procedure, a 14-Fr Foley catheter was inserted. A 1-week course of antibiotic treatment was administered after surgery.10 Patients were discharged with the urethral catheter and readmitted for a TWOC at approximately 1 to 2 weeks after surgery. Upon satisfactory completion of the TWOC, patients were scheduled for follow-up at 3 months postoperatively.
 
Statistical analysis
Preoperative parameters and perioperative outcomes were collected and tabulated using SPSS software (Windows version 28.0; IBM Corp, Armonk [NY], United States). Descriptive statistics were used to summarise the demographic data and perioperative patient characteristics. Paired sample t tests were used to compare continuous variables with normal distributions; the Mann-Whitney U test was used to compare continuous variables with skewed distributions, and the Chi squared test was used to compare categorical variables. Two-sided P values of <0.05 were considered statistically significant.
 
Results
Demographics
Between June 2020 and December 2021, 50 eligible patients were included in this study. The median age was 71.5 years (interquartile range [IQR]=64-75.25). In terms of indications, 27 patients (54%) had symptomatic BPH, 13 patients (26%) had AROU with a urethral catheter, and 10 patients (20%) had AROU without a urethral catheter. Of the 50 patients, 39 (78%) were categorised as American Society of Anesthesiologists class 2, whereas the remaining 11 were categorised as class 3. Most patients (68%) did not use any antiplatelet or anticoagulant therapy. The numbers of patients using aspirin, clopidogrel, dual antiplatelet therapy, and apixaban were 11 (22%), three (6%), one (2%), and one (2%), respectively. All antiplatelet and anticoagulant agents were temporarily discontinued before the operation (Table 1).
 

Table 1. Use of antiplatelet or anticoagulant therapy (n=50)
 
Operation
The mean preoperative prostatic volume was 56.7 mL (standard deviation [SD]=24.6; range, 29.2-119.0). The mean operation time was 25.1 minutes (SD=8.4). All procedures were conducted under local anaesthesia alone. Lignocaine 1% with adrenaline was injected into the periprostatic space using a transperineal approach. The mean pain scores for transrectal ultrasound probe insertion, transperineal local anaesthesia injection, and transurethral WVTT were 2, 5, and 4, respectively.
 
Postoperative course
Only one patient (2%) required bladder irrigation for 5 days postoperatively; that patient had been taking apixaban before surgery. All other patients were discharged on the same day with a urethral catheter. A TWOC was planned at around 1 week (for the AROU without urethral catheter or symptomatic BPH group) to 2 weeks (for the AROU with urethral catheter group) after surgery. Forty-eight patients (96%) in our study successfully completed a TWOC within 3 weeks postoperatively; the median time was 7 days (IQR=7-14). The median successful TWOC times were 14 days (IQR=8-21) for the AROU with urethral catheter group and 7 days (IQR=7-12) for the AROU without urethral catheter or symptomatic BPH group. Two patients (4%) with an initially unsuccessful TWOC began temporary clean intermittent self-catheterisation; they were subsequently weaned from this management approach on postoperative days 40 and 45, respectively.
 
Five patients (10%) had unplanned hospital admission within 30 days postoperatively due to surgical complications (Clavien–Dindo grade 1). The reasons for readmission are listed in Table 2.
 

Table 2. Reasons for readmission (n=50)
 
There were significant differences in preoperative and 3-month postoperative parameters, including prostate-specific antigen level, post-void residual urine (PVRU) level, Qmax, IPSS, and QoL assessment. Table 3 shows the medians and IQRs of these data. As indicated in Table 4, the mean differences in PVRU, Qmax, IPSS, and QoL score were -41 mL (SD=107), +6.6 mL/s (SD=5.4), -10.9 points (SD=5.8), and -2.2 points (SD=1.5), respectively.
 

Table 3. Descriptive statistics of preoperative and postoperative parameters
 

Table 4. Mean differences of parameters 3 months after the procedure
 
No patients in this study exhibited de novo retrograde ejaculation or stress urinary incontinence at 3 months postoperatively. However, there were three reported cases (6%) of new-onset erectile dysfunction postoperatively. All three patients had temporary erectile dysfunction that resolved within 6 months postoperatively without requiring medication.
 
Discussion
Our study is the first to focus on the application of transurethral WVTT (Rezūm therapy) under local anaesthesia alone among Chinese men with BPH. Our results demonstrated clinically significant outcomes comparable to other treatments for BPH. Transurethral WVTT provided effective symptomatic improvement, as illustrated by a decrease in PVRU of 41 mL, an increase in Qmax of 6.6 mL/s, and a substantial decrease in IPSS of 10.9 at the 3-month follow-up (Table 4). These results were also comparable to outcomes in a recent international study of this therapy.10 The postoperative outcome was favourable, with a successful TWOC rate of 96% within 3 weeks postoperatively. Moreover, all patients with urethral catheters before surgery successfully completed a TWOC after transurethral WVTT. The median successful TWOC time was 7 days postoperatively. However, compared with data from other studies (4.1 to 5 days),11 12 our centre had a longer duration of catheterisation, which could be explained by our centre’s policy of scheduling a TWOC on postoperative days 7 and 14 for patients without and with a urethral catheter before surgery, respectively. Five patients were readmitted within 30 days after surgery due to haematuria, post-obstructive diuresis, recurrent AROU, and urinary tract infection with AROU (Table 2). All were uneventfully discharged without further readmission; none of them developed postoperative urinary incontinence. Three patients reported de novo erectile dysfunction, higher than the rate observed in the recent international study.10 However, the rate remained significantly lower than that associated with TURP.13 Considering the minimally invasive nature of this procedure, it could revolutionise future management of BPH.
 
The current management algorithm for BPH does not include transurethral WVTT as a first-line treatment due to the relative lack of evidence regarding its mid- to long-term efficacy and safety.2 However, it has considerable potential in the management of BPH because of unique advantages compared with TURP. Transurethral WVTT can be an office-based procedure with a short learning curve. If a surgeon completes 10 cases of transurethral WVTT under supervision, he/she will become independent from a surgical trainer. Because BPH is a particularly common urological disease and often requires surgical management,14 the minimally invasive nature of transurethral WVTT can help reduce the number of patients waiting for operations in overcrowded hospital facilities. The results of our study provide initial evidence that transurethral WVTT is well-tolerated among patients under local anaesthesia alone. We did not administer any sedation to the patients because they might move during the operation, resulting in a high risk of water vapour leakage. Such leakage would lead to inadequate treatment.
 
In Hong Kong, total health costs represent about 19% of the total government budget,15 and public in-patient health costs in 2021/2022 constituted 32% of total health costs.16 Operation time is one of the most important factors affecting in-patient costs. According to a meta-analysis by Mamoulakis et al17 in 2009, the mean operation time for TURP ranged from 39 to 79 minutes. In the present study, the mean operation time was 25.1 minutes. Thus far, no studies have directly assessed the cost-effectiveness of transurethral WVTT in the Chinese population. In the United States, a cost-effectiveness analysis of six therapies for BPH, published in 2018,18 showed that transurethral WVTT was more cost-effective than other minimally invasive therapies, such as combination medical treatment and UroLift. Moreover, McVary et al10 reported that the 5-year retreatment rate after transurethral WVTT was 4.4%, which was significantly lower than that after UroLift therapy (13.6%) reported by Roehrborn et al.5
 
Notably, transurethral WVTT leads to lower incidences of bleeding, urgency, urge incontinence, and ejaculatory dysfunction compared with TURP.19 The more favourable side-effect profile has resulted in considerable interest concerning its potential to replace TURP as the first-line surgical treatment in the future. No head-to-head trials have compared other surgical modalities with transurethral WVTT. Indirect comparison through a meta-analysis revealed that TURP outperformed transurethral WVTT by providing greater relief of LUTS,19 although it carried a greater cost and higher complication rate.18 Although pharmacological treatment is currently the first-line treatment for moderate to severe LUTS, it is associated with complications such as dizziness, postural hypotension, reduced libido, and erectile dysfunction. Gupta et al20 compared standard medical therapy with transurethral WVTT using cohort data from the MTOPS trial (Medical Therapy of Prostatic Symptoms); they showed that transurethral WVTT had superior outcomes in terms of QoL, IPSS, and prostatic volume reduction. Considering these advantages, transurethral WVTT can be regarded as a first-line treatment option for patients with symptomatic LUTS who prefer a short operation, rather than lifelong pharmacological treatment.
 
Limitations
There were some limitations in this study. First, a substantial proportion of our patients had been catheterised preoperatively (74%) and thus could not undergo uroflowmetry studies before the operation. Due to the coronavirus disease 2019 pandemic and the associated community isolation policy, some other patients did not complete uroflowmetry studies. However, all IPSS data were able to be collected via telemedicine, ensuring the inclusion of those data in the analysis. Second, our study did not have a sufficient number of patients to allow subgroup analysis of patients with different indications for transurethral WVTT; future studies should explore treatment outcomes among patients with different indications for transurethral WVTT. Third, our inclusion period was prolonged, partly due to the coronavirus disease 2019 pandemic and partly because transurethral WVTT mainly was regarded as a self-financed item in our centre; these aspects led to some difficulty in accumulating a sufficient number of patients for analysis. Finally, this study used a single-arm design with a relatively short follow-up period; additional studies are needed to assess long-term treatment outcomes and retreatment rates after transurethral WVTT under local anaesthesia alone.
 
Conclusion
Transurethral WVTT is a safe and effective treatment for benign prostatic hyperplasia in the Chinese population. It can also be conducted in an office setting under local anaesthesia alone, avoiding use of the surgical theatre and its associated costs.
 
Author contributions
Concept or design: KL Lo, CF Ng.
Acquisition of data: KL Lo.
Analysis or interpretation of data: A Mok, ICH Ko.
Drafting of the manuscript: KL Lo, A Mok, ICH Ko.
Critical revision of the manuscript for important intellectual content: All authors.
 
All authors had full access to the data, contributed to the study, approved the final version for publication, and take responsibility for its accuracy and integrity.
 
Conflicts of interest
As an editor of the journal, CF Ng was not involved in the peer review process. Other authors have disclosed no conflicts of interest.
 
Funding/support
This research received no specific grant from any funding agency in the public, commercial, or not-for-profit sectors.
 
Ethics approval
This research was approved by the Joint Chinese University of Hong Kong–New Territories East Cluster Clinical Research Ethics Committee, Hong Kong (Ref No.: 2019.662). The patients were treated in accordance with the tenets of the Declaration of Helsinki and have provided written informed consent for all treatments and procedures and consent for publication.
 
References
1. Kahokehr A, Gilling PJ. Landmarks in BPH—from aetiology to medical and surgical management. Nat Rev Urol 2014;11:118-22. Crossref
2. Gravas S, Cornu JN, Gacci M, et al. EAU guidelines on management of non-neurogenic male lower urinary tract symptoms (LUTS), incl. benign prostatic obstruction (BPO). 2022. Available from: https://d56bochluxqnz.cloudfront.net/documents/full-guideline/EAU-Guidelines-on-Non-Neurogenic-Male-LUTS-2022.pdf. Accessed 8 May 2024.
3. Teoh JY, Chiu PK, Yee CH, et al. Prostatic artery embolization in treating benign prostatic hyperplasia: a systematic review. Int Urol Nephrol 2017;49:197-203. Crossref
4. Abt D, Hechelhammer L, Müllhaupt G, et al. Comparison of prostatic artery embolisation (PAE) versus transurethral resection of the prostate (TURP) for benign prostatic hyperplasia: randomised, open label, non-inferiority trial. BMJ 2018;361:k2338. Crossref
5. Roehrborn CG, Barkin J, Gange SN, et al. Five-year results of the prospective randomized controlled prostatic urethral L.I.F.T. study. Can J Urol 2017;24:8802-13.
6. Magistro G, Chapple CR, Elhilali M, et al. Emerging minimally invasive treatment options for male lower urinary tract symptoms. Eur Urol 2017;72:986-97. Crossref
7. Dixon CM, Rijo Cedano E, Mynderse LA, Larson TR. Transurethral convective water vapor as a treatment for lower urinary tract symptomatology due to benign prostatic hyperplasia using the Rezūm(®) system: evaluation of acute ablative capabilities in the human prostate. Res Rep Urol 2015;7:13-8. Crossref
8. Mynderse LA, Hanson D, Robb RA, et al. Rezūm system water vapor treatment for lower urinary tract symptoms/benign prostatic hyperplasia: validation of convective thermal energy transfer and characterization with magnetic resonance imaging and 3-dimensional renderings. Urology 2015;86:122-7. Crossref
9. McVary KT, Gange SN, Gittelman MC, et al. Minimally invasive prostate convective water vapor energy ablation: a multicenter, randomized, controlled study for the treatment of lower urinary tract symptoms secondary to benign prostatic hyperplasia. J Urol 2016;195:1529-38. Crossref
10. McVary KT, Gittelman MC, Goldberg KA, et al. Final 5-year outcomes of the multicenter randomized sham-controlled trial of a water vapor thermal therapy for treatment of moderate to severe lower urinary tract symptoms secondary to benign prostatic hyperplasia. J Urol 2021;206:715-24. Crossref
11. Dixon CM, Cedano ER, Pacik D, et al. Two-year results after convective radiofrequency water vapor thermal therapy of symptomatic benign prostatic hyperplasia. Res Rep Urol 2016;8:207-16. Crossref
12. Rowaiee R, Akhras A, Lakshmanan J, Sikafi Z, Janahi F. Rezum therapy for benign prostatic hyperplasia: Dubai’s initial experience. Cureus 2021;13:e18083. Crossref
13. Pavone C, Abbadessa D, Scaduto G, et al. Sexual dysfunctions after transurethral resection of the prostate (TURP): evidence from a retrospective study on 264 patients. Arch Ital Urol Androl 2015;87:8-13. Crossref
14. Lee YJ, Lee JW, Park J, et al. Nationwide incidence and treatment pattern of benign prostatic hyperplasia in Korea. Investig Clin Urol 2016;57:424-30. Crossref
15. Hong Kong SAR Government. The 2023-24 Budget. Budget speech. Available from: https://www.budget.gov.hk/2023/eng/budget30.html. Accessed 5 May 2024.
16. Health Bureau, Hong Kong SAR Government. Hong Kong’s domestic health accounts (DHA) 2021/22. Available from: https://www.healthbureau.gov.hk/statistics/en/dha.htm. Accessed 5 May 2024.
17. Mamoulakis C, Ubbink DT, de la Rosette JJ. Bipolar versus monopolar transurethral resection of the prostate: a systematic review and meta-analysis of randomized controlled trials. Eur Urol 2009;56:798-809. Crossref
18. Ulchaker JC, Martinson MS. Cost-effectiveness analysis of six therapies for the treatment of lower urinary tract symptoms due to benign prostatic hyperplasia. Clinicoecon Outcomes Res 2018;10:29-43. Crossref
19. Tanneru K, Jazayeri SB, Alam MU, et al. An indirect comparison of newer minimally invasive treatments for benign prostatic hyperplasia: a network meta-analysis model. J Endourol 2021;35:409-16. Crossref
20. Gupta N, Rogers T, Holland B, Helo S, Dynda D, McVary KT. Three-year treatment outcomes of water vapor thermal therapy compared to doxazosin, finasteride and combination drug therapy in men with benign prostatic hyperplasia: cohort data from the MTOPS trial. J Urol 2018;200:405-13. Crossref

Amniotic fluid gamma-glutamyl transferase for prediction of biliary atresia in cases of non-visualisation of the fetal gallbladder: a retrospective study using a validated analytical platform and local reference range

Hong Kong Med J 2024 Jun;30(3):218–26 | Epub 5 Jun 2024
© Hong Kong Academy of Medicine. CC BY-NC-ND 4.0
 
ORIGINAL ARTICLE
Amniotic fluid gamma-glutamyl transferase for prediction of biliary atresia in cases of non-visualisation of the fetal gallbladder: a retrospective study using a validated analytical platform and local reference range
Tommy YT Cheung, MB, ChB1,2; Natalie KL Wong, MB, ChB, MRCOG3; Daljit Singh Sahota, PhD3; Shreenidhi Ranganatha Subramaniam, MB, ChB1; SL Lau, MB, ChB, MRCOG3; X Zhu, MB, BS, PhD3; WT Lui, MPhil3; Edwin KW Chan, FHKAM (Surgery), FRCSEd (Paed)4; Yvonne KY Kwok, PhD3; KW Choy, PhD3; TY Leung, MD, FRCOG3; Michael HM Chan, FHKCPath, FHKAM (Pathology)5; Felix CK Wong, MB, BS, FRCPA5,6 #; YH Ting, FHKAM (Obstetrics and Gynaecology), FRCOG3 #
1 Department of Chemical Pathology, The Chinese University of Hong Kong, Hong Kong SAR, China
2 Department of Chemical Pathology, Princess Margaret Hospital, Hong Kong SAR, China
3 Department of Obstetrics and Gynaecology, The Chinese University of Hong Kong, Hong Kong SAR, China
4 Division of Paediatric Surgery and Paediatric Urology, Department of Surgery, Prince of Wales Hospital, Hong Kong SAR, China
5 Department of Chemical Pathology, Prince of Wales Hospital, Hong Kong SAR, China
6 Division of Chemical Pathology, Department of Pathology, Queen Mary Hospital, Hong Kong SAR, China
# Equal contribution
 
Corresponding author: Dr YH Ting (tingyh@cuhk.edu.hk)
 
 Full paper in PDF
 
Abstract
Introduction: The level of amniotic fluid gamma-glutamyl transferase (AFGGT) may help identify biliary atresia (BA) in cases of non-visualisation of the fetal gallbladder (NVFGB). This study aimed to validate a serum/plasma matrix–based gamma-glutamyl transferase (GGT) assay for amniotic fluid (AF) samples, establish a local gestational age–specific AFGGT reference range, and evaluate the efficacy of AFGGT for predicting fetal BA in pregnancies with NVFGB using the constructed reference range.
 
Methods: The analytical performance of a serum/ plasma matrix–based GGT assay on AF samples was evaluated using a Cobas c502 analyser. Amniotic fluid gamma-glutamyl transferase levels in confirmed euploid singleton pregnancies (16+0 to 22+6 weeks of gestation) were determined using the same analyser to establish a local gestational age–specific reference range (the 2.5th to 97.5th percentiles). This local reference range was used to determine the positive predictive value (PPV) and negative predictive value (NPV) of AFGGT level <2.5th percentile for identifying fetal BA in euploid pregnancies with NVFGB.
 
Results: The serum/plasma matrix–based GGT assay was able to reliably and accurately determine GGT levels in AF samples. Using the constructed local gestational age–specific AFGGT reference range, the NPV and PPV of AFGGT level <2.5th percentile for predicting fetal BA in pregnancies with NVFGB were 100% and 25% (95% confidence interval=0, 53), respectively.
 
Conclusion: In pregnancies with NVFGB, AFGGT level ≥2.5th percentile likely excludes fetal BA. Although AFGGT level <2.5th percentile is not diagnostic of fetal BA, fetuses with AFGGT below this level should be referred for early postnatal investigation.
 
 
New knowledge added by this study
  • A serum/plasma matrix–based gamma-glutamyl transferase (GGT) assay reliably and accurately determines GGT levels in amniotic fluid samples.
  • Using amniotic fluid gamma-glutamyl transferase (AFGGT) level <2.5th percentile to identify biliary atresia (BA) in cases of non-visualisation of the fetal gallbladder (NVFGB), the negative and positive predictive values were 100% and 25%, respectively.
Implications for clinical practice or policy
  • A local gestational age–specific AFGGT reference range (the 2.5th to 97.5th percentiles) is available for clinical use.
  • In pregnancies with NVFGB, AFGGT level ≥2.5th percentile likely excludes fetal BA; although AFGGT level <2.5th percentile is not diagnostic of BA, it is an important indicator of the need for early postnatal investigation.
 
 
Introduction
Non-visualisation of the fetal gallbladder (NVFGB) in the second trimester is a rare condition affecting 0.1% of pregnancies.1 It might be a transient finding—the gallbladder is visible later in pregnancy or after birth in 70% of cases.2 Persistent NVFGB may be associated with benign conditions (eg, gallbladder agenesis); it may also be a manifestation of serious disorders, such as biliary atresia (BA), cystic fibrosis, or chromosomal abnormalities.3 Although chromosomal abnormalities and cystic fibrosis can be identified prenatally via chromosomal microarray (CMA) and sequencing of the cystic fibrosis transmembrane conductance regulator gene, respectively, it remains challenging to diagnose BA before birth because no diagnostic prenatal test is currently available. Biliary atresia is a devastating condition and is the leading indication for liver transplantation in childhood.4 Prenatal suspicion of BA allows prompt postnatal assessment and early diagnosis, permitting timely intervention via Kasai hepatoportoenterostomy and resulting in improved outcomes.4
 
The measurement of gamma-glutamyl transferase (GGT) in amniotic fluid (AF) has been suggested as a method for prenatal detection of BA. This transferase is secreted by the fetal biliary tract, passes into the intestines, and is ultimately excreted into the amniotic cavity. It becomes detectable in AF at around 14 weeks of gestation upon maturation of the intestinal villi and opening of the cloacal membrane.5 6 7 Biliary tract obstructions, such as BA, hinder the passage of GGT into the intestines and AF, leading to reduced levels of amniotic fluid gamma-glutamyl transferase (AFGGT). Muller et al5 first reported extremely low AFGGT levels in three fetuses with extrahepatic bile duct obstruction at 18 to 19 weeks of gestation; they concluded that a low AFGGT level could be a useful indicator of BA. Subsequently, Burc et al,6 Dreux et al,8 and Bardin et al9 reported similar findings. Nevertheless, existing platforms for analysis of GGT in serum or plasma samples have not been thoroughly validated for use with AF samples. Furthermore, an appropriate reference range, essential for the interpretation of AFGGT results, is difficult to establish due to the limited availability of AF samples from normal pregnancies. Thus, publications regarding gestational age–specific reference ranges for AFGGT have been scarce.
 
Burc et al6 established reference values for five AF enzymes (AFEs), including GGT, using the Hitachi 911 analyser (Roche Diagnostics). Despite a large sample size of 508, no separate reference range was constructed for each gestational age from 20 to 24 weeks, limiting clinical use of the findings.6 Bardin et al7 established another reference range for AFGGT, from 16 to 22 weeks, using the Integra 800 analyser (Roche). However, the numbers of samples at weeks 16, 21, and 22 were small and had relatively large standard deviations, precluding clinical application.7 Both reference ranges were derived from Caucasian populations. Because the GGT level in adult blood varies according to ethnicity,10 it is likely that AFGGT levels also vary according to ethnicity; thus, there is a need to establish a local AFGGT reference range. Furthermore, both previous reference ranges covered the 5th to 95th percentiles. A wider reference range, from the 2.5th to 97.5th percentiles, would allow greater flexibility in selecting cut-off values for clinical application.
 
In this study, we aimed to validate a serum/plasma matrix–based GGT assay for AF samples, establish a local gestational age–specific reference range for AFGGT (from the 2.5th to 97.5th percentiles), and evaluate the efficacy of AFGGT for predicting fetal BA in pregnancies with NVFGB using the constructed reference range.
 
Methods
This retrospective study used archived AF supernatant obtained from amniocentesis procedures that had been conducted to exclude fetal chromosomal abnormalities between January 2012 and December 2021. All amniocenteses were performed under ultrasound guidance with aseptic technique by fetal-maternal medicine specialists who also performed detailed ultrasound examinations to document the presence or absence of fetal structural abnormalities. All AF samples were centrifuged at 100 g for 10 minutes; 1 mL of the resulting supernatant was stored at -80℃ in plain aliquots without additives (Axygen; BioGene, Union City [CA], United States), whereas the pellet was used for either CMA and/or karyotyping by G-banding analysis. The cytogenetic laboratory information system recorded the ultrasound findings, indication for amniocentesis, gestational age at amniocentesis, and CMA and/or karyotype results. Pregnancy and fetal outcomes, including the presence of any abnormalities at birth or autopsy findings, were recorded in each patient’s electronic records.
 
Patients
Archived AF samples with known fetal and pregnancy outcomes, taken at 16+0 to 22+6 weeks of gestation from singleton pregnancies with a euploid fetus (confirmed by CMA or karyotype) during the period from January 2018 to December 2020, were retrieved to establish a gestational age–specific reference range for GGT. Pregnancies with fetal chromosomal, gastrointestinal, or hepatobiliary anomalies (particularly BA) polyhydramnios, or oligohydramnios were excluded to eliminate potential confounding effects of these conditions.
 
Non-visualisation of the fetal gallbladder was incidentally detected during fetal morphology scans in pregnancies with risk factors for fetal abnormalities because the fetal gallbladder was not assessed in low-risk routine anomaly scans, in accordance with the International Society of Ultrasound in Obstetrics and Gynecology guideline.11 It was defined as failure to visualise the fetal gallbladder on two targeted ultrasound examinations performed 1 week apart. Isolated NVFGB was defined as NVFGB in the absence of other abnormal ultrasound findings. Pregnant women were counselled regarding possible differential diagnoses and offered amniocentesis for chromosomal analysis, as well as repeated ultrasound scans until the fetal gallbladder was visible. After birth, babies with persistent NVFGB were referred to paediatricians for hepatobiliary ultrasound and liver function tests. If the gallbladder was visible during prenatal scans, paediatricians did not order further tests in the absence of clinical suspicion. We followed the progress of all babies until the time of writing, using electronic hospital records for those delivered in public hospitals and phone calls for those delivered in private hospitals. With parental consent, post-mortem examinations were arranged in pregnancies terminated for serious associated fetal abnormalities.
 
Validation and analytical performance evaluation
Amniotic fluid samples were removed from -80℃ storage in batches, thawed, and equilibrated to room temperature immediately prior to analysis. Gamma-glutamyl transferase levels were determined using an International Federation of Clinical Chemistry and Laboratory Medicine–standardised L-gamma-glutamyl-3-carboxy-4-nitroanilide (GGCNA) enzymatic colorimetric assay on a Cobas c502 analyser (Roche, Basel, Switzerland). Internal quality controls were performed before and after each batch.
 
Details of the AFGGT assay validation and analytical performance, including matrix effects; linearity; intra- and inter-run precision at various GGT levels; interference due to haemolysis, icterus, and lipaemia; and sample stability, are summarised in online supplementary Appendix 1.
 
Establishment of reference range
An AFGGT reference range was developed using the Generalised Additive Models for Location (μ), Scale (υ) and Shape (σ) [GAMLSS] package in R statistical software (version 3.3.2; R Foundation for Statistical Computing, Vienna, Austria). All GGT values were transformed to their natural log equivalent before model construction; the final model balanced between percentile smoothness, goodness-of-fit, and simplicity. Model fit was assessed using the generalised Akaike information criterion and by inspection of residuals with quantile-quantile plots for all measurements, detrending of quantile-quantile plots, and comparison of empirical percentiles to fitted percentiles. Empirical percentiles were determined for comparative purposes by grouping GGT levels according to gestational age (in weeks).
 
The final model was used to determine reference values for the 2.5th, 5th, 50th, 95th (z = ± 1.645), and 97.5th percentiles (z = ± 1.964). Percentiles were determined using the expression μ × (1 + zpυσ)1/υ, where zp is the percentile of interest and μ, υ, and σ are dependent on the time covariate, gestational age. The GGT reference range was constructed using R statistical software and Microsoft Excel (Microsoft Corporation, Redmond [WA], United States).
 
We estimated a priori that 293 AFGGT measurements were needed to achieve a standard error of 10% of the gestational age–specific standard deviation for the 2.5th and 97.5th (z=1.96) reference percentiles, assuming that the standard error of the percentile of interest is expressed as a multiple of standard deviation using the formula , where each gestational age between 16+0 and 22+6 weeks has a minimum of 42 measurements.
 
Performance evaluation
Measured levels of AFGGT in pregnancies with NVFGB were transformed to their gestational age–specific percentile values using the final model. We then determined the positive predictive value (PPV) and negative predictive value (NPV) of AFGGT level <2.5th percentile for identifying BA in euploid pregnancies with NVFGB.
 
Results
Validation and analytical performance
The performance of the GGT assay using AF is summarised in online supplementary Appendix 2. Validation studies indicated that the GGCNA enzymatic colorimetric assay for determination of GGT activity in AF had linearity, precision, recovery, interference profiles, and stability comparable to the values reported for measurement of GGT in plasma and serum samples. The verified analytical measurement range was 10 to 1200 U/L. No significant interference was observed in the presence of 0.25 g/dL haemoglobin, 103 μmol/L bilirubin, or 16.8 mmol/L triglyceride. The limits of haemolysis/icterus/lipaemia indices above which interference occurred were significantly higher than the degrees of those indices in all analysed samples.
 
Gestational age–specific reference range
A database search identified 518 stored amniotic samples (502 [97%] Chinese and 16 [3%] other Asian ethnicities) suitable for use in establishing a local gestational age–specific AFGGT reference range. The median number of samples per week was 65; there were 2 weeks with <42 samples (27 and 28 samples in the 16th and 19th week of gestation, respectively). The online supplementary Table lists the regressed values of AFGGT levels according to percentile for each week of gestation.
 
The simplest best-fit model indicated a linear relationship between natural log-transformed GGT and gestational age. Table 1 and the online supplementary Figure show the final smoothing equations for median, coefficient of variation, and skewness, along with gestational age–specific smoothed percentile curves and values of AFGGT for our local population. Residuals of the final model had a mean skewness of 0 and a variance of 1; they were almost mesokurtic, with kurtosis values close to 3.
 

Table 1. Smoothing equations determined by modelling for median, coefficient of variation, and skewness used to compute z-scores and percentiles of the natural logarithm of gestational age–specific gamma-glutamyl transferase level
 
Performance evaluation
The database search identified 32 pregnancies with NVFGB from 2012 to 2021, of which 18 had an available AF sample (four isolated NVFGB and 14 non-isolated NVFGB). There were no cases of cystic fibrosis. Nine cases were excluded from analysis, including five with chromosomal abnormalities, one with renal hypoplasia and oligohydramnios, one with hydrops and polyhydramnios, and two in which the biliary tract anatomy could not be identified. The nine remaining cases for analysis included four with isolated NVFGB and five with non-isolated NVFGB (Table 2). The median gestational age at amniocentesis was 21.0 weeks (interquartile range=20.7-22.1).
 

Table 2. Characteristics of the nine cases of non-visualisation of the fetal gallbladder included in the current study
 
The Figure depicts the AFGGT levels in the nine pregnancies for analysis compared with our local gestational age–specific AFGGT reference range. Four cases had AFGGT level <2.5th percentile, including one with BA (AFGGT level of 27 U/L at 20+3 weeks) and three with transient non-visualisation (AFGGT levels of 32, 68, and 37 U/L at 20+0, 20+6, and 22+2 weeks, respectively). Five had AFGGT level ≥2.5th percentile, including one with gallbladder agenesis and four with transient non-visualisation (Table 2). Using AFGGT level <2.5th percentile as the cut-off, the NPV and PPV for identifying fetal BA in pregnancies with NVFGB were 100% and 25% (95% confidence interval=0, 53), respectively (Table 3). Repeated analysis using AFGGT level <5th percentile or the reference ranges from Burc et al6 or Bardin et al7 yielded identical results.
 

Figure. Amniotic fluid gamma-glutamyl transferase (AFGGT) levels in cases with non-visualisation of the fetal gallbladder compared with the gestational age–specific AFGGT reference range
 

Table 3. Reported efficacies of amniotic fluid enzymes for the prediction of biliary atresia in cases of non-visualisation of the fetal gallbladder
 
Discussion
Biliary atresia is a rare congenital anomaly, with a prevalence of 1 in 15 000 to 20 000 live births among Caucasian populations.12 However, BA is more common in East Asians; the prevalence is 1 in 5000 to 7000 among Chinese populations.13 14 Untreated BA is a progressive and devastating disease that can cause cirrhosis and death by 2 years of age.14 This outcome can be prevented by early intervention via palliative Kasai hepatoportoenterostomy, which is essential for re-establishing biliary drainage. If biliary drainage cannot be re-established, liver transplantation is necessary. Indeed, BA is the most common indication for liver transplantation in children, contributing to 75% of transplantations in children before 2 years of age.12 It is therefore imperative to diagnose BA early, preferably during the prenatal period. Nevertheless, prenatal diagnosis of BA is challenging because ultrasound cannot directly examine the patency of fetal bile ducts. When NVFGB is associated with a hepatic hilar cyst or heterotaxy, it is highly suggestive of BA.15 Non-visualisation of the fetal gallbladder with a hepatic hilar cyst is an indicator of cystic BA, a rare subtype representing 5% to 10% of BA cases16; therefore, this prenatal combination is uncommon. Heterotaxy is another rare condition with a prevalence of 1 in 10 000 live births,17 and concurrent BA is present in only 10.4% of left atrial isomerism cases18; therefore, this prenatal combination is even less common. Consequently, NVFGB may be the only prenatal sign indicating the possibility of BA. However, in cases of isolated NVFGB, it is difficult to differentiate between BA and gallbladder agenesis. The discovery of the association between low AFGGT levels and fetal BA has led to interest regarding the role of AFGGT in the management of NVFGB.
 
Validation and analytical performance
To our knowledge, this study is the first to validate the International Federation of Clinical Chemistry and Laboratory Medicine–standardised GGCNA enzymatic colorimetric assay on the Cobas c502 analyser, a common locally available plasma and serum analyser, for use with AF. We have demonstrated that accurate and precise measurements of GGT can be achieved with AF samples, enabling adoption in clinical settings. We have also established that the analytical measurement range is 10 to 1200 U/L. This is particularly important for an AFGGT assay because AFGGT levels in euploid pregnancies can vary across multiple orders of magnitude, whereas plasma GGT levels in healthy individuals usually remain below 100 U/L. This verification of the lower limit of quantification and linearity range improves confidence in our measurements. Furthermore, we have excluded potential interference, particularly from haemoglobin, because AF samples may sometimes contain maternal blood. We were initially concerned about GGT stability because some samples had been stored for several years; however, consistent with the World Health Organization report that GGT is stable for years in frozen serum and plasma samples,19 we found that AF stored frozen in plain bottles without additives at -20℃ or -80℃ remained stable for at least 6 months (online supplementary Appendix 1). This finding indicates that supernatants can be stored and subsequently retrieved for GGT assays, an important consideration if amniocentesis is performed in the early second trimester but an indication for AFGGT testing is identified during a mid-trimester morphology scan.
 
Gestational age–specific reference range
We have established a reference range for AFGGT levels at 16+0 to 22+6 weeks of gestation using a large local reference population of 518 samples (all Asian, 97% Chinese); this reference population is the largest compared with similar previous publications. The presence of an adequate sample size for each week of gestation allowed us to establish a reference range for each gestational age, thus overcoming the aforementioned limitations regarding clinical use of the two previous reference ranges.6 7 With respect to the two previous reference ranges, the 5th, 50th, and 95th percentiles in our study are similar to those reported by Bardin et al7 but higher at most gestational ages than those reported by Burc et al.6 The larger sample size in our study permitted the calculation of the 2.5th and 97.5th percentiles, such that a 95% central reference range could be established; this allows greater flexibility in selecting cut-off values for clinical application.
 
It has been reported that AFGGT levels are increased in oesophageal atresia and duodenal atresia, whereas they are decreased in anal atresia without fistula.20 21 Although duodenal atresia can easily be diagnosed prenatally by detection of the double bubble sign, this sign usually appears after 24 weeks of gestation.22 Prenatal diagnosis of oesophageal atresia relies on the indirect sign of non-visualisation of the stomach bubble and polyhydramnios; the sensitivities of these ultrasound findings range from 8.9% to 42%.20 Additionally, prenatal detection of anal atresia without fistula depends on the absence of the perianal muscular complex, but the anal sphincter does not fully mature until after 28 weeks of gestation.23 Further research regarding the use of AFGGT for early detection of these congenital gastrointestinal tract obstructions is valuable, and the availability of a local gestational age–specific reference range is crucial for supporting such research.
 
Performance evaluation
In the present study, the NPV and PPV of AFGGT level <2.5th percentile for identifying fetal BA in NVFGB were 100% and 25%, respectively (Table 3). Bardin et al9 assessed the efficacy of low AFGGT levels in predicting BA among cases of NVFGB between 17 and 22 weeks of gestation. Of the 26 cases with AFGGT level ≥5th percentile, none had BA; of the four cases with AFGGT level <5th percentile, three had BA. The corresponding NPV and PPV were 100% and 75%, respectively. The PPV in their study may have been higher because amniocentesis was performed before 22 weeks of gestation in all cases.9 In our cohort, after exclusion of the two cases in which amniocentesis was performed after 22 weeks of gestation, the PPV only marginally improved to 33.3%. Our figures are more consistent with those of Dreux et al,8 who analysed the efficacy of AFEs for predicting BA in NVFGB before and after 22 weeks of gestation. In that study, abnormal AFE was defined as GGT and/or intestinal alkaline phosphatase level <0.5 multiples of the median.8 Before 22 weeks of gestation, there were three cases of BA among seven cases with abnormal AFE and no cases of BA among 16 cases with normal AFE. The corresponding NPV and PPV were 100% and 43%, respectively. However, after 22 weeks of gestation, there was only one case of BA among six cases with abnormal AFE and four cases of BA among 56 cases with normal AFE. The corresponding NPV and PPV were 93% and 17%, respectively (Table 3). These findings confirmed the expected decrease in AFE efficacy for predicting BA after 22 weeks of gestation. By that gestational age, the passage of GGT from the intestine into the AF is impeded by mature anal sphincter muscles in normal fetuses; thus, the AFGGT level is very low after 22 weeks of gestation, and it is difficult to distinguish between a low level due to BA and a low level related to normal development.5 6 7
 
In our cohort, there were three fetuses without BA who had AFGGT level ≤2.5th percentile; one of these fetuses had an extremely low AFGGT level (Case 4) [Table 2]. In addition to its association with fetal BA, low AFGGT is linked to chromosomal abnormalities, cystic fibrosis, anal atresia without fistula, and polyhydramnios. However, none of the three fetuses had any of these conditions. Although one fetus (Case 2) [Table 2] had a small choledochal cyst which might have impeded biliary drainage and caused a mild decrease in AFGGT, we could not find a potential explanation for the low AFGGT levels in the other two fetuses.
 
Limitations
Limitations of our study include its retrospective nature and small cohort size. The incidence of NVFGB is low (0.1%).1 In the largest systematic review concerning the outcomes of NVFGB, encompassing seven studies, the total number of cases was 280; among 170 cases of isolated NVFGB, only six (3.5%) had BA.2 In Hong Kong, the fetal gallbladder is not routinely assessed in low-risk routine anomaly scans, in accordance with the International Society of Ultrasound in Obstetrics and Gynecology guideline.11 24 Among the 32 cases of NVFGB in our cohort, one (3.1%) had BA; this incidence is comparable to the findings in the aforementioned review. However, only 18 cases had an AF sample available for AFGGT testing; after the exclusion of cases with abnormalities that might affect the AFGGT level, we included nine cases in the analysis. Because there was only one case of BA in our cohort and 11 more were described in the literature (Table 3), clinical application of these research findings requires caution, as well as careful pre- and post-test counselling.
 
In addition to the one case of BA in this cohort, two additional cases of BA were not included in this study because prenatal ultrasound scans did not indicate NVFGB. The AFGGT levels in all three cases were <30 U/L and <2.5th percentile (27, 28, and 29 U/L at 20+3, 21+5, and 21+6 weeks, respectively), whereas the AFGGT levels in all samples used to establish our reference range were >30 U/L. Thus, an AFGGT level <30 U/L may be a useful absolute cut-off for the prediction of BA. Notably, all three cases of extrahepatic bile duct obstruction reported by Muller et al5 also had an AFGGT level <30 U/L (20 U/L for all three cases [<1st percentile]). Further research with a larger cohort is required to confirm the efficacy of using an AFGGT level <30 U/L as the absolute cut-off for predicting BA in NVFGB.
 
Conclusion
Based on the present findings and published literature, we conclude that AFGGT testing is useful for the exclusion of fetal BA in pregnancies with NVFGB. With a consistent NPV of 100% across all published series, AFGGT level ≥2.5th percentile can provide reassurance for parents that the fetus is unlikely to have BA. However, considering its PPV of 33.3% to 75% before 22 weeks of gestation and 17% to 43% after 22 weeks of gestation, AFGGT level <2.5th percentile cannot be considered diagnostic for BA. Instead, it serves as a warning sign, indicating the need for prompt postnatal investigation of possible BA. Because NVFGB is also associated with chromosomal abnormalities, amniocentesis is recommended; the advantages of detecting underlying chromosomal abnormalities by CMA and excluding BA through AFGGT testing likely outweigh the 0.3% risk of procedure-related miscarriage.25 Follow-up prenatal ultrasound scans to visualise the fetal gallbladder should be arranged. Paediatricians should also be alerted for prompt postnatal assessment to facilitate early detection of BA. Timely performance of the Kasai operation can reduce the need for liver transplantation in childhood and improve the rate of overall survival into adulthood to 90%.26 27
 
Author contributions
Concept or design: YH Ting, DS Sahota, FCK Wong, TYT Cheung.
Acquisition of data: TYT Cheung, SR Subramaniam, FCK Wong, MHM Chan, YH Ting, NKL Wong, SL Lau, X Zhu, WT Lui, EKW Chan, YKY Kwok, KW Choy, TY Leung.
Analysis or interpretation of data: TYT Cheung, DS Sahota, FCK Wong, YH Ting, NKL Wong.
Drafting of the manuscript: YH Ting, TYT Cheung, DS Sahota, NKL Wong, FCK Wong, SR Subramaniam.
Critical revision of the manuscript for important intellectual content: DS Sahota, YH Ting, TYT Cheung, FCK Wong, NKL Wong.
 
All authors had full access to the data, contributed to the study, approved the final version for publication, and take responsibility for its accuracy and integrity.
 
Conflicts of interest
All authors have disclosed no conflicts of interest.
 
Funding/support
This research received no specific grant from any funding agency in the public, commercial, or not-for-profit sectors.
 
Ethics approval
This research was approved by the Joint Chinese University of Hong Kong—New Territories East Cluster Clinical Research Ethics Committee, Hong Kong (Ref No.: CRE 2020.060). Informed consent for amniocentesis in the current study and storage and use of excess amniotic fluid in future research was obtained from the patients at the time of amniocentesis.
 
Supplementary material
The supplementary material was provided by the authors and some information may not have been peer reviewed. Accepted supplementary material will be published as submitted by the authors, without any editing or formatting. Any opinions or recommendations discussed are solely those of the authors and are not endorsed by the Hong Kong Academy of Medicine and the Hong Kong Medical Association. The Hong Kong Academy of Medicine and the Hong Kong Medical Association disclaim all liability and responsibility arising from any reliance placed on the content.
 
References
1. Blazer S, Zimmer EZ, Bronshtein M. Nonvisualization of the fetal gallbladder in early pregnancy: comparison with clinical outcome. Radiology 2002;224:379-82. Crossref
2. Di Pasquo E, Kuleva M, Rousseau A, et al. Outcome of non-visualization of fetal gallbladder on second-trimester ultrasound: cohort study and systematic review of literature. Ultrasound Obstet Gynecol 2019;54:582-8. Crossref
3. Ting YH, So PL, Cheung KW, Lo TK, Ma TW, Leung TY. Non-visualisation of fetal gallbladder in a Chinese cohort. Hong Kong Med J 2022;28:116-23. Crossref
4. Parolini F, Boroni G, Milianti S, et al. Biliary atresia: 20-40-year follow-up with native liver in an Italian centre. J Pediatr Surg 2019;54:1440-4. Crossref
5. Muller F, Gauthier F, Laurent J, Schmitt M, Boué J. Amniotic fluid GGT and congenital extrahepatic biliary damage. Lancet 1991;337:232-3. Crossref
6. Burc L, Guibourdenche J, Luton D, et al. Establishment of reference values of five amniotic fluid enzymes. Analytical performances of the Hitachi 911. Application to complicated pregnancies. Clin Biochem 2001;34:317-22. Crossref
7. Bardin R, Danon D, Tor R, Mashiach R, Vardimon D, Meizner I. Reference values for gamma-glutamyl-transferase in amniotic fluid in normal pregnancies. Prenat Diagn 2009;29:703-6. Crossref
8. Dreux S, Boughanim M, Lepinard C, et al. Relationship of non-visualization of the fetal gallbladder and amniotic fluid digestive enzymes analysis to outcome. Prenat Diagn 2012;32:423-6. Crossref
9. Bardin R, Ashwal E, Davidov B, Danon D, Shohat M, Meizner I. Nonvisualization of the fetal gallbladder: can levels of gamma-glutamyl transpeptidase in amniotic fluid predict fetal prognosis? Fetal Diagn Ther 2016;39:50-5. Crossref
10. Stewart SH, Connors GJ, Hutson A. Ethnicity and gamma-glutamyltransferase in men and women with alcohol use disorders. Alcohol Alcohol 2007;42:24-7. Crossref
11. Salomon LJ, Alfirevic Z, Berghella V, et al. Practice guidelines for performance of the routine mid-trimester fetal ultrasound scan. Ultrasound Obstet Gynecol 2011;37:116-26. Crossref
12. Hartley JL, Davenport M, Kelly DA. Biliary atresia. Lancet 2009;374:1704-13. Crossref
13. Hsiao CH, Chang MH, Chen HL, et al. Universal screening for biliary atresia using an infant stool color card in Taiwan. Hepatology 2008;47:1233-40. Crossref
14. Zhan J, Chen Y, Wong KK. How to evaluate diagnosis and management of biliary atresia in the era of liver transplantation in China. World J Paediatr Surg 2018;1:e000002. Crossref
15. Chalouhi GE, Muller F, Dreux S, Ville Y, Chardot C. Prenatal non-visualization of fetal gallbladder: beware of biliary atresia! Ultrasound Obstet Gynecol 2011;38:237-8. Crossref
16. Rahamtalla D, Al Rawahi Y, Jawa ZM, Wali Y. Cystic biliary atresia in a neonate with antenatally detected abdominal cyst. BMJ Case Rep 2022;15:e246081. Crossref
17. Lin AE, Ticho BS, Houde K, Westgate MN, Holmes LB. Heterotaxy: associated conditions and hospital-based prevalence in newborns. Genet Med 2000;2:157-72. Crossref
18. Gottschalk I, Stressig R, Ritgen J, et al. Extracardiac anomalies in prenatally diagnosed heterotaxy syndrome. Ultrasound Obstet Gynecol 2016;47:443-9. Crossref
19. Ehret W. Use of Anticoagulants in Diagnostic Laboratory Investigations. Geneva: World Health Organization; 1999.
20. Czerkiewicz I, Dreux S, Beckmezian A, et al. Biochemical amniotic fluid pattern for prenatal diagnosis of esophageal atresia. Pediatr Res 2011;70:199-202. Crossref
21. Muller C, Czerkiewicz I, Guimiot F, et al. Specific biochemical amniotic fluid pattern of fetal isolated esophageal atresia. Pediatr Res 2013;74:601-5. Crossref
22. The Fetal Medicine Foundation. Duodenal atresia. Available from: https://fetalmedicine.org/education/fetal-abnormalities/gastrointestinal-tract/duodenal-atresia. Accessed 19 Jan 2023.
23. Ochoa JH, Chiesa M, Vildoza RP, Wong AE, Sepulveda W. Evaluation of the perianal muscular complex in the prenatal diagnosis of anorectal atresia in a high-risk population. Ultrasound Obstet Gynecol 2012;39:521-7. Crossref
24. Chen M, Leung TY, Sahota DS, et al. Ultrasound screening for fetal structural abnormalities performed by trained midwives in the second trimester in a low-risk population—an appraisal. Acta Obstet Gynecol Scand 2009;88:713-9. Crossref
25. Salomon LJ, Sotiriadis A, Wulff CB, Odibo A, Akolekar R. Risk of miscarriage following amniocentesis or chorionic villus sampling: systematic review of literature and updated meta-analysis. Ultrasound Obstet Gynecol 2019;54:442-51. Crossref
26. Serinet MO, Wildhaber BE, Broué P, et al. Impact of age at Kasai operation on its results in late childhood and adolescence: a rational basis for biliary atresia screening. Pediatrics 2009;123:1280-6. Crossref
27. Davenport M. Biliary atresia: clinical aspects. Semin Pediatr Surg 2012;21:175-84. Crossref

Healthy Eating Report Card for Pre-school Children in Hong Kong

Hong Kong Med J 2024 Jun;30(3):209–17 | Epub 21 May 2024
© Hong Kong Academy of Medicine. CC BY-NC-ND 4.0
 
ORIGINAL ARTICLE
Healthy Eating Report Card for Pre-school Children in Hong Kong
Alison WL Wan, MSc; Kevin KH Chung, PhD; JB Li, MEd, PhD; Derwin KC Chan, MSc, PhD
Department of Early Childhood Education, The Education University of Hong Kong, Hong Kong SAR, China
 
Corresponding author: Dr Derwin KC Chan (derwin@eduhk.hk)
 
 Full paper in PDF
 
Abstract
Introduction: This study aimed to develop the Healthy Eating Report Card for Pre-school Children in Hong Kong for evaluating the prevalence of healthy eating behaviours and favourable family home food environments (FHFEs) among pre-school children in Hong Kong.
 
Methods: In this cross-sectional study, 538 parent-child dyads from eight kindergartens in Hong Kong were recruited. Parents or guardians completed a questionnaire comprising Report Card items. The Report Card included two indicators of Children’s Eating Behaviours (ie, Children’s Dietary Patterns and Children’s Mealtime Behaviours) and three indicators of FHFEs (ie, Parental Food Choices and Preparation, Avoidance of Unhealthy Foods, and Family Mealtime Environments). Each indicator and its specific items were assigned a letter grade representing the percentage of participants achieving the predefined benchmarks. The grades were defined as A (≥80%, Excellent); B (60%-79%, Good); C (40%-59%, Fair); D (20%-39%, Poor); and F (<20%, Very poor). Plus (+) and minus (-) signs were used to indicate the upper or lower 5% of each grade.
 
Results: Overall, Children’s Eating Behaviours were classified as Fair (average grade of ‘C’), whereas FHFEs were classified as Good (average grade of ‘B’). The sub-grades ranged from ‘C’ to ‘A-’, as follows: Children’s Dietary Patterns, ‘C+’; Children’s Mealtime Behaviours, ‘C’; Parental Food Choices and Preparation, ‘C+’; Avoidance of Unhealthy Foods, ‘B’; and Family Mealtime Environments, ‘A-’.
 
Conclusion: The findings highlight areas for improvement in healthy eating among children. The Healthy Eating Report Card could offer novel insights into intervention tools that promote healthy eating.
 
 
New knowledge added by this study
  • Eating behaviours among pre-school children in Hong Kong were classified as Fair (average grade of ‘C’).
  • Among those children, family home food environments (FHFEs) were classified as Good (average grade of ‘B’).
  • There is considerable potential for improvement in children’s dietary patterns, children’s mealtime behaviours, and parental food choices and preparation.
Implications for clinical practice or policy
  • The Healthy Eating Report Card for Pre-school Children can be considered a useful tool for evaluating the prevalence of healthy eating behaviours and favourable FHFEs among pre-school children.
  • The grades provided by the Report Card offer valuable guidance concerning how healthy eating behaviours and favourable FHFEs among pre-school children could be promoted at the family, school, and community levels.
 
 
Introduction
Unhealthy dietary patterns, generally characterised by low dietary diversity, skipping breakfast, low consumption of fruits and vegetables, and frequent consumption of energy-dense/nutrient-poor foods and sugar-sweetened beverages, are common among children worldwide.1 2 It is particularly important for young children to adopt healthy dietary patterns because eating habits and food preferences in childhood can influence dietary patterns in adulthood.3 Similar to children in other regions, Hong Kong children have a high prevalence of unhealthy dietary patterns.4 A cross-sectional survey evaluating infant and young child feeding practices in Hong Kong identified numerous dietary problems, including dietary imbalance (eg, high protein but low fibre intake), overdependence on the use of formula milk, inadequate intake of vegetables and fruits, and unhealthy snacking and sugary beverage habits.5 A previous study revealed a need for dietary improvement among Hong Kong pre-school children.6 Key recommendations included a balanced diet, better nutritional adequacy, and greater independence during mealtimes (ie, self-feeding).6 Indeed, inappropriate behaviours during mealtimes, such as lack of self-feeding, food refusal, picky eating, and prolonged meals, are common in young children.7 8 Children with inappropriate mealtime behaviours may be susceptible to insufficient nutrient and/or energy intake.9 However, there is limited information available regarding the mealtime behaviours of typically developing pre-school children in Hong Kong.
 
Family home food environments (FHFEs), ie, parental food choices and preparation, avoidance of unhealthy foods, and family mealtime environments, have strong associations with children’s dietary habits and body weight.10 11 12 Parental use of nutrition labels to make healthier food choices has been linked to a lower probability of overweight or obesity in their children.13 Similarly, children with limited access to unhealthy foods are reportedly more likely to maintain a normal body weight.14 A review focusing on the effects of family and social environment on children’s dietary patterns found that a structured mealtime environment—namely, regular meals with family members and screen-free mealtimes—was associated with healthy food consumption patterns in children.15 In summary, children’s mealtime behaviours and FHFEs are important for healthy eating among young children. Thus far, no studies have provided an overview of eating behaviours and FHFEs among pre-school children in Hong Kong.
 
The use of a report card at the country-/region-level can provide a valuable overview of the prevalence of health behaviours through a conventional letter grading system (ranging from A+ to F).16 This framework has been used to evaluate various health-related behaviours (eg, physical activity,17 18 19 sedentary behaviour,17 18 19 smoking behaviour,20 and dietary patterns20 21 22) in children and youth. The findings of such report cards offer insights concerning the extent to which health behaviours are adopted in specific communities and provide targeted recommendations for health behaviours at the individual or public level.16 23 Moreover, the publication of these report cards can facilitate health promotion awareness and catalyse policy changes that motivate individuals to commit to health behaviours.16 19 24 Thus far, only one published report card (the Healthy Active Kids South Africa [HAKSA] Report Card) has revealed dietary patterns among children and youth.21 However, the HAKSA Report Card only covered the intake of fruits, vegetables, and unhealthy snacks; other essential aspects of healthy eating (eg, daily breakfast consumption, dietary variety, mealtime behaviours, and FHFEs) were not considered. Additionally, because the evidence underlying the grading criteria for various aspects of healthy eating was not explicitly stated, the findings of the HAKSA Report Card might not provide useful benchmarks concerning how well individuals adhere to healthy eating standards or recommendations adopted by health authorities. Therefore, we aimed to address the aforementioned research gaps through a cross-sectional study that developed the Healthy Eating Report Card for Pre-school Children in Hong Kong, using a grading scale and evidence-based benchmarks to assess the current prevalence of healthy eating behaviours and favourable FHFEs among pre-school children in Hong Kong.
 
Our Report Card assesses various indicators of Children’s Eating Behaviours (ie, Children’s Dietary Patterns and Children’s Mealtime Behaviours) and FHFEs (ie, Parental Food Choices and Preparation, Avoidance of Unhealthy Foods, and Family Mealtime Environments). Each indicator and its specific items are assigned letter grades based on predefined benchmarks, revealing how well pre-school children in Hong Kong meet the recommendations and standards established by the government and published literature concerning pre-school children’s healthy eating behaviours and FHFEs (Tables 125 26 27 28 29 30 31 and 223). The findings may enhance the understanding of eating behaviours and FHFEs among pre-school children in Hong Kong. Additionally, the Healthy Eating Report Card established in our study will be useful for future studies examining healthy eating among young children in other countries or regions.
 
Methods
Participants
We recruited 538 Hong Kong parent-child dyads from eight local kindergartens in three main regions of Hong Kong (29.55% of children from the New Territories, 62.64% of children from Kowloon, and 7.81% of children from Hong Kong Island). The children were aged between 2 and 6 years with a mean age of 4.10 years (standard deviation=0.92); 49.63% of the children were boys. Of the children, 33.77%, 29.46%, and 36.77% were in grades K1, K2, and K3, respectively. Respondents were mainly mothers (85.63%), followed by fathers (13.25%) and other legal guardians (1.12%). The mean respondent age was 36.62 years (standard deviation=5.84).
 
Procedures
This cross-sectional study examined the prevalence of healthy eating behaviours and favourable FHFEs among Hong Kong pre-school children in October 2021. We sent invitation letters to 89 randomly selected local kindergartens across 18 districts in Hong Kong (excluding international schools and special needs schools). Eight kindergartens agreed to participate in this study and distribute our questionnaire to eligible parents. The inclusion criteria required participants to: (1) be Chinese parents or guardians; (2) have at least one child in grades K1 to K3; and (3) have sufficient Chinese reading ability to complete the questionnaire. Schools and parents were both asked to provide written informed consent. Parents completed a parent-reported questionnaire (comprising the Healthy Eating Report Card items) about their children’s eating behaviours and FHFEs, which typically required 15 minutes to complete. Respondents received a HK$50 supermarket voucher as a token of appreciation for their participation.
 
Report Card questionnaire
The design of our Healthy Eating Report Card was based on the conceptual framework established by the Report Card on Physical Activity for Children and Youth, which offers a comprehensive grading framework and benchmarks to evaluate health behaviours.16 17 18 19 20 21 22 23 The Global Matrix 3.0 Physical Activity Report Card for Children and Youth has been used in 49 countries to evaluate the prevalence of physical activity behaviours among children and youth.23 Using a similar assessment framework, our Healthy Eating Report Card evaluated the prevalence of healthy eating behaviours and favourable FHFEs among Hong Kong pre-school children. The Healthy Eating Report Card Questionnaire consisted of 21 items which were developed based on the healthy eating guidelines and recommendations of the Department of Health of Hong Kong.25 26 The items were aligned with the five indicators of our Report Card, including two Children’s Eating Behaviours indicators (ie, Children’s Dietary Patterns and Children’s Mealtime Behaviours) and three FHFEs indicators (ie, Parental Food Choices and Preparation, Avoidance of Unhealthy Foods, and Family Mealtime Environments), to determine whether the children adhered to healthy eating behaviours and were involved in healthy FHFEs. Participants responded to questionnaire items using a 5-point Likert scale (ranging from ‘always’ to ‘never’), yes/no questions, open-ended questions, and multiple-choice questions. The questionnaire is provided in online supplementary Appendix 1.
 
Data analysis
Benchmarks for each indicator were established in accordance with recommendations and guidelines for healthy eating behaviours and FHFEs from the Hong Kong SAR Government and published literature.25 26 27 28 29 30 31 Based on the results of the questionnaire, we used a benchmark framework to determine the letter grade for each indicator that reflected the percentage of participants who met the predetermined benchmarks. A sub-grade was also determined for each indicator item. The questionnaire items and criteria of questionnaire answers related to the benchmarks are displayed in online supplementary Appendix 2.25 26 28 29 30 31 The grading system for the Healthy Eating Report Card was derived from the grading rubric of the Global Matrix 3.0 Physical Activity Report Card for Children and Youth, ie, A (≥80%, Excellent); B (60%-79%, Good); C (40%-59%, Fair); D (20%-39%, Poor); and F (<20%, Very poor).23 Plus (+) and minus (-) signs were used to show the upper or lower 5% of each grade.23 The proposed benchmarks and the grading scheme are shown in Tables 125 26 27 28 29 30 31 and 2,23 respectively.
 

Table 1. Indicators and benchmarks in the Healthy Eating Report Card for Pre-school Children in Hong Kong
 

Table 2. Grading system of the Healthy Eating Report Card for Pre-school Children in Hong Kong
 
Due to the percentage calculation, responses to 5-point Likert scale questions in the questionnaire were converted to binary variables; responses of ‘sometimes’, ‘often’ and ‘always’ were categorised as ‘yes’, whereas responses of ‘never’ and ‘rarely’ were categorised as ‘no’.32 All statistical analyses were performed using SPSS software (Windows version 26.0; IBM Corp, Armonk [NY], United States). Missing values ranged from 0.19% to 2.79% for questionnaire items because of nonresponses to some items. The descriptive statistics revealed valid percentages for each indicator item, along with 95% confidence intervals (CIs). The arithmetic mean for each indicator was calculated by summing the valid percentage for each item of the indicator, then dividing that value by the number of corresponding items. This arithmetic mean represents the average percentage of participants who met predefined benchmarks for that indicator.
 
Results
The letter grades of our Healthy Eating Report Card are summarised in Table 3. The descriptive statistics of the Report Card are displayed in online supplementary Appendix 3. The average grades of Children’s Eating Behaviours indicators and FHFEs indicators were ‘C’ and ‘B’, respectively, showing that the eating behaviours of Hong Kong pre-school children were classified as Fair, whereas FHFEs were classified as Good (Table 3). On average, nearly half of the pre-school children (52.88%; 95% CI=51.26%-54.50%) adhered to healthy eating behaviours, whereas more than half of the parents (70.87%; 95% CI=69.34%-72.40%) provided their children with favourable FHFEs.
 

Table 3. Letter grades assigned to indicators and their items in the Healthy Eating Report Card for Pre-school Children in Hong Kong
 
Children’s Dietary Patterns
Nearly all children (97.58%) had three regular meals daily. However, only 24.34% of the children ate a variety of foods. Approximately half of the children had adequate vegetable and fruit intakes (50.84% and 58.40%, respectively). Moreover, 55.76% did not have a formula milk-drinking habit. Additionally, around half of the children had low consumption of unhealthy snacks and sugary beverages (52.25% and 58.87%, respectively) [online supplementary Appendix 3]. Overall, Children’s Dietary Patterns was graded ‘C+’ (Fair), signifying that approximately half of the children (55.37%; 95% CI=53.98%-56.75%) adhered to healthy dietary patterns.
 
Children’s Mealtime Behaviours
Fewer than half of the children (43.02%) did not require parental assistance to finish a meal. Only 38.32% of the children could remain seated during mealtimes. Of the children, 49.15% and 67.98% did not exhibit picky eating behaviours and were willing to try new foods, respectively. Nearly half of the children (49.35%) did not exhibit slow-eating behaviours (online supplementary Appendix 3). Children’s Mealtime Behaviours was graded ‘C’ (Fair), showing that approximately half of the children (49.92%; 95% CI=46.28%-55.07%) exhibited desirable mealtime behaviours.
 
Parental Food Choices and Preparation
More than half of the parents (63.69%) used nutrition labels. Similarly, more than half of the parents (70.26%) considered low oil/salt/sugar food options for their children. Approximately half of the parents used low-fat cooking methods and reduced the use of sugar- or salt-containing condiments (53.53% and 43.58%, respectively) [online supplementary Appendix 3]. Parental Food Choices and Preparation was graded ‘C+’ (Fair), revealing that approximately half of the parents (57.88%; 95% CI=55.49%-60.28%) made healthy food choices and prepared healthy meals for their children.
 
Avoidance of Unhealthy Foods
Half of the parents (52.04%) did not reward their children with unhealthy snacks or drinks. A large majority of the parents (90.15%) limited the frequency and quantity of unhealthy foods (online supplementary Appendix 3). Therefore, Avoidance of Unhealthy Foods was graded ‘B’ (Good), signifying that more than half of the parents (71.10%; 95% CI=68.66%-73.53%) controlled their children’s access to unhealthy foods.
 
Family Mealtime Environments
A large majority of the children dined with their parents or family members and ate the same food as other family members (93.47% and 95.50%, respectively). More than half of the parents (61.08%) did not allow their children to use screen devices during mealtimes (online supplementary Appendix 3). Family Mealtime Environments was graded ‘A-’ (Excellent), showing that most children (83.46%; 95% CI=81.63%-85.29%) were involved in structured family mealtime environments.
 
Discussion
This study aimed to develop the Healthy Eating Report Card for Pre-school Children in Hong Kong, which assessed the prevalence of healthy eating behaviours and favourable FHFEs among pre-school children in Hong Kong. We established evidence-based benchmarks to guide the process of grading Children’s Eating Behaviours indicators and FHFEs indicators, then utilised letter grades to illustrate how well children adhered to healthy eating behaviours. Children’s Dietary Patterns and Children’s Mealtime Behaviours were graded ‘C+’ and ‘C’, respectively, signifying that eating behaviours in Hong Kong pre-school children were Fair; the average overall grade was ‘C’. Our findings indicate that approximately half of the pre-school children in Hong Kong adhered to healthy eating behaviours. Parental Food Choices and Preparation, Avoidance of Unhealthy Foods, and Family Mealtime Environments were graded ‘C+’, ‘B’, and ‘A-’, respectively, showing that FHFEs were Good; the average overall grade was ‘B’. Our results revealed that more than half of the pre-school children in Hong Kong were involved in a healthy home eating environment. Taken together, these findings enhance the understanding of pre-school children’s eating behaviours and FHFEs in Hong Kong.
 
Comparison of Report Card findings with Hong Kong’s previous data
Our Report Card showed that the eating behaviours of Hong Kong pre-school children were classified as Fair; some unhealthy dietary patterns and undesirable mealtime behaviours were prevalent because nearly half of the children did not meet predefined benchmarks for Children’s Eating Behaviours indicators. Previous research33 concerning the eating habits of Hong Kong pre-school children showed that more than half of the surveyed children (78.8%) had a habit of eating breakfast. Nevertheless, fewer than half of the children achieved the recommended daily intakes of vegetables (19.6%) and fruits (47.3%), respectively.33 Some studies identified a high prevalence of formula milk drinking among Hong Kong pre-school–aged children, such that 77% of 4-year-old children continue to drink formula milk.5 34 Overdependence on formula milk may reduce appetite in children and impede their development of healthy eating habits.35 Lo et al33 found that, on average, children consumed high energy-dense foods (eg, candy/chocolate, sweet crackers, and sugary beverages) more than twice per week; accordingly they suggested that such children should minimise their consumption of these foods. Additionally, an investigation regarding undesirable mealtime behaviours among Hong Kong pre-school children revealed that approximately 70% of the children required >30 minutes to finish a meal; these children often were unwilling to self-feed or finish their meals.6 The present study are consistent with previous research, indicating that there is considerable potential for improvement in eating behaviours among Hong Kong children.
 
Comparison of Report Card findings with international data
As mentioned above, the HAKSA Report Card assessed a few aspects of the dietary patterns of South African children and youth aged 3 to 8 years in 2018. Although using a grading rubric similar to our Report Card, the HAKSA Report Card only involved two indicators, namely Fruit and Vegetable Intake (graded ‘D’) and Snacking, Sugar-Sweetened Beverages, Dietary Sodium, and Fast Food Intake (graded ‘F’).21 Our Report Card may provide better coverage of healthy dietary patterns because it included assessments of regular daily meals, food variety, and formula milk-drinking habits, with a particular focus on pre-school children aged 2 to 6 years. Despite the discrepancies between studies, the healthy dietary patterns observed in our Report Card were more favourable than patterns observed in the HAKSA Report Card.21 This difference also implies that standards for healthy eating behaviours among children differ between South Africa and Hong Kong. Future studies should develop a cross-ountry/region–level Report Card and establish a global benchmark to comprehensively analyse global variations in healthy eating, thereby raising global awareness and stimulating global discussion regarding the promotion of healthy eating.
 
Novel findings on family home food environments
Very little is known about FHFEs of children in Hong Kong; therefore, the present study provides initial information concerning parental food choices and preparation, avoidance of unhealthy foods, and family mealtime environments among Hong Kong pre-school children. Based on our findings, the FHFEs of the pre-school children in Hong Kong were classified as Good. This result suggests that parents in Hong Kong attempt to promote healthy diets by limiting their children’s consumption of unhealthy foods. A previous study revealed that Hong Kong parents tended to adopt the ‘control over eating’ approach to feed their children, whereby parents primarily determine the amounts of food that children should eat, including unhealthy snacks.33 Moreover, parents often used food to reward or comfort children.36 The indicator of Family Mealtime Environments in our Report Card showed that most pre-school children had a structured family mealtime environment where they dined with their family and shared the same food with their family members. This finding may be attributed to the Chinese cultural emphasis on shared meals with family members.37 Thus, the results of the present study are consistent with previous research findings.
 
However, this high grade for Family Mealtime Environments may have increased the average grade for FHFEs indicators. Indeed, parents’ food choices, purchases, and preparation directly influence children’s home food environment and food consumption.38 When we specifically focused on the Parental Food Choices and Preparation indicator, the grade decreased to Fair (letter grade of ‘C+’), signifying that only half of the parents complied with healthy eating practices for their children, such as the use of nutrition labels and adoption of healthy cooking methods. Thus, it is important to promote healthy eating at home, which will facilitate healthy eating behaviours among children. A pilot FHFE intervention of the Healthy Home Offerings via the Mealtime Environment Plus programme, which provided parents and children with nutrition education and meal preparation training and activities, successfully promoted a structured mealtime environment at home and helped to improve dietary intake patterns.39 40 Accordingly, future studies might utilise nutrition education interventions to improve the FHFEs of pre-school children in Hong Kong.
 
Strengths and limitations
This study had some strengths. In particular, we collected primary data to enhance the understanding of eating behaviours and FHFEs among pre-school children in Hong Kong. Moreover, to our knowledge, this is the first use of a report card framework to comprehensively evaluate the prevalence of healthy eating behaviours among pre-school children.41 The Report Card can serve as an effective awareness-raising tool that provides novel insights concerning the promotion of healthy eating behaviours, as well as recommendations for healthy eating policies and healthy food environments.23
 
However, this study also had several limitations. First, its cross-sectional design precluded the identification of changes in children’s eating behaviours and FHFEs over time. Future studies could perform longitudinal measurements of variables in the Report Card to reveal changes or stability in healthy eating behaviours among young children; such measurements could also determine whether Report Card scores are predictive of health outcomes in children. An individual-level Healthy Eating Report Card should be developed in future studies to examine the effectiveness of the Report Card on parental intentions towards healthy eating, as well as children’s healthy eating behaviours and favourable FHFEs. Second, although the items of the Healthy Eating Report Card Questionnaire were developed based on the guidelines and recommendations of the Hong Kong SAR Government,25 26 the development of the questionnaire did not include evaluations of its content validity and psychometric properties. Future studies should examine the psychometric properties and other validity aspects of the Report Card questionnaire (eg, factorial validity, convergent validity, and discriminant validity).42 Third, the study relied on parent-reported questionnaires of children’s eating behaviours and FHFEs, which may be susceptible to response biases, social desirability bias, and general response tendencies.43 44 Validation studies comparing parent-reported questionnaires with more objective measures of children’s food intake and observational assessments of mealtime behaviours could be conducted in the future. Finally, the current Report Card does not reflect several components of children’s eating behaviours (eg, the frequency of dining out and the variety of vegetable and fruit consumption) and FHFEs (eg, parental feeding practices and accessibility of healthy food at home). Future studies should investigate whether these components could be included within the Healthy Eating Report Card to provide a more holistic assessment of healthy eating among children.
 
Conclusion
This study developed the Healthy Eating Report Card for Pre-school Children in Hong Kong to reflect the prevalence of healthy eating behaviours and favourable FHFEs among pre-school children in Hong Kong. The Report Card revealed that Children’s Eating Behaviours were classified as Fair (average grade of ‘C’), whereas FHFEs were classified as Good (average grade of ‘B’). There is considerable potential for improvement in children’s eating behaviours (ie, healthy dietary patterns and appropriate mealtime behaviours) and FHFEs (particularly concerning parental healthy food choices and preparation). We believe that the Report Card can serve as a useful tool for evaluating the prevalence of healthy eating behaviours and favourable FHFEs in young children; it could offer novel insights into strategies for promotion of healthy eating in pre-school setting.
 
Author contributions
Concept or design: All authors.
Acquisition of data: AWL Wan, DKC Chan.
Analysis or interpretation of data: AWL Wan, DKC Chan.
Drafting of the manuscript: AWL Wan, DKC Chan.
Critical revision of the manuscript for important intellectual content: All authors.
 
All authors had full access to the data, contributed to the study, approved the final version for publication, and take responsibility for its accuracy and integrity.
 
Conflicts of interest
All authors have disclosed no conflicts of interest.
 
Acknowledgement
The authors thank Ms Kiko KH Leung, Ms Roni MY Chiu, and Ms Tracy CW Tang from the Department of Early Childhood Education of The Education University of Hong Kong for their assistance in preparing study materials and collecting data. The authors also thank the eight participating kindergartens for aiding in the distribution and collection of questionnaires from parents.
 
Funding/support
This research was funded by the Research Impact Cluster Fund of the Department of Early Childhood Education, Faculty of Education and Human Development, The Education University of Hong Kong, through an award to the corresponding author. The funder had no role in study design, data collection/analysis/interpretation or manuscript preparation.
 
Ethics approval
The study protocol of this research was approved by the Human Research Ethics Committee of The Education University of Hong Kong (Ref No.: 2020-2021-0420). All schools and parents provided written informed consent for participation in this research and have also consented to the publication of its findings.
 
Supplementary material
The supplementary material was provided by the authors and may include some information that was not peer reviewed. Accepted supplementary material will be published as submitted by the authors, without any editing or formatting. Any opinions or recommendations discussed are solely those of the author(s) and are not endorsed by the Hong Kong Academy of Medicine and the Hong Kong Medical Association. The Hong Kong Academy of Medicine and the Hong Kong Medical Association disclaim all liability and responsibility arising from any reliance placed on the content.
 
References
1. World Health Organization. Healthy diet. 2020. Available from: https://www.who.int/news-room/fact-sheets/detail/healthy-diet. Accessed 9 Jul 2022.
2. Kupka R, Siekmans K, Beal T. The diets of children: overview of available data for children and adolescents. Glob Food Sec 2020;27:100442. Crossref
3. Movassagh EZ, Baxter-Jones AD, Kontulainen S, Whiting SJ, Vatanparast H. Tracking dietary patterns over 20 years from childhood through adolescence into young adulthood: the Saskatchewan Pediatric Bone Mineral Accrual Study. Nutrients 2017;9:990.Crossref
4. Department of Health. Hong Kong SAR Government. Diet, physical activity and health: Hong Kong situation. 2010. Available from: https://www.change4health.gov.hk/filemanager/common/image/strategic_framework/action_plan/action_plan_2_e.pdf. Accessed 5 Jul 2022.
5. Woo J, Chan R, Li L, Luk WY. A survey of infant and young child feeding in Hong Kong: diet and nutrient intake. 2012. Available from: https://www.fhs.gov.hk/english/reports/files/Diet_nutrientintake_executive%20summary_2504.pdf. Accessed 5 Jul 2022.
6. Yip PS, Chan VW, Lee QK, Lee HM. Diet quality and eating behavioural patterns in preschool children in Hong Kong. Asia Pac J Clin Nutr 2017;26:298-307. Crossref
7. Crist W, Napier-Phillips A. Mealtime behaviors of young children: a comparison of normative and clinical data. J Dev Behav Pediatr 2001;22:279-86. Crossref
8. Archer LA, Rosenbaum PL, Streiner DL. The children’s eating behavior inventory: reliability and validity results. J Pediatr Psychol 1991;16:629-42. Crossref
9. Samuel TM, Musa-Veloso K, Ho M, Venditti C, Shahkhalili-Dulloo Y. A narrative review of childhood picky eating and its relationship to food intakes, nutritional status, and growth. Nutrients 2018;10:1992. Crossref
10. Boswell N, Byrne R, Davies PS. Family food environment factors associated with obesity outcomes in early childhood. BMC Obes 2019;6:17. Crossref
11. Vereecken C, Haerens L, De Bourdeaudhuij I, Maes L. The relationship between children’s home food environment and dietary patterns in childhood and adolescence. Public Health Nutr 2010;13:1729-35. Crossref
12. Rex SM, Kopetsky A, Bodt B, Robson SM. Relationships among the physical and social home food environments, dietary intake, and diet quality in mothers and children. J Acad Nutr Diet 2021;121:2013-20.e1. Crossref
13. Chang HH, Nayga RM Jr. Mother’s nutritional label use and children’s body weight. Food Policy 2011;36:171-8. Crossref
14. Nepper MJ, Chai W. Associations of the home food environment with eating behaviors and weight status among children and adolescents. J Nutr Food Sci 2015(S12):1-5. Crossref
15. Patrick H, Nicklas TA. A review of family and social determinants of children’s eating patterns and diet quality. J Am Coll Nutr 2005;24:83-92. Crossref
16. Coppinger T, Milton K, Murtagh E, et al. Global Matrix 3.0 Physical Activity Report Card for Children and Youth: a comparison across Europe. Public Health 2020;187:150-6. Crossref
17. Huang WY, Wong SH, Sit CH, et al. Results from the Hong Kong’s 2018 Report Card on physical activity for children and youth. J Exerc Sci Fit 2019;17:14-9. Crossref
18. Barnes JD, Colley RC, Tremblay MS. Results from the Active Healthy Kids Canada 2011 Report Card on Physical Activity for Children and Youth. Appl Physiol Nutr Metab 2012;37:793-7. Crossref
19. Tremblay MS, Barnes JD, Bonne JC. Impact of the Active Healthy Kids Canada report card: a 10-year analysis. J Phys Act Health 2014;11 Suppl 1:S3-20. Crossref
20. De Villiers A, Steyn N, Coopoo Y, et al. Healthy Active Kids. South Africa Report Card 2010. 2010. Available from: https://www.activehealthykids.org/wp-content/uploads/2017/03/south-africa-report-card-long-form-2010.pdf. Accessed 5 Jul 2022.
21. Draper CE, Tomaz SA, Bassett SH, et al. Results from the Healthy Active Kids South Africa 2018 Report Card. SAJCH 2019;13:130-6. Crossref
22. Draper C, Basset S, de Villiers A, Lambert EV; HKKSA Writing Group. Results from South Africa’s 2014 Report Card on Physical Activity for Children and Youth. J Phys Act Health 2014;11 Suppl 1:S98-104. Crossref
23. Aubert S, Barnes JD, Abdeta C, et al. Global Matrix 3.0 Physical Activity Report Card grades for children and youth: results and analysis from 49 countries. J Phys Act Health 2018;15:S251-73. Crossref
24. Tremblay MS, Gray CE, Akinroye K, et al. Physical activity of children: a global matrix of grades comparing 15 countries. J Phys Act Health 2014;11 Suppl 1:S113-25. Crossref
25. Family Health Service, Department of Health, Hong Kong SAR Government. Healthy eating for preschool children (2 years to 5 years old). 2022. Available from: https://www.fhs.gov.hk/english/health_info/child/12185.html. Accessed 5 Jul 2022.
26. Centre for Health Protection, Department of Health, Hong Kong SAR Government. Nutrition guidelines for children aged 2 to 6. Revised 2018. Available from: https://www.startsmart.gov.hk/files/pdf/nutritional_guide_en.pdf. Accessed 5 Jul 2022.
27. United Nations World Food Programme. Food consumption score nutritional quality analysis (FCS-N) guidelines. 2015. Available from: https://docs.wfp.org/api/documents/WFP-0000007074/download/. Accessed 5 May 2022.
28. Bui C, Lin LY, Wu CY, Chiu YW, Chiou HY. Association between emotional eating and frequency of unhealthy food consumption among Taiwanese adolescents. Nutrients 2021;13:2739. Crossref
29. Family Health Service, Department of Health, Hong Kong SAR Government. Healthy eating for 6 to 24 month old children (3) ready to go (12-24 months). 2022. Available from: https://www.fhs.gov.hk/english/health_info/child/16301.html. Accessed 5 Jul 2022.
30. Centre for Health Protection, Department of Health, Hong Kong SAR Government. Ideas for healthy cooking. 2017. Available from: https://www.chp.gov.hk/en/static/90039.html. Accessed 5 Jul 2022.
31. Family Health Service, Department of Health, Hong Kong SAR Government. Do your 0-5-years old children need electronic screen products? 2022. Available from: https://www.fhs.gov.hk/english/health_info/child/30047.html. Accessed 5 Jul 2022.
32. Shim JE, Kim J, Mathai RA; STRONG Kids Research Team. Associations of infant feeding practices and picky eating behaviors of preschool children. J Am Diet Assoc 2011;111:1363-8. Crossref
33. Lo K, Cheung C, Lee A, Tam WW, Keung V. Associations between parental feeding styles and childhood eating habits: a survey of Hong Kong pre-school children. PLoS One 2015;10:e0124753. Crossref
34. Yeung S, Chan R, Li L, Leung S, Woo J. Bottle milk feeding and its association with food group consumption, growth and socio-demographic characteristics in Chinese young children. Matern Child Nutr 2017;13:e12341. Crossref
35. Family Health Service, Department of Health, Hong Kong SAR Government. Healthy eating for infants and young children—milk feeding. 2022. Available from: https://www.fhs.gov.hk/english/health_info/child/12549.html. Accessed 5 Aug 2022.
36. Wong EM, Sit JW, Tarrant MA, Cheng MM. The perceptions of obese school children in Hong Kong toward their weight-loss experience. J Sch Nurs 2012;28:370-8. Crossref
37. Ma G. Food, eating behavior, and culture in Chinese society. J Ethn Foods 2015;2:195-9. Crossref
38. Nowicka P, Keres J, Ek A, Nordin K, Sandvik P. Changing the home food environment: parents’ perspectives four years after starting obesity treatment for their preschool aged child. Int J Environ Res Public Health 2021;18:11293. Crossref
39. Fulkerson JA, Neumark-Sztainer D, Story M, et al. The Healthy Home Offerings via the Mealtime Environment (HOME) Plus study: design and methods. Contemp Clin Trials 2014;38:59-68. Crossref
40. Fulkerson JA, Friend S, Horning M, et al. Family home food environment and nutrition-related parent and child personal and behavioral outcomes of the Healthy Home Offerings via the Mealtime Environment (HOME) Plus program: a randomized controlled trial. J Acad Nutr Diet 2018;118:240-51. Crossref
41. Olstad DL, Raine KD, Nykiforuk CI. Development of a report card on healthy food environments and nutrition for children in Canada. Prev Med 2014;69:287-95. Crossref
42. Wan AW, Chung KK, Li JB, Xu SS, Chan DK. An assessment tool for the international healthy eating report card for preschool-aged children: a cross-cultural validation across Australia, Hong Kong, Singapore, and the United States. Front Nutr 2024;11:1340007. Crossref
43. Chan DK, Ivarsson A, Stenling A, Yang SX, Chatzisarantis NL, Hagger MS. Response-order effects in survey methods: a randomized controlled crossover study in the context of sport injury prevention. J Sport Exerc Psychol 2015;37:666-73. Crossref
44. Chan DK, Stenling A, Yusainy C, et al. Editor’s Choice: Consistency tendency and the theory of planned behavior: a randomized controlled crossover trial in a physical activity context. Psychol Health 2020;35:665-84. Crossref

Changes in cardiovascular disease risk predicted by the Framingham risk model in the Hong Kong population between 2003-2005 and 2014-2015: data from Population Health Surveys

Hong Kong Med J 2024 Jun;30(3):202–8 | Epub 29 May 2024
© Hong Kong Academy of Medicine. CC BY-NC-ND 4.0
 
ORIGINAL ARTICLE
Changes in cardiovascular disease risk predicted by the Framingham risk model in the Hong Kong population between 2003-2005 and 2014-2015: data from Population Health Surveys
Brian YC Sung, MB, BS1; Eric HM Tang, BSc2; Laura Bedford, BSc2; Carlos KH Wong, MPhil, PhD2,3; Emily TY Tse, MB, BS, FHKAM (Family Medicine)2; Esther YT Yu, MB, BS, FHKAM (Family Medicine)2; Bernard MY Cheung, MB, BChir, PhD1; Cindy LK Lam, MB, BS, MD2
1 Department of Medicine, The University of Hong Kong, Hong Kong SAR, China
2 Department of Family Medicine and Primary Care, The University of Hong Kong, Hong Kong SAR, China
3 Department of Pharmacology and Pharmacy, The University of Hong Kong, Hong Kong SAR, China
 
Corresponding author: Prof Bernard MY Cheung (mycheung@hku.hk)
 
 Full paper in PDF
 
Abstract
Introduction: The Framingham risk model estimates a person’s 10-year cardiovascular disease (CVD) risk. This study used this model to calculate the changes in sex- and age-specific CVD risks in the Hong Kong Population Health Survey (PHS) 2014/15 compared with two previous surveys conducted during 2003 and 2005, namely, PHS 2003/2004 and Heart Health Survey (HHS) 2004/2005.
 
Methods: This study included individuals aged 30 to 74 years from PHS 2014/15 (n=1662; n=4 445 868 after population weighting) and PHS 2003/2004 and HHS 2004/2005 (n=818; n=3 495 074 after population weighting) with complete data for calculating the risk of CVD predicted by the Framingham model. Sex-specific CVD risks were calculated based on age, total cholesterol and high-density lipoprotein cholesterol levels, mean systolic blood pressure, smoking habit, diabetic status, and hypertension treatment. Mean sex- and age-specific CVD risks were calculated; differences in CVD risk between the two surveys were compared by independent t tests.
 
Results: The difference in 10-year CVD risk from 2003-2005 to 2014-2015 was not statistically significant (10.2% vs 10.6%; P=0.29). After age standardisation according to World Health Organization world standard population data, a small decrease in CVD risk was observed, from 9.4% in 2003-2005 to 8.8% in 2014-2015. Analysis according to age-group showed that more participants aged 65 to 74 years were considered high risk in 2003 to 2005 (2003-2005: 66.8% vs 2014-2015: 53.1%; P=0.028). This difference may be due to the decrease in smokers among men (2003-2005: 30.5% vs 2014-2015: 24.0%; P<0.001).
 
Conclusion: From 2003-2005 to 2014-2015, there was a small decrease in age-standardised 10-year CVD risk. A holistic public health approach simultaneously targeting multiple risk factors is needed to achieve greater decreases in CVD risk.
 
 
New knowledge added by this study
  • The stagnation in 10-year cardiovascular disease (CVD) risk between 2003 and 2015 suggests that despite improvements in treatment, more effective prevention strategies (eg, improvements in diet and physical activity levels) are needed.
  • The effect of the decreasing number of current smokers was not strongly reflected in the change in 10-year CVD risk. This may be due to an increased prevalence of diabetes and an increased proportion of participants receiving antihypertensive medications.
Implications for clinical practice or policy
  • The findings suggest that the use of lipid-lowering drugs and antihypertensive medications does not effectively translate into overall cardiovascular risk reduction in the Hong Kong population, unless these treatments are simultaneously paired with prevention strategies targeting CVD risk factors.
 
 
Introduction
Cardiovascular disease (CVD) constitutes a spectrum of diseases that affect the heart and blood vessels. Worldwide, CVD is the leading cause of death as well as a major cause of premature death and chronic disability in numerous regions.1 In 2017, CVD was responsible for an estimated 17.8 million deaths, representing 31% of all global deaths.2 Hypertension, smoking status, hyperlipidaemia, and diabetes mellitus are prominent risk factors for CVD.3 The global prevalence of CVD risk factors is increasing. Currently, an estimated 15% of the world’s population (1.13 billion people) has hypertension, and the prevalence is expected to increase to 29% by 2025.4 5 Additionally, the global prevalence of diabetes increased from 211 million in 1990 to 476 million in 2017, representing a 129.7% increase in nearly three decades.6 The prevalences of CVD and its risk factors are expected to continue to increase in the near future due to industrialisation and population ageing. Fortunately, the World Health Organization (WHO) has estimated that premature CVD is preventable in >75% of cases, and risk factor amelioration can help reduce the burden caused by CVD.7
 
The risk of CVD over the next 10 years for an individual can be estimated using prediction models. Cardiovascular disease risk prediction is important at the individual and population levels. At the individual level, CVD risk prediction allows primary care medical professionals to identify high-risk patients. Risk factors for CVD, such as hypertension, can be treated accordingly to reduce the patient’s future risk of CVD. At the population level, CVD risk trends allow health policy planners to make evidence-based decisions and review current public health strategies used in CVD prevention.8
 
Changes in CVD risk can serve as a reference to indicate changes in public health status within a population. Two studies have evaluated changes in the 10-year CVD risk in the United States (US) population. In a study by Ajani and Ford,9 risk models adopted by the National Cholesterol Education Program Adult Treatment Panel III were utilised to estimate coronary heart disease risk, rather than the more precise Framingham formulae for estimation of overall CVD risk. Notably, their analysis lacked age stratification. On the other hand, Lopez-Jimenez et al10 evaluated the changes in CVD risk between 1976 and 2004. To our knowledge, no previous study has evaluated the change in 10-year CVD risk in an Asian population, and insights are needed regarding the cardiovascular health status of the population in a more recent time period.
 
In this study, we aimed to calculate and compare the changes in sex- and age-specific CVD risks predicted by the Framingham model in a Hong Kong general population by using the Hong Kong Population Health Survey (PHS) 2014/15 in combination with two previous surveys conducted in 2003 to 2005, namely, PHS 2003/2004 and Heart Health Survey (HHS) 2004/2005.
 
Methods
Study design and sampling
The data in this study were sourced from PHS 2003/200411 and PHS 2014/15.12 Population Health Surveys are territory-wide cross-sectional surveys conducted by the Department of Health of the Hong Kong SAR Government. These surveys target the land-based non-institutional population of individuals aged ≥15 years in Hong Kong, excluding foreign domestic helpers and visitors. Systematic replicate sampling was adopted to select living quarters that were representative of the Hong Kong general population. All domestic households in the selected living quarters and household members in the target population were individually surveyed. Written consent was obtained from individuals who agreed to participate in a PHS. Participants were invited to complete a face-to-face interview, where they provided information about their socio-demographic characteristics, disease status, and daily lifestyle habits. After the interview, consenting participants aged 15 to 84 years were randomly selected to undergo a health examination that included physical measurements and biochemical testing.12 Health examinations for participants of PHS 2003/2004 were conducted as part of the HHS 2004/2005.
 
The STROBE (Strengthening the Reporting of Observational Studies in Epidemiology) checklist was followed for preparing this manuscript.
 
Predicted risk of cardiovascular disease over the next 10 years
The main outcome of this study was the predicted risk of CVD over the next 10 years among people aged 30 to 74 years. Thus far, no specific prediction models have been developed for the Hong Kong population. In this study, we adopted the prediction model for primary care developed by the Framingham Heart Study Cohort in the general adult population aged 30 to 74 years.13 The Framingham CVD risk model was validated and can be applied to the Chinese population, but requires recalibration in men.14 A CVD event was defined as a composite of coronary heart disease, cerebrovascular events, peripheral artery disease, and heart failure in the Framingham model. The predicted CVD risk over the next 10 years was calculated for each participant using the following information: age, total cholesterol level, high-density lipoprotein cholesterol level, systolic blood pressure, use of antihypertensive medication, current smoking status, and diabetes status.
 
Statistical analysis
A complete-case analysis approach was utilised in this study. Descriptive statistics were used to present the characteristics of included individuals. Sex- and age-specific predicted CVD risks in 2003-2005 and 2014-2015 were calculated to summarise the change in risk according to sex and age-group. Significant differences in the above factors between the two PHSs were tested by independent t test or Chi squared test, as appropriate.
 
To summarise results at the population level, population weighting established by the Department of Health was applied according to age-group and sex for participants in each PHS. To compare results at the population level, age-standardised predicted CVD risk was calculated using WHO 2000-2025 world standard population data15 and the US population census data in 2000.16
 
All statistical analyses were performed with SPSS software (Windows version 26.0; IBM Corp, Armonk [NY], US). All significance tests were two-tailed, and P values <0.05 were considered statistically significant.
 
Results
In total, 1662 and 818 participants were included in the PHS 2014/15 cohort and the PHS 2003/2004 and HHS 2004/2005 cohort, respectively. These individuals represented populations of 4 445 868 and 3 495 074, respectively. Table 1 shows the baseline characteristics of the PHS and HHS cohorts according to Framingham predictors. The mean age was similar in both cohorts (2003-2005: 48.6 years vs 2014-2015: 50.8 years) and the proportions of male and female participants were similar (female participants in 2003-2005: 54.1% vs 2014-2015: 53.0%).
 

Table 1. Summary statistics for risk factors among the participants in the health surveys
 
Predicted CVD risk increases with age and is higher in men (Table 2). In PHS 2003/2004 and HHS 2004/2005, the mean CVD risk increased with age in both sexes, from 1.6% among women aged 30-44 years to 17.8% among women aged 65-74 years, and from 5.1% among men aged 30-44 years to 33.4% among men aged 65-74 years. Between the two surveys, there was no significant difference in overall 10-year CVD risk (2003-2005: 10.2% vs 2014-2015: 10.6%; P=0.29). After age standardisation according to WHO world standard population data, the age-standardised predicted CVD risks in the 2003-2005 cohort and the 2014-2015 cohort were 9.4% and 8.8%, respectively (Table 3). The small decrease in predicted CVD risk may be due to the decrease in smokers among men (30.5% vs 24.0%; P<0.001) [Table 1].
 

Table 2. Mean weighted 10-year cardiovascular disease risk predicted by the Framingham model among participants aged 30 to 74 years in the health surveys according to age-group and sex
 

Table 3. Age-standardised estimates of cardiovascular disease risk for the participants of the health surveys
 
The risk of cardiovascular events over the next 10 years was classified as low (CVD risk <10%), medium (CVD risk ≥10% and <20%), and high (CVD risk ≥20%); the distributions of risk groups are presented in Table 4. Among participants aged 30 to 74 years, the risk group distributions were similar in both cohorts. When analysed according to sex, 29.1% of men and 5.1% of women were classified as high-risk in PHS 2014/15, whereas 28.2% of men and 6.4% of women were classified as high-risk in PHS 2003/2004 and HHS 2004/2005. When analysed according to age-group, more participants aged 65 to 74 years were classified as high-risk in PHS 2003/2004 and HHS 2004/2005 (66.8% vs 2014-2015: 53.1%; P=0.028).
 

Table 4. Ten-year cardiovascular disease risk level among non-institutionalised individuals aged 30 to 74 years according to age-group based on the Framingham risk model
 
Discussion
Using representative samples from the Hong Kong PHS and HHS, we found that the 10-year CVD risk increases with age and is consistently higher in men (men: 15.5% vs women: 6.2%; P<0.001, in PHS 2014/15) [Table 2]. This trend is consistent with previous reports; for example, an analysis of NHANES (National Health and Nutrition Examination Survey) III data showed that men have a significantly higher CVD risk (11.8% in men vs 5.1% in women) and that CVD risk is higher in older age-groups (16.2% for participants aged 60-74 years vs 11.2% for participants aged 50-59 years).10 Thus, risk management for older adults may represent a challenge to the current health infrastructure. The burden of CVD is directly associated with increased morbidity and mortality in patients, and it translates to substantial healthcare costs. In Hong Kong, the number of people aged ≥65 years is predicted to reach 2.58 million (35.9% of the population) by 2064.17 Thus, there is a critical need to achieve a more comprehensive understanding of the aetiologies associated with CVD in older adults.
 
The results have extensive public health implications. Although age-standardised rates of death from CVD in Hong Kong greatly decreased from 93.4 per 100 000 standard population in 2001 to 56.0 per 100 000 standard population in 2017,18 there was no significant difference in overall 10-year CVD risk between 2003-2005 and 2014-2015 (10.2% vs 10.6%; P=0.29) [Table 2]. After age standardisation according to WHO world standard population data, a small decrease in CVD risk was observed, from 9.4% in 2003-2005 to 8.8% in 2014-2015 [Table 3]. A study of NHANES data revealed a similar trend, consisting of a small decrease in CVD risk from 1988 to 2004 (7.9% to 7.4%; P<0.001).10 The stagnation in 10-year CVD risk between 2003-2005 and 2014-2015 suggests that despite improvements in treatment, more effective prevention strategies (eg, improvements in diet and physical activity levels) are needed.19 Primary care intervention to manage modifiable risk factors, such as hypertension, dyslipidaemia, and diabetes, can complement population-based policies. Efforts to ensure access to appropriate healthcare and affordable medications will help control abnormal risk factor levels.20 Furthermore, despite the importance of targeting individual risk factors to reduce prevalence, the long-term objective should be reduced overall risk of CVD. This objective requires a holistic approach simultaneously targeting multiple risk factors.
 
Our results highlight the need for overall risk assessment, in addition to targeted efforts focused on specific CVD risk factors. During the past decade, numerous public health initiatives (eg, smoking cessation campaigns) have been implemented to reduce the prevalence of established risk factors for CVD. It is reasonable to expect that CVD risk would decrease over time in conjunction with the decreased prevalences of various risk factors, such as the declining number of current smokers. Surprisingly, these changes were not strongly reflected in the change in 10-year CVD risk. One explanation is that decreases in the prevalence of some risk factors are offset by increases in others. For example, population ageing in Hong Kong may shift more adults into the high-risk group. However, because the Framingham model was limited to individuals aged 30 to 74 years, the change in mean age between the two surveys is inconsequential. Other possible changes in risk factors include increases in the prevalence of diabetes and hypertension, as reflected by the increased proportion of participants receiving antihypertensive medications (Table 1). Although CVD mortality has considerably decreased, it is concerning that CVD risk has not substantially diminished over the past decade. This lack of improvement in CVD risk may lead to an increasing community burden of CVD in the near future, especially in the context of population ageing.
 
The overall 10-year CVD risk for participants aged 30 to 74 years in 2003-2005 after age adjustment to US census population data in 2000 was 10.7%. During a similar time period (1999-2004), the US population had a 10-year CVD risk of 7.4%.10 When Hong Kong men were stratified according to risk group in 2014-2015, 48.8% were classified as low-risk, 22.1% were classified as medium-risk, and 29.1% were classified as high-risk (Table 4). For comparison, among men in the United Kingdom population during 2012, 46.5% were classified as low-risk, 39.9% were classified as medium-risk, and 13.6% were classified as high-risk using the National Institute for Health and Care Excellence Framingham risk model.21 In terms of risk distribution, a greater proportion of Hong Kong men were classified as high-risk compared with men in the United Kingdom in the early 2010s. In terms of age-standardised risk, the Hong Kong population had a higher 10-year CVD risk than the US population in 2003.
 
Analysis according to age showed that the proportion of low-risk participants increased from 2003-2005 to 2014-2015, particularly in the age-groups of 55-64 and 65-74 years (2003-2005: 28.5% vs 2014-2015: 44.7% for participants aged 55-64 years, and 6.1% vs 15.4% for participants aged 65-74 years) [Table 4]. This increased proportion may be the result of primary care clinicians recognising age as a prominent risk factor for CVD, leading to more aggressive treatment of modifiable risk factors. Furthermore, there were fewer male smokers in 2014-2015 than in 2003-2005 (24.0% vs 30.5%; P<0.001) [Table 1], suggesting that the success of recent anti-smoking campaigns also contributed to this paradigm shift.
 
Contrary to a previous report addressing changes in several CVD risk factors,22 we used the widely validated Framingham risk model to predict the risk of CVD. By measuring the net change in cardiovascular risk, we more comprehensively estimated the impacts of prevention strategies; this is particularly important because some risk factors worsened, some improved, and some remained stable over time. To our knowledge, this is the first study to evaluate the change in 10-year CVD risk in an Asian population. The results reinforce the need for more aggressive community-wide and clinic-based preventions, with an emphasis on increased exercise hours during leisure time, dietary changes that promote higher intake of vegetables and fruits, as well as lower intake of salt and saturated fats, weight maintenance, and smoking cessation. The findings also suggest that the discovery and use of lipid-lowering drugs and antihypertensive medications does not effectively translate into overall risk reduction in an Asian population, unless these treatments are simultaneously paired with prevention strategies targeting CVD risk factors.
 
Strengths and limitations
This study was based on two Hong Kong population health surveys, and thus the sample is highly representative of the general population. Baseline data were collected through laboratory tests and face-to-face interviews, suggesting that these data are highly reliable. The long interval between the two health surveys (2003-2005 to 2014-2015) also provides insights regarding the effectiveness of current CVD prevention strategies. Limitations of the current study involve its use of the Framingham risk prediction model and the PHS and HHS. Similar to other surveys, the PHS and HHS are susceptible to participation bias because the sample data might not provide an accurate representation of the overall population. Many PHS variables are self-reported and may lead to reporting bias. Considering the effort required to complete the long questionnaires, the collected data may be susceptible to non-response bias and recall bias. Furthermore, because the Framingham cohort primarily consisted of Caucasians, the predicted 10-year CVD risk in the Hong Kong population calculated using the Framingham model should be interpreted cautiously. The Framingham risk model was developed for people without a history of CVD; thus, a small proportion of the overall sample lacking a history of CVD might have been included in the study, causing inaccuracies in the results. Additionally, the model may overestimate the 10-year CVD risk for men in Hong Kong,14 and a recalibrated model with greater predictive power may be required. Although several limitations and assumptions may hinder the prediction of CVD risk, these potential sources of bias were present in both surveys. Therefore, the effects of such biases may be less important when comparing the change in predicted 10-year CVD risk between the two time points.
 
Conclusion
During the period from 2003-2005 to 2014-2015, the change in predicted 10-year CVD risk was not statistically significant. However, the proportion of low-risk participants within older age-groups was higher in PHS 2014/15 than in PHS 2003/2004 and HHS 2004/2005. More aggressive CVD prevention strategies and primary care interventions are needed to address CVD risk factors.
 
Author contributions
Concept or design: BMY Cheung, CLK Lam.
Acquisition of data: BYC Sung, EHM Tang, BMY Cheung, CLK Lam.
Analysis or interpretation of data: BYC Sung, EHM Tang.
Drafting of the manuscript: BYC Sung, EHM Tang.
Critical revision of the manuscript for important intellectual content: L Bedford, CKH Wong, ETY Tse, EYT Yu, BMY Cheung, CLK Lam.
 
All authors had full access to the data, contributed to the study, approved the final version for publication, and take responsibility for its accuracy and integrity.
 
Conflicts of interest
As advisers of the journal, CKH Wong and EYT Yu were not involved in the peer review process. Other authors have disclosed no conflicts of interest.
 
Acknowledgement
The authors thank the Department of Health of the Hong Kong SAR Government for granting approval to use the data from Population Health Survey 2003/2004, Heart Health Survey 2004/2005, and Population Health Survey 2014/15 for this research. The authors also thank Dr Weinan Dong and Ms Tingting Wu from the Department of Family Medicine and Primary Care of The University of Hong Kong for their assistance in data interpretation and revising the final draft of the manuscript.
 
Declaration
Part of this study was presented as a poster at the ESC Congress 2021 – The Digital Experience (virtual), 27-30 August 2021, and was published as an abstract (Sung BY, Tang EH, Bedford L, et al. Change in Framingham cardiovascular disease risk between 2003 and 2014 in the Hong Kong Population Health Survey [abstract]. Eur Heart J 2021;42:1).
 
Funding/support
This research received no specific grant from any funding agency in the public, commercial, or not-for-profit sectors.
 
Ethics approval
The requirement for ethics approval for this research was waived by the Institutional Review Board of The University of Hong Kong/Hospital Authority Hong Kong West Cluster, Hong Kong as this study involved secondary analysis of de-identified governmental data.
 
References
1. Roth GA, Johnson C, Abajobir A, et al. Global, regional, and national burden of cardiovascular diseases for 10 causes, 1990 to 2015. J Am Coll Cardiol 2017;70:1-25. Crossref
2. GBD 2017 Causes of Death Collaborators. Global, regional, and national age-sex-specific mortality for 282 causes of death in 195 countries and territories, 1980-2017: a systematic analysis for the Global Burden of Disease Study 2017. Lancet 2018;392:1736-88. Crossref
3. Romero CX, Romero TE, Shlay JC, Ogden LG, Dabelea D. Changing trends in the prevalence and disparities of obesity and other cardiovascular disease risk factors in three racial/ethnic groups of USA adults. Adv Prev Med 2012;2012:172423. Crossref
4. World Health Organization. Hypertension. 2019. Available from: https://www.who.int/news-room/fact-sheets/detail/hypertension. Accessed 8 Jan 2021.
5. Kearney PM, Whelton M, Reynolds K, Muntner P, Whelton PK, He J. Global burden of hypertension: analysis of worldwide data. Lancet 2005;365:217-23. Crossref
6. Lin X, Xu Y, Pan X, et al. Global, regional, and national burden and trend of diabetes in 195 countries and territories: an analysis from 1990 to 2025. Sci Rep 2020;10:14790. Crossref
7. World Health Organization. Cardiovascular diseases. 2016. Available from: https://www.who.int/health-topics/cardiovascular-diseases#tab=tab_1. Accessed 8 Jan 2021.
8. World Health Organization. Prevention of cardiovascular disease. Guidelines for assessment and management of cardiovascular risk. 2007. Available from: https://apps.who.int/iris/bitstream/handle/10665/43685/9789241547178_eng.pdf?sequence=1&isAllowed=y. Accessed 8 Jan 2021.
9. Ajani UA, Ford ES. Has the risk for coronary heart disease changed among U.S. adults? J Am Coll Cardiol 2006;48:1177-82. Crossref
10. Lopez-Jimenez F, Batsis JA, Roger VL, Brekke L, Ting HH, Somers VK. Trends in 10-year predicted risk of cardiovascular disease in the United States, 1976 to 2004. Circ Cardiovasc Qual Outcomes 2009;2:443-50. Crossref
11. Department of Health, Hong Kong SAR Government; Department of Community Medicine, The University of Hong Kong. Population Health Survey 2003/2004 2015. Available from: https://www.chp.gov.hk/files/pdf/report_on_population_health_survey_2003_2004_en.pdf. Accessed 8 Jan 2021.
12. Surveillance and Epidemiology Branch, Centre for Health Protection, Department of Health, Hong Kong SAR Government. Report of Population Health Survey 2014/2015. 2017. Available from: https://www.chp.gov.hk/files/pdf/dh_phs_2014_15_full_report_eng.pdf. Accessed 8 Jan 2021.
13. D’Agostino RB Sr, Vasan RS, Pencina MJ, et al. General cardiovascular risk profile for use in primary care: the Framingham Heart Study. Circulation 2008;117:743-53. Crossref
14. Lee CH, Woo YC, Lam JK, et al. Validation of the Pooled Cohort equations in a long-term cohort study of Hong Kong Chinese. J Clin Lipidol 2015;9:640-6.e2. Crossref
15. World Health Organization. Age standardization of rates: a new WHO standard. 2001. Available from: https://cdn.who.int/media/docs/default-source/gho-documents/global-health-estimates/gpe_discussion_paper_series_paper31_2001_age_standardization_rates.pdf. Accessed 6 May 2024.
16. United States Census Bureau. Introduction to Census 2000 Data Products. Available from: https://usa.ipums.org/usa/resources/voliii/pubdocs/2000/mso-01icdp.pdf. Accessed 1 May 2024.
17. Census and Statistics Department, Hong Kong SAR Government. Hong Kong population projections 2017-2066. 2017. Available from: https://www.censtatd.gov.hk/media_workers_corner/pc_rm/hkpp2017_2066/index.jsp. Accessed 8 Jan 2021.
18. Department of Health, Hong Kong SAR Government. Non-Communicable Diseases Watch. Overview of cardiovascular diseases. September 2018. Available from: https://www.chp.gov.hk/files/pdf/ncd_watch_sep_2018.pdf. Accessed 8 Jan 2021.
19. National Prevention Council, United States Government. National Prevention Strategy. America’s plan for better health and wellness. June 2011. Available from: https://www.hhs.gov/sites/default/files/disease-prevention-wellness-report.pdf. Accessed 8 Jan 2021.
20. Chow CK, Nguyen TN, Marschner S, et al. Availability and affordability of medicines and cardiovascular outcomes in 21 high-income, middle-income and low-income countries. BMJ Glob Health 2020;5:e002640. Crossref
21. Collins GS, Altman DG. Predicting the 10-year risk of cardiovascular disease in the United Kingdom: independent and external validation of an updated version of QRISK2. BMJ 2012;344:e4181. Crossref
22. Carroll MD, Lacher DA, Sorlie PD, et al. Trends in serum lipids and lipoproteins of adults, 1960-2002. JAMA 2005;294:1773-81. Crossref

Detection of significant liver fibrosis in Chinese psoriasis patients receiving methotrexate: a comparison between transient elastography and liver histology

© Hong Kong Academy of Medicine. CC BY-NC-ND 4.0
 
ORIGINAL ARTICLE
Detection of significant liver fibrosis in Chinese psoriasis patients receiving methotrexate: a comparison between transient elastography and liver histology
Christina SM Wong, FRCP (Edin), FHKAM (Medicine)# 1; Loey LY Mak, MD, FRCP (Glasg)# 2; Victor KH Lee, FRCR, FHKAM (Radiology)3; Regina CL Lo, MD, FHKAM (Pathology)4; Martin MH Chung, MRCP, FHKAM (Medicine)1; Ferdinand Chu, FRCR, FACLM5,6; CK Yeung, MD, FRCP1; MF Yuen, PhD, FRCP2; Henry HL Chan, MD, PhD1
1 Division of Dermatology, Department of Medicine, School of Clinical Medicine, Li Ka Shing Faculty of Medicine, The University of Hong Kong, Hong Kong SAR, China
2 Division of Gastroenterology and Hepatology, Department of Medicine, School of Clinical Medicine, Li Ka Shing Faculty of Medicine, The University of Hong Kong, Hong Kong SAR, China
3 Imaging and Interventional Radiology Centre, CUHK Medical Centre, Hong Kong SAR, China
4 Department of Pathology, Li Ka Shing Faculty of Medicine, The University of Hong Kong, Hong Kong SAR, China
5 Department of Radiology, Queen Mary Hospital, Hong Kong SAR, China
6 St Vincent’s Hospital, Sydney, Australia
# Equal contribution
 
Corresponding author: Prof Henry HL Chan (hhlchan@hku.hk)
 
 Full paper in PDF
 
Abstract
Introduction: Methotrexate (MTX) is effective for treating psoriasis and psoriatic arthritis, but its potential hepatoxicity remains a concern. Liver biopsy, the gold standard for detecting MTX-induced liver injury, is invasive and carries considerable risk. Transient elastography (TE) offers a non-invasive alternative for detecting advanced liver fibrosis. This study investigated the performance of TE in detecting MTX-induced liver fibrosis among Chinese psoriasis patients, compared with liver biopsy.
 
Methods: This study included adult patients with clinical psoriasis. Liver stiffness measurement using TE was performed in patients receiving MTX. Exclusion criteria were known liver cirrhosis, positive viral hepatitis carrier status, or conditions influencing TE performance. Liver biopsy was performed when liver stiffness was ≥7.1 kilopascals (kPa) or when the total cumulative dose (TCD) of MTX was ≥3.5 g.
 
Results: A total of 228 patients were screened; among 34 patients who met the inclusion criteria, nine (26.5%) had significant liver fibrosis (Roenigk grade ≥3a). The area under the receiver operating characteristic curve was 0.76 (95% confidence interval=0.59-0.93; P=0.021), indicating that TE had satisfactory performance in detecting liver fibrosis. A cut-off value of 7.1 kPa of liver stiffness yielded 100% sensitivity and 68% specificity. Liver fibrosis was not correlated with the TCD of MTX or the duration of MTX use; it was significantly correlated with obesity and diabetes status (body mass index ≥30 kg/m2, waist circumference ≥138 cm, and glycated haemoglobin level ≥7.8%).
 
Conclusions: Transient elastography is reliable and superior to the TCD for detecting liver fibrosis in Chinese psoriasis patients receiving MTX. Liver biopsy should be reserved for high-risk patients or patients with liver stiffness ≥11.7 kPa on TE.
 
 
New knowledge added by this study
  • Transient elastography (TE) exhibits satisfactory performance in the detection of methotrexate (MTX)-induced liver fibrosis among Chinese psoriasis patients receiving MTX.
  • Although current guidelines state that liver biopsy should be considered if the total cumulative dose of MTX is ≥3.5 g, it is shown that the dose was not correlated with the degree of liver fibrosis in Chinese psoriasis patients. Importantly, liver stiffness (LS) measurement by TE is a more appropriate method for monitoring MTXinduced liver fibrosis.
  • Chinese patients with obesity who exhibit a high body mass index and large abdominal circumference have a higher risk of liver fibrosis and should be closely monitored when receiving MTX.
Implications for clinical practice or policy
  • Transient elastography can be used to monitor MTX-induced liver fibrosis, whereas liver biopsy should be reserved for high-risk psoriasis patients.
  • Yearly TE monitoring is recommended for patients with LS ≥7.1 kilopascals (kPa), while liver biopsy should be considered for patients with LS ≥11.7 kPa.
 
 
Introduction
Methotrexate (MTX) is an effective immunosuppressive drug for moderate to severe psoriasis and psoriatic arthritis.1 2 It is considered relatively safe and cost-effective for long-term use. However, prolonged used of MTX can potentially cause liver fibrosis and fatty changes without alterations in liver enzymes. The mechanism of MTX-induced liver fibrosis is suspected to involve the production of extracellular adenosine, a pro-fibrotic agent.3
 
Although liver fibrosis can be evaluated by imaging or biochemical parameters, liver biopsy remains the gold standard for diagnosing liver fibrosis.4 However, it has limitations such as sampling error and poor feasibility for serial assessments. The rates of liver biopsy–associated morbidity and mortality are approximately 1% and 0.01% to 0.1%, respectively.5 6 The Roenigk scale is generally used to grade MTX-induced liver fibrosis,7 but other systems (eg, Ishak and METAVIR) have also been used for fibrosis assessment.8 9
 
The measurement of serum level of specific biomarkers such as the amino terminal of type III procollagen peptide can be used as alternative methods to assess liver fibrosis.10 11 12 13 However, these measurements are not widely available in many regions. Therefore, a sensitive and specific non-invasive technique is required to detect MTX-induced liver injury.
 
Transient elastography (TE) is a non-invasive method for assessing liver ‘hardness’ or stiffness that involves measuring the velocity of a vibration wave (ie, a shear wave) when travelling to a particular depth inside the liver, based on the principle that the wave velocity is greater in fibrotic tissue than in normal liver tissue. This technique has been used as a screening tool for liver cirrhosis in various conditions.14 15 16 17 In contrast to liver biopsy, TE allows the simultaneous assessment of a larger sampling area, is easily reproducible, and has low inter-observer variability and a low failure rate (<5%).15 Generally, a liver stiffness (LS) of ≤5 kilopascals (kPa) suggests a low probability of fibrosis, whereas a value of ≥7 kPa suggests a high likelihood of advanced fibrosis in patients with various chronic liver disorders.14 15 16 17 18 Thus far, there are limited data regarding TE accuracy and cut-off threshold in terms of detecting MTX-induced liver injury among Chinese psoriasis patients.
 
This study aimed to evaluate the performance (reliability) of TE in detecting significant liver fibrosis among psoriasis patients in the Chinese population, compared with gold-standard liver biopsy assessment using the Roenigk classification.
 
Methods
This cross-sectional single-centre study was conducted from 1 December 2019 to 31 March 2021. Patients with psoriasis and/or psoriatic arthritis undergoing regular follow-up in the dermatological clinic at a major tertiary hospital in Hong Kong were consecutively screened for inclusion (Fig 1). The inclusion criteria were as follows: age ≥18 years, clinical diagnosis of psoriasis with or without arthritis, and current use of MTX with a cumulative dosage of ≥150 mg or minimum duration of 6 months. Patients were excluded if they had known liver cirrhosis or concomitant chronic liver disease (including chronic hepatitis B or C infection, alcohol use disorder, Wilson’s disease, autoimmune hepatitis, primary biliary cholangitis, primary sclerosing cholangitis, and a history of hepatocellular carcinoma), had a condition that could influence TE accuracy (eg, ascites, severe renal disease, peritoneal dialysis, or severe cardiovascular insufficiency),14 15 16 17 18 refused to give consent, were pregnant, or had not been receiving MTX. After the acquisition of informed consent, all participants provided a thorough history and underwent a comprehensive examination.
 

Fig 1. Participant recruitment
 
Clinical and laboratory data
Upon recruitment, clinical and metabolic measurements, including body weight, body mass index (BMI), systolic and diastolic blood pressure, and waist circumference, were recorded. The duration and cumulative dosage of MTX treatment, disease severity (measured by the Psoriasis Area and Severity Index), and body surface area (BSA) were documented. Laboratory parameters assessed included hepatitis B/C infection status, complete blood count, serum fasting glucose level, glycated haemoglobin (HbA1c) level, triglyceride level, low- and high-density lipoprotein cholesterol levels, liver enzyme levels (eg, aspartate aminotransferase and alanine aminotransferase), and renal function. Patient demographic data, co-morbidities (hypertension, diabetes, cardiovascular disease, chronic liver/renal disease, and alcoholic liver disease), and concomitant medications were collected from electronic medical records.
 
Liver stiffness measurement by transient elastography
Transient elastography assessments were conducted within 1 month after recruitment. Liver stiffness was evaluated using the FibroScan ultrasonic imaging device (Echosens, Paris, France) and expressed as the median value (in kPa) after at least 10 successful acquisitions. Measurements were considered reliable if the success rate was ≥60%, combined with an interquartile range (IQR) of ≤30%.15 16 For patients with a BMI of <30 kg/m2, an M probe was used; for those with a BMI of ≥30 kg/m2, an XL probe was used. The controlled attenuation parameter (CAP) was also recorded to estimate liver steatosis, expressed in decibels per metre (dB/m).16 The investigators (senior research assistants trained to perform TE) were blinded to the patients’ clinical characteristics, MTX dosage, and previous liver ultrasound or biopsy results. Patients were instructed to fast for 4 hours prior to LS measurements. In previous studies involving Asian populations, significant liver fibrosis or cirrhosis was indicated by LS values of ≥7.1 kPa19 and >14.0 kPa,20 respectively. Therefore, in our study, significant liver fibrosis on TE was defined as LS ≥7.1 kPa.
 
Liver biopsy
A liver biopsy (to assess the degree of liver fibrosis by histology) was performed within 3 months after TE in patients who had significant liver fibrosis (ie, LS ≥7.1 kPa on TE) or a total cumulative dose (TCD) of MTX ≥3.5 g, with or without additional risk factors. This protocol was adopted based on international guidelines1 2 18 19 20 21 22 and previous studies in Asian populations.21 22 Ultrasound-guided core-needle liver biopsy procedures were performed by an experienced radiologist using a percutaneous approach.5 6
 
Histological assessments were conducted by a pathologist with expertise in hepatobiliary disorders, who was blinded to the TE results. The Roenigk scale was used to grade liver fibrosis/cirrhosis, defined as grade 1 (no fibrosis, no or mild fatty infiltration, no or mild nuclear variability, and no or mild portal inflammation), grade 2 (no fibrosis, but moderate to severe fatty infiltration, nuclear pleomorphism, and portal inflammation), grade 3a (mild fibrosis, moderate to severe fatty infiltration, portal tract enlargement, and lobular necrosis), grade 3b (moderate to severe fibrosis), and grade 4 (cirrhosis).7 For patients with MTX-induced liver injury (Roenigk grade 3a), MTX could be continued, with follow-up liver biopsy repeated in 6 months. For those with significant liver fibrosis or cirrhosis (Roenigk grades 3b or 4), MTX was discontinued and alternative treatment was initiated.2
 
Data analysis and statistics
For statistical analysis, continuous variables were expressed as median (range or IQR, as specified) or mean (± standard deviation) values, as appropriate. Receiver operating characteristic (ROC) curves were used to determine the predictive ability of TE-based LS relative to histopathology (Roenigk grade ≥3a), with 95% confidence intervals (CIs). Correlations between two variables were calculated using Pearson or Spearman rank correlation coefficients. The Chi squared test or Fisher’s exact test was used for comparisons of categorical variables, as appropriate. Quantitative variables were subjected to normality assessment via the Shapiro–Wilk test; non–normally distributed variables were compared between groups using the Wilcoxon rank-sum test. Statistical analyses were conducted using SPSS software (Windows version 26.0; IBM Corp, Armonk [NY], United States). P values <0.05 were considered statistically significant.
 
Results
Baseline characteristics
In total, 785 psoriasis patients were recruited into the study; 234 fulfilled the screening criteria and were included in the analysis. Six patients subsequently withdrew their consent (Fig 1).
 
Among 228 patients who underwent TE evaluation, 140 were diagnosed with psoriasis and 88 were diagnosed with psoriatic arthritis (Table 1). Fifty-eight patients, who either had LS ≥7.1 kPa or received a TCD of MTX ≥3.5 g, were advised to undergo liver biopsy; 24 patients who refused or had contraindications to liver biopsy were excluded from the study (Fig 1). Thus, 34 patients (24 fulfilling the TE criteria and 15 fulfilling the TCD criteria of MTX) who had undergone both TE and liver biopsies were included in further analyses. The clinical and demographic details of the study participants are summarised in Table 1.
 
Among the 34 patients, the median values of LS and CAP were 8.80 kPa (IQR, 7.1-12.4; range, 3.5-30.4) and 321.0 dB/m (IQR, 262-357; range, 200-400), respectively. Furthermore, 24 patients (70.6%) had a high LS value (ie, ≥7.1 kPa, indicative of significant fibrosis); 24 patients (70.6%) had a CAP value of ≥268 dB/m, indicative of moderate to severe steatosis.
 

Table 1. Demographic and clinical characteristics of patients who underwent transient elastography and those who underwent liver biopsy assessments
 
Histology evaluation revealed liver fibrosis in nine of 34 (26.5%) patients: six had Roenigk grade 3a, three had Roenigk grade 3b, and none had Roenigk grade 4 (cirrhosis).
 
Correlations of liver stiffness with clinical and laboratory parameters
Liver stiffness measurements via TE showed moderate correlations with BMI (r=0.441; P=0.009), waist circumference (r=0.437; P=0.01), and body weight (r=0.456; P=0.007); there were no correlations with the TCD of MTX or duration of MTX use (Table 2).
 

Table 2. Correlation of liver stiffness values with clinical and laboratory parameters (n=34)
 
Patients with LS ≥7.1 kPa had a higher BMI (P=0.01), body weight (P=0.01), and waist circumference (P=0.03). They also exhibited greater disease severity with a higher Psoriasis Area and Severity Index score (P=0.02) and more extensive BSA involvement (P=0.03). Furthermore, patients with LS ≥7.1 kPa had higher fasting glucose (P=0.03) and HbA1c levels (P=0.02), but they did not show significant differences in serum lipid levels (Table 3).
 

Table 3. Comparison of psoriasis patients with and without liver fibrosis according to transient elastography and liver histology (n=34)
 
In terms of histology findings, patients with a Roenigk grade ≥3a had significantly greater BMI (P=0.01), waist circumference (P=0.04), BSA (P=0.04), and HbA1c values (P=0.03), compared with those who exhibited lower stages of histological fibrosis. Notably, there were no significant differences in the TCD of MTX, lipid profiles, or liver and renal biochemistries between the two groups. Patients with Roenigk grade ≥3a (LS: 11.7 kPa; range, 7.8-15.7) had higher LS values than those with Roenigk grade <3a (LS: 8.6 kPa; range, 5.9-11) [P=0.018] (Table 3).
 
Performance characteristics of transient elastography for diagnosing significant/advanced liver fibrosis
Comparison of TE-based LS values (in kPa) with histopathology revealed an area under the ROC curve of 0.76 (95% CI=0.59-0.93; P=0.021) [Fig 2], which demonstrated the satisfactory performance of TE in detecting significant liver fibrosis. An LS cut-off value of 7.1 kPa yielded 100% sensitivity and 68% specificity for diagnosing Roenigk grade ≥3a.
 

Fig 2. Performance of transient elastography as reflected by area under the receiver operating characteristic (ROC) curve comparing liver fibrosis detection between liver stiffness measurement (in kilopascals) and liver biopsy (Roenigk grade ≥3a)
 
In a subgroup analysis of patients with LS ≥7.1 kPa, excluding patients who only met the TCD criteria of MTX (n=24), the area under the ROC curve with reference to Roenigk grade ≥3a was 0.702 (95% CI=0.47-0.94); an LS cut-off value of 10.7 kPa yielded 86% sensitivity and 59% specificity. In contrast, when ROC analysis was focused on the subgroup of patients with a TCD of MTX ≥3.5 g (n=14, excluding patients who only met the TE criteria), the area under the ROC curve was 0.622 (95% CI=0.31-0.94); an LS cut-off value of 8.2 g yielded 60% sensitivity and 67% specificity.
 
Discussion
Use of transient elastography to monitor liver fibrosis in psoriasis patients receiving methotrexate
International guidelines recommend using TE for routine monitoring of MTX therapy.2 4 According to the Australasian position statement, TE monitoring is recommended every 3 years if initial LS is <7.5 kPa and yearly if LS is ≥7.5 kPa; liver biopsy is recommended if LS is >9.5 kPa.23
 
Currently, there is no guideline for monitoring MTX-induced liver fibrosis among Chinese psoriasis patients in Hong Kong. On the basis of previous studies,2 4 23 the present study utilised a modified approach that reflects our department’s routine practice of conducting liver biopsy for patients who have TE-based LS ≥7.1 kPa or a TCD of MTX ≥3.5 g, with or without abnormal liver biochemistry.
 
Our study confirmed the robust performance of TE in detecting significant liver fibrosis among Chinese psoriasis patients receiving MTX; the LS cut-off value of 7.1 kPa yielded 100% sensitivity and 68% specificity. These findings are consistent with a recent review and studies in other countries (Table 4).7 19 20 According to these published data, TE demonstrated fair to good performance in detecting liver fibrosis, with high negative predictive values (NPVs) [83% to 96%] but generally low positive predictive values (PPVs),19 20 21 22 23 24 which might be explained by the overall low prevalence of significant liver fibrosis in this population and the higher rate of TE failure among patients with obesity. Obesity might also influence diagnostic performance; a recent review noted that obesity could substantially reduce TE accuracy.19 Lee et al25 showed that, compared with control participants, independent risk factors for liver fibrosis included diabetes mellitus (odds ratio [OR]=30.4), obesity with high BMI (OR=8.3), and overweight (OR=6.3). Our results supported previous observations that TE-based LS measurements were not correlated with the TCD of MTX, although they were associated with BMI, diabetes mellitus, and obesity.19 24 Rongngern et al19 analysed 41 Asian psoriasis patients receiving MTX; they demonstrated that TE had good performance in detecting MTX-induced liver injury, with an area under the ROC curve of 0.78.19
 

Table 4. Comparison of studies about the diagnostic performance of transient elastography in detecting methotrexate-induced liver fibrosis among psoriasis patients, compared with liver histology
 
In this same study,19 using an LS cut-off value of 7.1 kPa, for detecting MTX-induced liver injury, defined as Roenigk grade ≥3a, TE provided a sensitivity and specificity of 50% and 83.9%, respectively, and a PPV of 50% and a NPV of 84%; in addition, the use of TE values ≥7.1 yielded 50% sensitivity and 76.9% specificity for detecting significant liver fibrosis, defined as METAVIR stage ≥F2; and giving a PPV of 10% and a NPV of 96.8%. Similarly, our study showed a PPV of 26.7% and a NPV of 100%. In the study of 53 psoriasis patients receiving MTX, Khandpur et al20 identified median LS values of 5.3 kPA (range, 2.7-17.8); TE could only detect 4 (21%) of 19 patients with liver fibrosis (Ishak stage ≥F1).20
 
Because the median LS for our patients with significant liver fibrosis (Roenigk grade ≥3a) was 11.7 kPa (IQR, 7.8-15.7), we recommend yearly TE monitoring for patients with LS ≥7.1 kPa. Liver biopsy should be considered for patients with LS ≥11.7 kPa, instead of a TCD ≥3.5 g or LS ≥7.1 kPa; earlier biopsy is suggested for high-risk patients (eg, patients with high BMI, abdominal obesity, or diabetes mellitus).
 
Associations of body mass index, abdominal obesity, and glycated haemoglobin level with liver fibrosis
The median LS in this study (n=228) was 6.91 kPa (IQR, 4.5-7.1). Among the 34 patients who underwent liver biopsy, the median LS was 8.80 kPa (IQR, 7.1-12.4). Overall, 9 of 34 patients (26.5%) had Roenigk grade 3a (mild)/3b (moderate to severe) liver fibrosis, whereas 14 (41.2%) patients had moderate to severe fatty infiltration (Roenigk grade 2) [Table 1]. The prevalences of liver fibrosis and steatotic changes in our study were higher than the rates reported in a 2015 review, where histology showed that only 5% of patients (range, 0%-33%) receiving MTX had developed significant liver fibrosis.14
 
Impacts of body mass index and coexisting non-alcoholic steatohepatitis or fatty liver disease on liver stiffness measurement
The aetiology of liver fibrosis can be multifactorial. Previous studies have shown that obesity, combined with other metabolic risk factors, is associated with liver fibrosis in non-alcoholic fatty liver disease (NAFLD) patients and psoriasis patients.26 27 28 The potential contributions of coexisting non-alcoholic steatohepatitis or NAFLD and metabolic syndrome to liver fibrosis have been suggested. In our cohort, >40% of psoriasis patients had a CAP of ≥268 dB/m, indicative of moderate to severe steatosis. The liver fibrosis could be attributed to coexisting non-alcoholic steatohepatitis or NAFLD, in addition to MTX-induced changes. The work of Wong et al26 demonstrated that NAFLD patients with BMI ≥30 kg/m2 had higher LS compared with normal healthy individuals. Our findings corroborate these observations; we found that BMI, body weight, and waist circumference were moderately correlated with TE-based LS measurements (all r>0.40; all P<0.05) [Table 2]. Intriguingly, although 70.6% of our biopsy cohort had moderate to severe hepatic steatosis (Table 1), CAP values were not significantly associated with LS >7.1 kPa or Roenigk grade ≥3a (Table 3). Therefore, the adverse effect of BMI on LS cannot be explained by concomitant hepatic steatosis alone.
 
In our study, patients with clinically significant liver fibrosis more frequently displayed characteristics of metabolic syndrome compared with patients lacking histologically confirmed liver fibrosis, as evidenced by significantly greater BMI (33.5 ± 0.68 kg/m2 vs 29.4 ± 6.18 kg/m2; P=0.01), waist circumference (138.0 ± 52.0 cm vs 101.2 ± 14.9 cm; P=0.04), and HbA1c values (7.86 ± 2.02% vs 6.15 ± 1.16%; P=0.03) [Table 3]. Sub-analysis showed that all patients with histologically confirmed liver fibrosis had a BMI ≥25 kg/m2 (Table 5), suggesting that psoriasis patients should maintain a normal BMI to decrease the risk of liver fibrosis.
 

Table 5. Liver stiffness values according to body mass index, psoriasis severity, and liver histology among psoriasis patients receiving methotrexate
 
Role of transient elastography: liver stiffness measurements to guide liver biopsy considerations
Despite the recommendation to perform a screening liver biopsy for exclusion of possible liver cirrhosis among patients receiving long-term MTX therapy (with a TCD >3.5 g),1 2 our study did not identify a positive correlation between significant liver fibrosis and the TCD of MTX. Similarly, a study involving 420 patients with inflammatory arthritis receiving MTX revealed no significant correlation between cumulative MTX dosage and TE-based LS measurements.24 In the present study, although the TCD of MTX was higher in patients with liver fibrosis (5.23 g vs 4.79 g in those without), the difference was not statistically significant. In this context, LS measurements may be superior to the TCD of MTX when considering the need for liver biopsy to rule out advanced liver fibrosis.
 
Contrary to concerns about hepatotoxicity during long-term MTX therapy, we did not find a correlation between LS values and the duration of MTX use. The duration of MTX use in patients without liver fibrosis was nearly 10 years, indicating that the drug is generally well-tolerated in psoriasis patients. Patients who tended to continue MTX treatment belonged to an MTX-responsive group without significant adverse events, such as liver derangement identified via blood tests. In contrast, patients experiencing liver derangement or other adverse events might have discontinued MTX treatment earlier and were thus excluded from the study. Although we excluded patients with chronic hepatitis B, TE-based LS measurement is a widely validated non-invasive tool for real-world assessments of liver fibrosis in such patients; it allows the prediction of advanced fibrosis and disease progression.29 Therefore, TE should also be considered a valuable tool in guiding treatment for psoriasis patients with chronic hepatitis B who are receiving MTX.
 
In addition to LS measurement, TE can assess the degree of steatosis through CAP. This assessment was beneficial among patients with psoriasis in the present study; 26.5% (9 of 34) of the patients had metabolic syndrome and were predisposed to concomitant hepatic steatosis, regardless of MTX use. The median CAP value in our study was 321 ± 95 dB/m (range, 200-400). The area under the ROC curve of TE was 0.783 (95% CI=0.61-0.95; P<0.01); the cut-off of 254 dB/m for detecting steatosis yielded 91% sensitivity and 60% specificity. However, the presence of simple hepatic steatosis alone does not warrant liver biopsy, and management decisions should follow appropriate clinical guidelines.30 31 32
 
Limitations
This study had some limitations. Notably, its sample size was small. Although liver fibrosis is generally uncommon in patients with psoriasis receiving MTX therapy, a larger sample size may be required for more definitive conclusions. Additionally, sampling error and inter- and intra-observer variabilities in histological assessment of liver tissue may have influenced the findings.
 
Conclusion
Transient elastography is a reliable screening tool for detecting significant liver fibrosis in Chinese psoriasis patients receiving MTX. When considering liver biopsy to rule out the possibility of clinically significant liver fibrosis, TE-based LS measurements provide superior reference information, compared with the TCD of MTX. Patients with high BMI, body weight, and abdominal obesity have a higher risk of liver fibrosis. Therefore, these factors should be considered when monitoring MTX-related liver fibrosis in psoriasis patients.
 
Author contributions
Concept or design: CSM Wong, LLY Mak, CK Yeung, HHL Chan, MF Yuen.
Acquisition of data: CSM Wong, MMH Chung, LLY Mak.
Analysis or interpretation of data: CSM Wong, MMH Chung, LLY Mak.
Drafting of the manuscript: CSM Wong, LLY Mak, F Chu, VKH Lee, RCL Lo.
Critical revision of the manuscript for important intellectual content: CK Yeung, HHL Chan, MF Yuen.
 
All authors had full access to the data, contributed to the study, approved the final version for publication, and take responsibility for its accuracy and integrity.
 
Conflicts of interest
All authors have disclosed no conflicts of interest.
 
Acknowledgement
The authors thank Ms Rachael Yu, Ms Davis Wong, and Ms Ivy Cheng from Division of Dermatology, Department of Medicine, School of Clinical Medicine, Li Ka Shing Faculty of Medicine, The University of Hong Kong for their assistance with patient recruitment, data acquisition, and analysis.
 
Declaration
The preliminary data of this research were presented as ePoster presentation in the 31st European Academy of Dermatology and Venereology Congress 2022 (7-10 September 2022, Milan, Italy and online).
 
Funding/support
This research received no specific grant from any funding agency in the public, commercial, or not-for-profit sectors.
 
Ethics approval
This study was approved by the Institutional Review Board of The University of Hong Kong and Hong Kong West Cluster, Hospital Authority, Hong Kong (Ref No.: UW19-390) and was conducted in full compliance with the International Council for Harmonisation E6 guideline for Good Clinical Practice and the principles of the Declaration of Helsinki. Patient consent has been obtained for all clinical information and images reported in this article. All participant information has been deidentified and remains anonymous.
 
References
1. Kalb RE, Strober B, Weinstein G, Lebwohl M. Methotrexate and psoriasis: 2009 National Psoriasis Foundation Consensus Conference. J Am Acad Dermatol 2009;60:824-37. Crossref
2. Warren RB, Weatherhead SC, Smith CH, et al. British Association of Dermatologists’ guidelines for the safe and effective prescribing of methotrexate for skin disease 2016. Br J Dermatol 2016;175:23-44. Crossref
3. Themido R, Loureiro M, Pecegueiro M, Brandão M, Campos MC. Methotrexate hepatotoxicity in psoriatic patients submitted to long-term therapy. Acta Derm Venereol 1992;72:361-4. Crossref
4. Kremer JM, Alarcón GS, Lightfoot RW Jr, et al. Methotrexate for rheumatoid arthritis. Suggested guidelines for monitoring liver toxicity. American College of Rheumatology. Arthritis Rheum 1994;37:316-28. Crossref
5. Howlett DC, Drinkwater KJ, Lawrence D, Barter S, Nicholson T. Findings of the UK national audit evaluating image-guided or image-assisted liver biopsy. Part II. Minor and major complications and procedure-related mortality. Radiology 2013;266:226-35. Crossref
6. Regev A, Berho M, Jeffers LJ, et al. Sampling error and intraobserver variation in liver biopsy in patients with chronic HCV infection. Am J Gastroenterol 2002;97:2614-8. Crossref
7. Berends MA, Snoek J, de Jong EM, et al. Biochemical and biophysical assessment of MTX-induced liver fibrosis in psoriasis patients: FibroTest predicts the presence and FibroScan predicts the absence of significant liver fibrosis. Liver Int 2007;27:639-45. Crossref
8. Ishak K, Baptista A, Bianchi L, et al. Histological grading and staging of chronic hepatitis. J Hepatol 1995;22:696-9. Crossref
9. Goodman ZD. Grading and staging systems for inflammation and fibrosis in chronic liver diseases. J Hepatol 2007;47:598-607. Crossref
10. Carneiro SC, Cássia FF, Lamy F, Chagas VL, Ramos-e-Silva M. Methotrexate and liver function: a study of 13 psoriasis cases treated with different cumulative dosages. J Eur Acad Dermatol Venereol 2008;22:25-9. Crossref
11. Chou R, Wasson N. Blood tests to diagnose fibrosis or cirrhosis in patients with chronic hepatitis C virus infection: a systematic review. Ann Intern Med 2013;158:807-20. Crossref
12. Fung J, Lai CL, Fong DY, Yuen JC, Wong DK, Yuen MF. Correlation of liver biochemistry with liver stiffness in chronic hepatitis B and development of a predictive model for liver fibrosis. Liver Int 2008;28:1408-16. Crossref
13. Martyn-Simmons CL, Rosenberg WM, Cross R, Wong T, Smith CH, Barker JN. Validity of noninvasive markers of methotrexate-induced hepatotoxicity: a retrospective cohort study. Br J Dermatol 2014;171:267-73. Crossref
14. Brener S. Transient elastography for assessment of liver fibrosis and steatosis: an evidence-based analysis. Ont Health Technol Assess Ser 2015;15:1-45.
15. Foucher J, Castéra L, Bernard PH, et al. Prevalence and factors associated with failure of liver stiffness measurement using FibroScan in a prospective study of 2114 examinations. Eur J Gastroenterol Hepatol 2006;18:411-2. Crossref
16. Karlas T, Petroff D, Sasso M, et al. Individual patient data meta-analysis of controlled attenuation parameter (CAP) technology for assessing steatosis. J Hepatol 2017;66:1022-30. Crossref
17. Castéra L, Vergniol J, Foucher J, et al. Prospective comparison of transient elastography, Fibrotest, APRI, and liver biopsy for the assessment of fibrosis in chronic hepatitis C. Gastroenterology 2005;128:343-50. Crossref
18. Friedrich-Rust M, Ong MF, Martens S, et al. Performance of transient elastography for the staging of liver fibrosis: a meta-analysis. Gastroenterology 2008;134:960-74. Crossref
19. Rongngern P, Chularojanamontri L, Wongpraparut C, et al. Diagnostic performance of transient elastography for detection of methotrexate-induced liver injury using Roenigk classification in Asian patients with psoriasis: a retrospective study. Arch Dermatol Res 2017;309:403-8. Crossref
20. Khandpur S, Yadav D, Jangid B, et al. Ultrasound liver elastography for the detection of liver fibrosis in patients with psoriasis and reactive arthritis on long-term methotrexate therapy: a cross-sectional study. Indian J Dermatol Venereol Leprol 2020;86:508-14. Crossref
21. Marsh RL, Kelly S, Mumtaz K, Kaffenberger J. Utility and limitations of transient elastography to monitor hepatic steatosis, hepatic fibrosis, and methotrexate-associated hepatic disease in psoriasis: a systematic review. J Clin Aesthet Dermatol 2021;14:24-8.
22. Cheng HS, Rademaker M. Monitoring methotrexate-induced liver fibrosis in patients with psoriasis: utility of transient elastography. Psoriasis (Auckl) 2018;8:21-9. Crossref
23. Rademaker M, Gupta M, Andrews M, et al. The Australasian Psoriasis Collaboration view on methotrexate for psoriasis in the Australasian setting. Australas J Dermatol 2017;58:166-70. Crossref
24. Darabian S, Wade JP, Kur J, Wade SD, Sayre EC, Badii M. Using FibroScan to assess for the development of liver fibrosis in patients with arthritis on methotrexate: a single-center experience. J Rheumatol 2022;49:558-65. Crossref
25. Lee JH, Loo CH, Tan WC, Lee CK, Jamil A, Khor YH. Comparison of noninvasive screening tools for hepatic fibrosis, association with methotrexate cumulative dose, and risk factors in psoriasis patients. Dermatol Ther 2022;35:e15203. Crossref
26. Wong GL, Chan HL, Choi PC, et al. Association between anthropometric parameters and measurements of liver stiffness by transient elastography. Clin Gastroenterol Hepatol 2013;11:295-302.e1-3. Crossref
27. Rodríguez-Zúñiga MJ, García-Perdomo HA. Systematic review and meta-analysis of the association between psoriasis and metabolic syndrome. J Am Acad Dermatol 2017;77:657-66.e8. Crossref
28. Malatjalian DA, Ross JB, Williams CN, Colwell SJ, Eastwood BJ. Methotrexate hepatotoxicity in psoriatics: report of 104 patients from Nova Scotia, with analysis of risks from obesity, diabetes and alcohol consumption during long term follow-up. Can J Gastroenterol 1996;10:369-75. Crossref
29. Wong GL. Non-invasive assessments for liver fibrosis: the crystal ball we long for. J Gastroenterol Hepatol 2018;33:1009-15. Crossref
30. Cusi K, Isaacs S, Barb D, et al. American Association of Clinical Endocrinology Clinical Practice Guideline for the diagnosis and management of nonalcoholic fatty liver disease in primary care and endocrinology clinical settings: co-sponsored by the American Association for the Study of Liver Diseases (AASLD). Endocr Pract 2022;28:528-62. Crossref
31. Chalasani N, Younossi Z, Lavine JE, et al. The diagnosis and management of nonalcoholic fatty liver disease: practice guidance from the American Association for the Study of Liver Diseases. Hepatology 2018;67:328-57. Crossref
32. European Association for the Study of the Liver; Clinical Practice Guideline Panel; Berzigotti A, et al. EASL Clinical Practice Guidelines on non-invasive tests for evaluation of liver disease severity and prognosis—2021 update. J Hepatol 2021;75:659-89. Crossref

Comparison of clinical characteristics between ACOSOG Z0011–eligible cohort and sentinel lymph node–positive breast cancer patients in Hong Kong

Hong Kong Med J 2024 Apr;30(2):139–46 | Epub 25 Mar 2024
© Hong Kong Academy of Medicine. CC BY-NC-ND 4.0
 
ORIGINAL ARTICLE
Comparison of clinical characteristics between ACOSOG Z0011–eligible cohort and sentinel lymph node–positive breast cancer patients in Hong Kong
Vivian Man, FCSHK, FRCSEd; Ava Kwong, FCSHK, FRCS
Department of Surgery, Queen Mary Hospital, Hong Kong SAR, China
 
Corresponding author: Prof Ava Kwong (avakwong@hku.hk)
 
 Full paper in PDF
 
Abstract
Introduction: The American College of Surgeons Oncology Group (ACOSOG) Z0011 trial resulted in de-escalation of axillary surgery among early-stage breast cancer patients with low-volume sentinel lymph node (SLN) disease undergoing breast-conserving surgery and radiation therapy. Nevertheless, the mastectomy rate in the Chinese population remains high. This study compared the clinical characteristics of the ACOSOG Z0011–eligible cohort with SLN-positive breast cancer patients in Hong Kong.
 
Methods: This retrospective analysis of a prospectively maintained database at a university-affiliated breast cancer centre in Hong Kong was performed from June 2014 to May 2019. The database included all patients with clinical tumour (T) stage T1 or T2 invasive breast carcinoma, no palpable adenopathy, one or two positive SLNs on histological examination, and no prior neoadjuvant systemic treatment. Comparisons were made between the mastectomy and breast-conserving treatment groups in our cohort, along with the sentinel-alone arm in the ACOSOG Z0011 trial.
 
Results: One hundred and seventy-one patients met the inclusion criteria: 112 underwent mastectomy and 59 underwent breast-conserving treatment. Our mastectomy group had higher prevalences of T2 tumours (P<0.001), lymphovascular invasion (P<0.001), and SLN macrometastases (P=0.004) compared with the ACOSOG Z0011 cohort. However, in our patient population, mean pathological size slightly differed between the mastectomy and breast-conserving treatment groups (2.2 cm vs 1.8 cm; P=0.005). Other histopathological features were similar.
 
Conclusion: This study demonstrated that clinicopathological features were comparable between SLN-positive breast cancer patients undergoing mastectomy and those undergoing breast-conserving treatment. Low-risk SLN-positive mastectomy patients may safely avoid completion axillary lymph node dissection.
 
 
New knowledge added by this study
  • Despite the high rate of mastectomy in Hong Kong, a small proportion of node-positive breast cancer patients met the American College of Surgeons Oncology Group (ACOSOG) Z0011 eligibility criteria to forgo axillary lymph node dissection.
  • Sentinel lymph node–positive breast cancer patients undergoing mastectomy displayed clinicopathological features similar to those undergoing breast-conserving treatment in Hong Kong.
Implications for clinical practice or policy
  • By expanding the AMAROS trial (After Mapping of the Axilla: Radiotherapy Or Surgery?) eligibility to include ACOSOG Z0011–ineligible mastectomy patients, more patients could avoid axillary lymph node dissection with adjuvant radiotherapy, potentially reducing morbidity.
  • Further studies are necessary to explore when adjuvant axillary radiotherapy is indicated among mastectomy patients with low axillary nodal burden.
 
 
Introduction
The evolution of optimal axillary management for breast cancer patients has led to emphasis on the de-escalation of axillary surgery and minimisation of surgical morbidity. Favourable results from the American College of Surgeons Oncology Group (ACOSOG) Z0011 phase 3 randomised clinical trials have redefined the indications for completion axillary lymph node dissection (ALND) in patients with positive sentinel lymph nodes (SLNs). Early-stage breast cancer patients who undergo upfront breast-conserving surgery and have one or two positive SLNs can safely forgo ALND while maintaining good overall survival and disease-free survival.1 2 Consequently, the ASCO (American Society of Clinical Oncology)3 and the NCCN (National Comprehensive Cancer Network)4 have revised their clinical practice guidelines to recommend against completion ALND in this subset of patients. Although this guidance has led to a significant decline in the rate of completion ALND among ACOSOG Z0011–eligible patients,5 6 7 a similar reduction was observed among patients undergoing mastectomy.8 9 This reduction was particularly pronounced among patients with SLN micrometastases.8 Further evidence was obtained in the phase 3 IBCSG (International Breast Cancer Study Group) 23-01 randomised controlled trials, where approximately 10% of patients with SLN micrometastases underwent mastectomy; subgroup analysis demonstrated that disease-free survival among patients without axillary dissection was non-inferior to those with axillary dissection after 10 years of follow-up.10 11 Similarly, in the AMAROS trial (After Mapping of the Axilla: Radiotherapy Or Surgery?), 17% of patients with tumour (T) staging T1 to T2 primary breast cancer underwent mastectomy.12 Axillary radiotherapy led to an oncological outcome comparable to completion ALND but was associated with a lower rate of lymphoedema.
 
In Hong Kong, factors such as the relatively small breast sizes among Chinese women13 and more conservative cultural attitudes13 14 have contributed to a higher rate of mastectomy. The decision to perform mastectomy has prevented a substantial number of breast cancer patients from meeting the ACOSOG Z0011 criteria. Our previous study evaluated the applicability of ACOSOG Z0011 criteria in Hong Kong.15 Patients with clinical nodal (N) staging N0 breast cancer and one or more positive SLNs were stratified into eligible and ineligible groups according to the ACOSOG Z0011 criteria, with 93% of patients in the ineligible group underwent mastectomy.15 Importantly, only 24% of patients in that study met the ACOSOG Z0011 criteria and could potentially avoid ALND.15 Therefore, it is important to identify a low-risk subset of SLN-positive mastectomy patients who could benefit from this non-ALND approach. This retrospective study was conducted to compare the clinical characteristics of SLN-positive breast cancer patients in Hong Kong with the ACOSOG Z0011–eligible cohort.
 
Methods
Patient recruitment
This retrospective analysis of a prospectively maintained database was conducted at Queen Mary Hospital, a university-affiliated tertiary breast cancer centre in Hong Kong, from June 2014 to May 2019. Potentially eligible patients in the database were identified by an independent research assistant according to whether they met the ACOSOG Z0011 criteria, irrespective of breast surgery type. Patients were excluded if they had positive non-SLNs or positive SLNs only detected by immunohistochemical staining. Relevant data were extracted in July 2020 and missing information was verified using the Clinical Management System, a central computer system for medical records across public hospitals in Hong Kong. Recruited patients were divided into two groups, namely, the mastectomy group and the breast-conserving treatment (ie, ACOSOG Z0011–eligible) group.
 
Clinical management and pathological assessment
All breast cancer patients underwent mammography and ultrasound of the breasts and axillae for clinical tumour and nodal staging. Sentinel lymph node biopsy (SLNB), offered to patients with clinically node-negative disease, was performed with a dual tracer of radioisotope and patent blue dye. Sentinel lymph nodes were defined as lymph nodes with ex vivo gamma probe counts exceeding 10% of the highest ex vivo reading or lymph nodes that displayed blue staining. Non-SLNs were defined as suspicious nodes that were neither hot (high gamma probe counts) nor blue-stained during SLNB, or nodes that were removed during completion ALND. During the study period, intraoperative frozen sections of SLNs or suspicious non-SLNs were routinely collected; these were analysed by standard haematoxylin and eosin staining. Immunohistochemistry was performed in cases of suspected nodal metastasis. Completion ALND was conducted if frozen or paraffin sections showed evidence of nodal metastasis. All final pathological results were reviewed in multidisciplinary meetings. The pathologies of SLNs were considered normal or containing one of the following: macrometastases (>2 mm), micrometastases (>0.2 to ≤2 mm), or isolated tumour cells (≤0.2 mm). For patients undergoing breast-conserving surgery, ‘no ink on tumour’ was regarded as an adequate resection margin16; alternatively, a second operation was performed to ensure a clear resection margin. Adjuvant treatment was administered by breast oncology specialists according to decisions made in multidisciplinary meetings.
 
Statistical analysis
Patient demographic characteristics and tumour characteristics were retrieved from database records; percentages were calculated. Missing information was evaluated and managed by pairwise deletion. Comparisons were made between the mastectomy and breast-conserving treatment groups in our cohort, along with the sentinel-alone arm in the ACOSOG Z0011 trial (n=436, in intention to treat).1 2 Analyses followed the per-protocol approach and calculations were performed with SPSS software (Windows version 24.0; IBM Corp, Armonk [NY], United States). Comparisons between cohorts were conducted with Student’s t test or the Chi squared test, as appropriate. Human epidermal growth factor receptor 2 (HER2) status was not assessed in the ACOSOG Z0011 study; therefore, HER2 statuses were only compared within our cohort. The Memorial Sloan Kettering Cancer Center (MSKCC) breast cancer nomogram,17 a well-validated prediction tool to assess the likelihood of non–sentinel node metastases18 19 20 (including external validation in the Chinese population19 20), was used to calculate probability through an online calculator that considered nine variables; comparisons were made between the breast-conserving treatment and mastectomy groups. P values <0.05 were considered statistically significant.
 
Results
In our centre, the ACOSOG Z0011 criteria have been used to manage patients undergoing breast-conserving surgery since June 2019. From June 2014 to May 2019, 1249 breast cancer patients underwent SLNB in our institution; 171 patients (13.7%) met the study inclusion criteria of clinical T1 or T2 invasive breast cancer and one or two positive SLNs. One hundred and twelve patients (65.5%) underwent mastectomy and 59 patients (34.5%) underwent breast-conserving treatment. The median follow-up period was 58 months (range, 25-84).
 
Our mastectomy group versus the sentinel-alone arm in the ACOSOG Z0011 trial
Patient demographic characteristics and tumour characteristics of our mastectomy group and the sentinel-alone arm in the ACOSOG Z0011 trial are presented in Table 1. Invasive ductal carcinoma was more common in our patient population than in the ACOSOG Z0011 group. A higher prevalence of clinical T2 breast cancers (~50%) was observed in our mastectomy group (P<0.001). There were also significantly more patients with lymphovascular invasion in our cohort than in the sentinel-alone arm in the ACOSOG Z0011 trial (P<0.001). Although nearly half of the original ACOSOG Z0011 cohort had micrometastatic SLNs, approximately 70% of mastectomy patients had macrometastatic SLNs (P=0.004). These findings suggested that the clinicopathological profile was more aggressive in patients requiring mastectomy.
 

Table 1. Clinical characteristics of patients with mastectomy in this study and the sentinel-alone arm in the ACOSOG (American College of Surgeons Oncology Group) Z0011 trial
 
Our mastectomy group versus our breast-conserving treatment group
In our patient cohort, the mastectomy group exhibited many clinicopathological characteristics similar to the breast-conserving treatment group (Table 2). There were no statistically significant differences in terms of age, tumour grade, lymphovascular invasion status, oestrogen receptor/progesterone receptor status, or HER2 status. The mastectomy group had relatively larger tumours than the breast-conserving treatment group (mean: 2.2 cm vs 1.8 cm; P=0.005). Although the difference was not statistically significant, the mastectomy group tended to have larger proportions of patients with two metastatic SLNs (24.1% vs 13.6%; P=0.1) and SLN macrometastases (70.5% vs 57.6%; P=0.11) than the breast-conserving treatment group. Furthermore, the MSKCC probability for additional metastatic non-SLNs was slightly higher in the mastectomy group than in the breast-conserving treatment group (37.1% vs 31.4%; P=0.03) [Table 2].
 

Table 2. Clinical characteristics of patients with mastectomy and breast-conserving treatment in this study
 
Ninety-seven patients (86.6%) in the mastectomy group and 45 patients (76.3%) in the breast-conserving treatment group underwent completion ALND. Among patients who underwent mastectomy and completion ALND, 26 patients (26.8%) had additional non-SLN metastases (range, 1-18). In contrast, eight patients (17.8%) in the breast-conserving treatment group had additional non-SLN metastases (range, 1-8). There was no statistically significant difference in the rate of non-SLN metastases between the two treatment arms (P=0.24). Twenty-nine patients (17.9%) underwent SLNB alone; 15 of these patients were in the mastectomy group. Most patients with SLNB alone had micrometastatic SLNs (89.7%) and one patient had isolated tumour cells. None of the patients with SLNB alone experienced recurrence.
 
Adjuvant treatment
In the mastectomy group, 97 patients (86.6%) underwent post-mastectomy irradiation targeting the chest wall and third field regional nodes. Third field regional nodes refer to level III axillary and supraclavicular lymph node regions. None of these patients developed chest wall or axillary recurrence during the follow-up period. Among the 15 patients who did not undergo post-mastectomy irradiation, eight (53.3%) had micrometastatic SLNs and six (40.0%) had macrometastatic SLNs. There were two recurrences (13.3%). First, a 38-year-old patient with one macrometastatic SLN developed ipsilateral chest wall recurrence 4 years after the index operation; this recurrence was managed by a second operation. Second, a patient with two macrometastatic SLNs refused adjuvant systemic treatment and died of breast cancer&dash;related distant metastases. One hundred and ten patients in the mastectomy group (98.2%) received adjuvant systemic treatment: 10 patients (8.9%) required chemotherapy only, 22 patients (19.6%) required hormonal treatment only, and 78 patients (69.6%) required both of these treatments. Seven patients (6.3%) in the mastectomy group developed distant recurrence, and there were three (2.7%) breast cancer–related deaths.
 
In the breast-conserving treatment group, 58 of the 59 patients underwent adjuvant whole-breast irradiation; 61.0% of these patients underwent additional third field nodal irradiation. Fifty-eight patients (98.3%) in the breast-conserving treatment group received adjuvant systemic treatment involving hormonal therapy and/or chemotherapy. Three patients (5.1%) had distant recurrence; among them, one (1.7%) died at 39 months after the initial diagnosis. One patient experienced ipsilateral breast recurrence at 30 months and underwent completion mastectomy.
 
Discussion
The favourable oncological results of the ACOSOG Z0011 trial1 2 have challenged the conventional approach of performing completion ALND in patients with SLN metastases. Patients with one or two SLN metastases who underwent breast-conserving surgery, whole-breast irradiation, and adjuvant systemic treatment could safely forgo completion ALND. This paradigm shift has led to substantial de-escalation of axillary surgery worldwide.5 A meta-analysis by Schmidt-Hansen et al,21 which involved 2020 patients and findings from the IBCSG 23-0110 11 and the AATRM (Agència d’Avaluació de Tecnologia i Recerca Mèdiques) 048/13/200022 trials, concluded that SLNB alone was sufficient for locoregional control in early breast cancer, without adverse effects on survival.
 
Limitations of the ACOSOG Z0011 study
Despite widespread adoption of the ACOSOG Z0011 criteria, the study has been criticised in several ways. The low locoregional relapse rate of 1.5% indicates that the study was underpowered.23 Furthermore, significant deviation in the radiotherapy protocol, such that 18.9% of patients received ‘high tangents’ radiotherapy, has raised questions concerning the oncological safety of SLNB alone in patients without third field nodal irradiation.24 Combined with the insufficient numbers of mastectomy patients in the IBCSG 23-01,10 11 AMAROS,12 and AATRM 048/13/200022 trials, it has been unclear whether this non-ALND approach can be extrapolated to SLN-positive breast cancer patients who undergo mastectomy with or without radiotherapy.
 
Aggressive tumour characteristics among mastectomy patients and local or regional failure rate
In this study, we compared the clinicopathological characteristics among our mastectomy group, our breast-conserving treatment group, and the sentinel-alone arm in the original ACOSOG Z0011 study. Unsurprisingly, our mastectomy group exhibited more aggressive tumour characteristics than the sentinel-alone arm in the Western population; specifically, it had a larger tumour size, more frequent lymphovascular invasion, and a greater proportion of patients with SLN macrometastases. These differences in clinicopathological features have also been reported in Western populations. For example, Hennigs et al8 analysed a large German cohort that included 4093 SLN-positive mastectomy patients. Compared with the entire study cohort of 166 074 patients, T2 tumour and lymphovascular invasion were more commonly found in patients requiring mastectomy. Additionally, the study by Milgrom et al25 included 535 early-stage breast cancer patients with a positive SLNB and no ALND. In their mastectomy group, patients had significantly larger tumours and more frequently displayed multifocal/multicentric disease. However, these adverse pathological features among mastectomy patients did not justify a more aggressive axillary approach. Similarly, the low rates of local and regional failure observed in our cohort were consistent with previous reports, suggesting that axillary-specific treatment can be considered in this group of patients with low-volume SLN disease.25 26 27 28 Debate persists regarding the comparatively large proportions of patients with micrometastatic disease in the original ACOSOG Z0011 trial1 2 and other studies.25 26 Cowher et al29 published a retrospective analysis of patients who underwent mastectomy and conservative axillary regional excision (ie, removal of SLNs and other palpable nodes). Among 144 patients with pathological N1 disease, a small proportion (24%) had micrometastatic disease; only three axillary recurrences (2.1%) were reported.29 Notably, the low locoregional failure rate was not attributed to post-mastectomy irradiation25 26 27 28 29 or increased use of chemotherapy.26 27 28
 
Intrinsic differences in tumour characteristics between different patient populations
In our previous study, we demonstrated differences in clinical characteristics between Asian and Western populations.15 In the present study, our breast-conserving treatment group had a higher rate of clinical T2 tumours and more frequent lymphovascular invasion compared with the Western population. Similar findings were observed in Korean30 and Japanese31 studies, which revealed larger and higher-grade tumours, increased lymphovascular permeation, and more frequent SLN macrometastases. Despite these disparities, the Korean30 and Japanese31 studies both demonstrated safe application of ACOSOG Z0011 criteria in Asia, with low incidences of disease recurrence. These intrinsic differences in tumour characteristics between Eastern and Western populations have presumably reduced the gap in clinicopathological features between patients undergoing mastectomy and those undergoing breast-conserving surgery. In the head-to-head comparison between our mastectomy cohort and our breast-conserving treatment group, the only notable difference involved the mean pathological size of the invasive focus (2.2 cm vs 1.8 cm; P=0.005); the clinical tumour stage distribution did not differ (P=0.69) [Table 2]. The small difference in mean MSKCC breast cancer nomogram probability (37.1% vs 31.4%; P=0.03) could also be related to the difference in pathological size, which is one of the nine variables considered in the nomogram. Therefore, we believe that a non-ALND approach in this low-risk subset of SLN-positive mastectomy patients is acceptable.
 
Residual non–sentinel lymph node metastasis in non–axillary lymph node dissection approach
The primary concern regarding extrapolation of this non-ALND approach is the risk of undertreatment for patients with an extensive nodal burden. The original ACOSOG Z0011 trial revealed a non-SLN macrometastasis rate of 27.3% in the ALND group.1 2 The AMAROS trial also showed that 33% of patients in the ALND group had additional positive lymph nodes.12 Importantly, the axillary recurrence rate remained low in both of these studies. In our SLN-positive mastectomy and breast-conserving treatment groups, the proportions of patients with additional non-SLN metastases were 26.8% and 17.8%, respectively. Among patients undergoing adjuvant irradiation and adjuvant systemic treatment, it is likely that some non-SLN metastases do not progress to clinically detectable disease.
 
Limitations of this study
This study had several limitations. First, its retrospective design could result in recall bias and the potential for missing clinical information. Although data from the ACOSOG Z0011 trial were limited with respect to HER2 status, extracapsular extension, and multifocality, we attempted to mitigate this issue by including some of the affected variables in the comparison of our mastectomy and breast-conserving treatment groups. Second, we could not address the need for post-mastectomy irradiation among patients in this study. The value of such irradiation for breast cancer patients with <4 positive lymph nodes remains controversial. The meta-analysis by the Early Breast Cancer Trialists’ Collaborative Group,32 which included 1314 breast cancer patients with one to three positive nodes after mastectomy and ALND, suggested that radiotherapy provided oncological benefit in terms of locoregional recurrence, overall recurrence, and breast cancer mortality. However, this meta-analysis has been criticised for including some very early studies from the 1970s, in which the reported recurrence rates were much higher than rates in later studies. In 2016, a focused update by the American Society of Clinical Oncology, American Society for Radiation Oncology, and Society of Surgical Oncology acknowledged the use of post-mastectomy radiotherapy for this group of patients but recommended clinical judgement for patients with a low risk of locoregional recurrence.33 In our centre, post-mastectomy irradiation was generally administered to patients with pathological N1 disease during the study period; 86.6% of patients in the present study underwent adjuvant radiotherapy. Considering the similarities in clinicopathological features and adjuvant systemic treatment use between our SLN-positive mastectomy and breast-conserving treatment groups, we suspect that it is safe for selected low-risk SLN-positive mastectomy patients to forgo ALND through the expansion of AMAROS eligibility12 to ACOSOG Z0011–ineligible patients. Several ongoing randomised studies, such as the English POSNOC (POsitive Sentinel NOde: adjuvant therapy alone versus adjuvant therapy plus Clearance or axillary radiotherapy)34 and the Dutch BOOG 2013-07,35 are recruiting breast cancer patients who undergo mastectomy and have a maximum of two to three positive SLNs; these studies aim to compare completion axillary treatment (ALND or axillary radiotherapy) and the lack of completion axillary treatment. Additionally, the SINODAR-ONE trial36 recently published their subgroup analysis and found non-inferior overall survival and recurrence-free survival among mastectomy patients receiving SLNB and ALND. The ongoing studies are expected to provide more robust evidence concerning the optimal treatment for SLN-positive mastectomy patients.
 
Conclusion
This study demonstrated the clinicopathological similarities between SLN-positive mastectomy and breast-conserving treatment groups among breast cancer patients in Hong Kong. Cautious application of the non-ALND approach in mastectomy patients with low-volume SLN disease is reasonable, considering the low locoregional recurrence rate. However, additional research is needed to standardise the adjuvant post-mastectomy radiotherapy protocol, especially among patients who forego ALND.
 
Author contributions
Concept or design: V Man.
Acquisition of data: V Man.
Analysis or interpretation of data: V Man.
Drafting of the manuscript: Both authors.
Critical revision of the manuscript for important intellectual content: A Kwong.
 
Both authors had full access to the data, contributed to the study, approved the final version for publication, and take responsibility for its accuracy and integrity.
 
Conflicts of interest
Both authors have disclosed no conflicts of interest.
 
Declaration
This study has been presented and awarded the Young Investigator Award Best Scientific Paper in the Hong Kong Society of Breast Surgeons 5th Annual Scientific Meeting (19 September 2021, Hong Kong).
 
Funding/support
This study received no specific grant from any funding agency in the public, commercial, or not-for-profit sectors.
 
Ethics approval
This study was approved by the Institutional Review Board of The University of Hong Kong/Hospital Authority Hong Kong West Cluster, Hong Kong (Ref No.: HKU/HA HKW UW 09-045). Written informed consent was obtained from patients for all treatments, procedures, and publication.
 
References
1. Giuliano AE, Hunt KK, Ballman KV, et al. Axillary dissection vs no axillary dissection in women with invasive breast cancer and sentinel node metastasis: a randomized clinical trial. JAMA 2011;305:569-75. Crossref
2. Guiliano AE, Ballman KV, McCall L, et al. Effect of axillary dissection vs no axillary dissection on 10-year overall survival among women with invasive breast cancer and sentinel node metastasis: the ACOSOG Z0011 (Alliance) randomized clinical trial. JAMA 2017;318:918-26. Crossref
3. Lyman GH, Termin S, Edge SB, et al. Sentinel lymph node biopsy for patients with early-stage breast cancer: American Society of Clinical Oncology clinical practice guideline update. J Clin Oncol 2014;32:1365-83. Crossref
4. Gradishar WJ, Anderson BO, Balassanian R, et al. NCCN guidelines insights: breast cancer, version 1.2017. J Natl Compr Canc Netw 2017;15:433-51. Crossref
5. Camp MS, Greenup RA, Taghian A, et al. Application of ACOSOG Z0011 criteria reduces perioperative costs. Ann Surg Oncol 2013;20:836-41. Crossref
6. Delpech Y, Bricou A, Lousquy R, et al. The exportability of the ACOSOG Z0011 criteria for omitting axillary lymph node dissection after positive sentinel lymph node biopsy findings: a multicenter study. Ann Surg Oncol 2013;20:2556-61. Crossref
7. Verheuvel NC, Voogd AC, Tjan-Heijnen VC, Roumen RM. Potential impact of application of Z0011 derived criteria to omit axillary lymph node dissection in node positive breast cancer patients. Eur J Surg Oncol 2016;42:1162-8. Crossref
8. Hennigs A, Riedel F, Feißt M, et al. Evolution of the use of completion axillary lymph node dissection in patients with T1/2N0M0 breast cancer and tumour-involved sentinel lymph nodes undergoing mastectomy: a cohort study. Ann Surg Oncol 2019;26:2435-43. Crossref
9. Poodt IG, Spronk PE, Vugts G, et al. Trends on axillary surgery in nondistant metastatic breast cancer patients treated between 2011 and 2015: a Dutch population-based study in the ACOSOG-Z0011 and AMAROS era. Ann Surg 2018;268:1084-90. Crossref
10. Galimberti V, Cole BF, Zurrida S, et al. Axillary dissection versus no axillary dissection in patients with sentinel-node micrometastases (IBCSG 23-01): a phase 3 randomised controlled trial. Lancet Oncol 2013;14:297-305. Crossref
11. Galimberti V, Cole BF, Viale G, et al. Axillary dissection versus no axillary dissection in patients with breast cancer and sentinel-node micrometastases (IBCSG 23-01): 10-year follow-up of a randomised, controlled phase 3 trial. Lancet Oncol 2018;19:1385-93. Crossref
12. Donker M, van Tienhoven G, Straver ME, et al. Radiotherapy or surgery of the axilla after a positive sentinel node in breast cancer (EORTC 10981-22023 AMAROS): a randomised, multicentre, open-label, phase 3 non-inferiority trial. Lancet Oncol 2014;15:1303-10. Crossref
13. Sinnadurai S, Kwong A, Hartman M, et al. Breast-conserving surgery versus mastectomy in young women with breast cancer in Asian settings. BJS Open 2018;3:48-55. Crossref
14. Chan SW, Cheung C, Chan A, Cheung PS. Surgical options for Chinese patients with early invasive breast cancer: data from the Hong Kong Breast Cancer Registry. Asian J Surg 2017;40:444-52.Crossref
15. Man V, Lo MS, Kwong A. The applicability of the ACOSOG Z0011 criteria to breast cancer patients in Hong Kong. Chin Clin Oncol 2021;10:27. Crossref
16. Moran MS, Schnitt SJ, Giuliano AE, et al. Society of Surgical Oncology–American Society for Radiation Oncology consensus guideline on margins for breast-conserving surgery with whole-breast irradiation in stages I and II invasive breast cancer. Ann Surg Oncol 2014;21:704-16. Crossref
17. Memorial Sloan Kettering Cancer Center. Breast cancer nomogram: breast additional non-SLN metastases. Available from: https://nomograms.mskcc.org/breast/BreastAdditionalNonSLNMetastasesPage.aspx. Accessed 19 Mar 2024.
18. Gur AS, Unal B, Ozbek U, et al. Validation of breast cancer nomograms for predicting the non–sentinel lymph node metastases after a positive sentinel lymph node biopsy in a multi-center study. Eur J Surg Oncol 2010;36:30-5. Crossref
19. Kuo YL, Chen WC, Yao WJ, et al. Validation of Memorial Sloan-Kettering Cancer Center nomogram for prediction of non–sentinel lymph node metastasis in sentinel lymph node positive breast cancer patients: an international comparison. Int J Surg 2013;11:538-43. Crossref
20. Bi X, Wang Y, Li M, et al. Validation of the Memorial Sloan Kettering Cancer Center nomogram for predicting non–sentinel lymph node metastasis in sentinel lymph node–positive breast-cancer patients. Onco Targets Ther 2015;8:487-93. Crossref
21. Schmidt-Hansen M, Bromham N, Hasler E, Reed MW. Axillary surgery in women with sentinel node–positive operable breast cancer: a systematic review with meta-analyses. Springerplus 2016;5:85. Crossref
22. Solá M, Alberro JA, Fraile M, et al. Complete axillary lymph node dissection versus clinical follow-up in breast cancer patients with sentinel node micrometastasis: final results from the multicenter clinical trial AATRM 048/13/2000. Ann Surg Oncol 2013;20:120-7. Crossref
23. Huang TW, Kuo KN, Chen KH, et al. Recommendation for axillary lymph node dissection in women with early breast cancer and sentinel node metastasis: a systematic review and meta-analysis of randomized controlled trials using the GRADE system. Int J Surg 2016;34:73-80. Crossref
24. Jagsi R, Chadha M, Moni J, et al. Radiation field design in the ACOSOG Z0011 (Alliance) trial. J Clin Oncol 2014;32:3600-6. Crossref
25. Milgrom S, Cody H, Tan L, et al. Characteristics and outcomes of sentinel node–positive breast cancer patients after total mastectomy without axillary-specific treatment. Ann Surg Oncol 2012;19:3762-70. Crossref
26. FitzSullivan E, Bassett RL, Kuerer HM, et al. Outcomes of sentinel lymph node–positive breast cancer patients treated with mastectomy without axillary therapy. Ann Surg Oncol 2017;24:652-9. Crossref
27. Snow R, Reyna C, Johns C, et al. Outcomes with and without axillary node dissection for node-positive lumpectomy and mastectomy patients. Am J Surg 2015;210:685-93. Crossref
28. Joo JH, Kim SS, Son BH, et al. Axillary lymph node dissection does not improve post-mastectomy overall or disease-free survival among breast cancer patients with 1-3 positive nodes. Cancer Res Treat 2019;51:1011-21. Crossref
29. Cowher MS, Grobmyer SR, Lyons J, O’Rourke C, Baynes D, Crowe JP. Conservative axillary surgery in breast cancer patients undergoing mastectomy: long-term results. J Am Coll Surg 2014;218:819-24. Crossref
30. Jung J, Han W, Lee ES, et al. Retrospectively validating the results of the ACOSOG Z0011 trial in a large Asian Z0011-eligible cohort. Breast Cancer Res Treat 2019;175:203-15. Crossref
31. Kittaka N, Tokui R, Ota C, et al. A prospective feasibility study applying the ACOSOG Z0011 criteria to Japanese patients with early breast cancer undergoing breast-conserving surgery. Int J Clin Oncol 2018;23:860-6. Crossref
32. EBCTCG (Early Breast Cancer Trialists’ Collaborative Group); McGale P, Taylor C, et al. Effect of radiotherapy after mastectomy and axillary surgery on 10-year recurrence and 20-year breast cancer mortality: meta-analysis of individual patient data for 8135 women in 22 randomised trials. Lancet 2014;383:2127-35. Crossref
33. Recht A, Comen EA, Fine RE, et al. Postmastectomy radiotherapy: an American Society of Clinical Oncology, American Society for Radiation Oncology, and Society of Surgical Oncology focused guideline update. Pract Radiat Oncol 2016;6:e219-34. Crossref
34. Goyal A, Dodwell D. POSNOC: a randomised trial looking at axillary treatment in women with one or two sentinel nodes with macrometastases. Clin Oncol (R Coll Radiol) 2015;27:692-5. Crossref
35. van Roozendaal LM, de Wilt JH, van Dalen T, et al. The value of completion axillary treatment in sentinel node positive breast cancer patients undergoing a mastectomy: a Dutch randomized controlled multicentre trial (BOOG 2013-07). BMC Cancer 2015;15:610. Crossref
36. Tinterri C, Canavese G, Gatzemeier W, et al. Sentinel lymph node biopsy versus axillary lymph node dissection in breast cancer patients undergoing mastectomy with one to two metastatic sentinel lymph nodes: sub-analysis of the SINODAR-ONE multicentre randomized clinical trial and reopening of enrolment. Br J Surg 2023;110:1143-52. Crossref

Exploration of clinical and ethical issues in an expanded newborn metabolic screening programme: a qualitative interview study of healthcare professionals in Hong Kong

Hong Kong Med J 2024 Apr;30(2):120–9 | Epub 9 Apr 2024
© Hong Kong Academy of Medicine. CC BY-NC-ND 4.0
 
ORIGINAL ARTICLE
Exploration of clinical and ethical issues in an expanded newborn metabolic screening programme: a qualitative interview study of healthcare professionals in Hong Kong
Olivia MY Ngan, PhD1,2; Ching Janice Tam, MSc (Medical Genetics), BNurs3; CK Li, MD, FRCPCH4,5
1 Medical Ethics and Humanities Unit, School of Clinical Medicine, Li Ka Shing Faculty of Medicine, The University of Hong Kong, Hong Kong SAR, China
2 Centre for Medical Ethics and Law, The University of Hong Kong, Hong Kong SAR, China
3 Faculty of Medicine, The Chinese University of Hong Kong, Hong Kong SAR, China
4 Department of Paediatrics, Faculty of Medicine, The Chinese University of Hong Kong, Hong Kong SAR, China
5 Hong Kong Hub of Paediatric Excellence, The Chinese University of Hong Kong, Hong Kong SAR, China
 
Corresponding author: Dr Olivia MY Ngan (olivian1@hku.hk)
 
 Full paper in PDF
 
Abstract
Introduction: The Newborn Screening Programme for Inborn Errors of Metabolism (NBSIEM) enables early intervention and prevents premature mortality. Residual dried bloodspots (rDBS) from the heel prick test are a valuable resource for research. However, there is minimal data regarding how stakeholders in Hong Kong view the retention and secondary use of rDBS. This study aimed to explore views of the NBSIEM and the factors associated with retention and secondary use of rDBS among healthcare professionals in Hong Kong.
 
Methods: Between August 2021 and January 2022, semi-structured interviews were conducted with 30 healthcare professionals in obstetrics, paediatrics, and chemical pathology. Key themes were identified through thematic analysis, including views towards the current NBSIEM and the retention and secondary use of rDBS.
 
Results: After implementation of the NBSIEM, participants observed fewer patients with acute decompensation due to undiagnosed inborn errors of metabolism. The most frequently cited clinical utilities were early detection and improved health outcomes. Barriers to rDBS storage and its secondary use included uncertain value and benefits, trust concerns, and consent issues.
 
Conclusion: This study highlighted healthcare professionals’ concerns about the NBSIEM and uncertainties regarding the handling or utilisation of rDBS. Policymakers should consider these concerns when establishing new guidelines.
 
 
New knowledge added by this study
  • After implementation of the Newborn Screening Programme for Inborn Errors of Metabolism, participants observed fewer patients with acute decompensation due to undiagnosed inborn errors of metabolism.
  • The obligation to know more about a child’s health and the drive for an altruistic contribution to science were factors supporting the retention of residual dried bloodspots (rDBS) for secondary research use.
  • Uncertain value and benefits of rDBS, along with concerns regarding trust, privacy, and consent, were cited as barriers to the retention of rDBS for secondary research use.
Implications for clinical practice or policy
  • The retention of rDBS requires inherent trust based on public support, with strict clinical and ethical parameters.
  • Concerns about privacy and consent issues related to genomic information should be addressed before next-generation sequencing is integrated into clinical care for newborns.
 
 
Introduction
Inborn errors of metabolism (IEM) are rare genetic diseases arising from congenital deficiencies of certain enzymes or cofactors. The accumulation of excessive toxic substances and the absence of essential metabolites may damage vital organs, impair normal metabolism, or increase risks of morbidity and mortality. A small proportion of IEM cases can be diagnosed and treated early through dietary interventions. Patients substantially benefit from early diagnosis and appropriate disease monitoring.
 
The incidence of IEM in Hong Kong is 1 in 1682 newborns.1 In response to public health concerns, a territory-wide free voluntary Newborn Screening Programme for IEM (NBSIEM) was implemented for all newborns born in public birthing units, beginning in 2017.2 This programme covers 27 conditions, including severe combined immunodeficiency (SCID).3 Spots of blood are collected from newborns within 24 to 72 hours after birth, preferably following 24 hours of milk feeding, using a heel prick test; these samples are discarded after hospital laboratories perform quality control and assurance monitoring (online supplementary Table 1).
 
The materials on dried bloodspots provide clinical benefits and lifelong healthcare research opportunities that are advantageous to individuals and the population. However, the retention and use of residual DBS (rDBS) has led to controversies regarding privacy, transparency, consent, misuse of, and unauthorised access to information, unclear research purposes, and the absence of data management and governance protocols.4 Despite these concerns, it is common for rDBS to be routinely stored and used for research purposes in some regions. For example, in Denmark, a nationwide newborn screening programme was implemented in 1975; it currently screens for 17 diseases.5 Samples are stored indefinitely with consent in the Danish Newborn Screening Biobank at the State Serum Institute.6 Similarly, a programme in the Netherlands screens for 31 conditions.7 Although participation is voluntary, the participation rate has reached 99.3%.8 In the Netherlands, rDBS samples are stored for 1 year to facilitate quality control. Most samples are stored for an additional 4 years for secondary uses, such as disease-specific biomedical research and patient-specific diagnostic purposes, after the acquisition of parental consent.9 The International Society for Neonatal Screening compared national newborn screening policies, revealing great variation in programme acceptance, consent procedure, storage, and length of storage.8 The Society’s findings highlight the importance of incorporating local views during policy development.
 
Two empirical studies in Hong Kong revealed that parents were unaware of the expanded newborn screening programme and the potential value of rDBS.10 11 The secondary use of rDBS in medical and health research is well-supported, mainly on the basis of altruism. However, participation does not provide direct individual benefits. Factors contributing to parental support towards retention and secondary use of rDBS include parental consent and trust in the relevant authority. If explicit permission is obtained, parents are more willing to contribute their child’s rDBS card. An opt-out approach and broad consent for unspecified use were considered unfavourable options.11 Although multiple rDBS-focused studies in Hong Kong have included public stakeholders, few have assessed the attitudes of healthcare professionals (HCPs)12; none have been conducted since implementation of the territory-wide screening programme. To address this gap, the present study explored views of the NBSIEM and the factors associated with retention and secondary use of rDBS cards among HCPs in Hong Kong.
 
Methods
Sampling and recruitment
Semi-structured interviews were conducted among 30 HCPs in obstetrics, paediatrics, and chemical pathology practising in eight public and two private institutions in Hong Kong between August 2021 and January 2022. Purposeful sampling was used to select key stakeholders involved in the NBSIEM according to disciplines and responsibilities. Initial invitations were sent through the two local medical universities (ie, The University of Hong Kong and The Chinese University of Hong Kong) and associated hospitals. Referrals via snowballing were also performed to recruit additional participants.
 
The study inclusion criteria were academics and HCPs (eg, medical, nursing, and laboratory staff) involved in IEM-related research or clinical work. Individuals who did not meet the criteria were excluded. Overall, this study recruited participants who were involved in recruitment and counselling within the NBSIEM, laboratory data analysis and interpretation, or academic research related to IEM.
 
Each participant received a detailed description of the research. All participants gave written informed consent before taking part in the study. The second author conducted the interviews at locations convenient for participants, such as meeting rooms, offices, and coffee shops. The interview length ranged from 37 to 71 minutes. Upon completion of the interview, each participant received a supermarket voucher for HK$200.
 
Interview guide
A semi-structured topic guide was developed based on existing literature concerning newborn screening and ethical considerations (Table).4 11 12 13 14 15 Prior to data collection, the guide was reviewed by a senior paediatrician to ensure its content validity, relevance, clarity, and cultural sensitivity.
 

Table. Sample interview questions4 11 12 13 14 15
 
Data analysis
Interviews were digitally recorded, transcribed verbatim in the original language (Cantonese), and then translated into English. Transcripts were anonymised and assigned an identification code. The interviewer and another member of the research team reviewed the transcription accuracy. Two independent researchers read and coded the transcripts and audio recordings via thematic analysis, in which textual data were coded and labelled in an inductive manner. New thematic codes that did not fit into predetermined categories were created and refined, as necessary. Codes were compared and discussed among research members until a consensus was reached. Reflexivity was maintained during the discussion and data analysis process. The entire research team identified emerging themes from the early and intermediate stages of interviews, then recruited HCPs to represent each new theme until theoretical saturation was achieved (ie, no new themes emerged in the discussions and existing themes were consistently observed).
 
Results
Interviewee characteristics
Thirty HCPs were recruited and interviewed. The study sample was diverse. Among the interviewees, 15 (50.0%) were doctors and 13 (43.3%) were nurses or midwives; 13 (43.3%) worked in obstetrics and gynaecology and 13 (43.3%) worked in paediatrics; 28 worked in the public sector (93.3%); and 14 (46.7%) had >10 years of clinical experience (online supplementary Table 2). Two major thematic themes were identified, namely, views towards the current NBSIEM and views towards the retention and secondary use of rDBS. Illustrative quotations are used to support the themes.
 
Theme 1: views towards the current newborn screening programme
Perceived clinical utility
The implementation of the NBSIEM was a public health achievement, and interviewees showed a positive attitude towards the programme. Early detection and improved health outcomes were the most commonly reported clinical utility outcomes (n=21, 70.0%). Some interviewees, primarily paediatric HCPs, noted a difference between the periods before and after territory-wide test implementation. Before NBSIEM, it was not uncommon for doctors working in intensive care units to encounter cases of acute decompensation due to undiagnosed IEM. Considering the broad phenotypes involved in IEM, such conditions may not be recognised in early stages.
 
‘I have been working in the ward for ages and observed that many patients with IEM deteriorated to an irreversible stage. With this NBSIEM, we can screen out IEM cases and offer treatment. The patients achieve normal development like others. In other words, the screening helped many people.’ (Interview 25, paediatric nurse)
 
Affected families previously endured a long wait for diagnosis before the NBSIEM; there was a substantial psychological burden involved. Parental distress was observed.
 
‘From hospital admission to disease diagnosis, it takes 2 weeks. The whole process involved hospital transfer from the (suspected IEM clinic) to the specialised team at (Hong Kong) Children’s Hospital, conducting blood investigation, and making a diagnosis.’ (Interview 20, paediatric doctor)
 
Some limitations were noted, including false-positive and false-negative results, as well as call-back rates. Interviewees cited the reduction of recall caseloads as an advantage associated with implementation of second-tier tests.
 
‘It is best if we can eliminate the false-positives. To achieve this purpose, we implement aggressive second-tier testing. Our pathologists also make stringent interpretations. Without pathologists working in laboratories, clinicians can only draw reference from the pre-set levels.’ (Interview 30, pathology doctor)
 
Screening panel
The programme covers 27 conditions, including SCID.3 Interviewees generally agreed that the benefits of screening for lethal IEM conditions outweigh the costs of screening, despite the very low incidence of IEMs. When asked about their views on the current panel, interviewees emphasised that disease selection must be based on public health principles, supported by Wilson and Jungner’s screening criteria.16 Diseases in the panel should be treatable and have a high prevalence in Hong Kong.
 
‘I support the NBSIEM. I believe (the experts) came up with the 27 conditions based on robust considerations, including incidence and prevalence, availability of treatment, mortality prevention, cost-effectiveness, etc. It is beneficial to patients.’ (Interview 13, obstetrics and gynaecology doctor)
 
Healthcare professionals have encountered parents who have completed the publicly funded IEM test and selected an additional private IEM test solely based on the number of conditions. For such parents, the underlying motivation is that ‘screening more conditions is perceived to be more definitive’.
 
If I were a mother with a child, I would like to know whether my child was affected by these diseases. The more conditions the panel includes, the better. One can prevent the onset of disease. Parents are helpless when diseases occur suddenly.’ (Interview 24, obstetrics and gynaecology doctor)
 
‘Some mothers compared the list of conditions between the public and private sectors. I am talking about the difference between 26 and 30 conditions, respectively. They would rather pay out of pocket and send the baby to retake the test in the private sector.’ (Interview 16, obstetrics and gynaecology academic)
 
One paediatrician questioned whether a genetic test with a larger number of conditions contributes to enhanced parental control and confidence regarding the newborn’s health. She was aware of some urine tests available in the direct-to-consumer market that screen for so-called ‘non-diseases’—short-/branched-chain acyl-coenzyme A dehydrogenase and 3-methylcrotonyl-coenzyme A carboxylase deficiency—although such conditions do not require follow-up. She highlighted the importance of periodically reviewing conditions on the panel according to locality-specific factors, including disease prevalence, clinical sensitivity and specificity, treatment, and cost-effectiveness.
 
‘Running an analysis on a rDBS card is not difficult. What is more challenging is the post-analysis follow-up. Compared with other NBSIEMs, the United States screens for the greatest number of conditions, maybe 40, while the United Kingdom screens for five conditions. Instead of adding conditions, should we also consider taking out some (non-disease) conditions from the list?’ (Interview 27, paediatric doctor)
 
Source of information
Three HCPs (10.0%) reported that most Hospital Authority staff received NBSIEM information through departmental seminars and training sessions, which prepared them to complete the consent procedure with parents. When asked about their understanding of IEMs, knowledge levels varied among frontline staff involved in the NBSIEM. Some were uncertain what the test evaluated.
 
‘What is it (NBSIEM) testing for…? Is it checking for chromosomal defects? Or is it checking for lack of (metabolites)?’ (Interview 15, obstetrics and gynaecology nurse)
 
Some also mistakenly thought that the NBSIEM analysed genes.
 
‘It is a filter paper with some dried bloodspots, testing IEM genes.’ (Interview 29, obstetrics and gynaecology doctor)
 
Some frontline staff wanted additional information beyond the procedure. They felt unprepared for questions about the diseases, symptoms, test procedures, and care for patients with IEMs. They felt anxious or uncomfortable explaining these aspects to parents with some level of understanding.
 
‘After implementing this programme, what the patients will undergo, where they will be referred to, what to do with a confirmed diagnosis… to be honest, I learned everything from the protocol. In actual settings, parents asked many practical questions, such as “what to be cautious about during daily care”—I do not know how to answer them. These are not common diseases observed in the ward, but we are asked to counsel parents.’ (Interview 24, obstetrics and gynaecology doctor)
 
A senior doctor responsible for providing educational seminars noted that training should not be an isolated event; periodic refresher training should be provided.
 
‘We provide intensive training for nurses, all of them. (In the training), we give clear explanations, conduct videotaping (for review), and address inquiries and questions. In addition, we also plan to host refresher courses every few years. Hong Kong requires more observation before moving forward.’ (Interview 27, paediatric doctor)
 
Experience with parental counselling and consent procedure
Interviewees felt that the educational pamphlet and consent material are easy to read. During parental counselling, HCPs were prepared to answer parents’ enquiries. Most parents supported the NBSIEM. Parents wanted to identify IEM conditions in their newborns because they felt that early detection could facilitate autonomous decision-making related to their child and other family members.
 
‘I observed that most parents enrol in the NBSIEM as they would like to know sooner if their babies are affected. If a diagnosis is confirmed, we run a genetic test to predict the risk of recurrence. Only a few refuse to take part in the programme.’ (Interview 23, paediatric doctor)
 
Midwives played an important role in obtaining parental consent in antenatal clinics. Refusals of the current NBSIEM are infrequent. Five frontline staff (16.7%) involved in the recruitment process observed that only a small number of parents, who were sceptical about medical interventions or had religious affiliation–based reservations, declined to join the programme.
 
‘Some people who advocate minimal medicalisation do not consent to procedures in our hospital. For example, they refuse vaccinations and vitamin K injections.’ (Interview 10, obstetrics and gynaecology nurse)
 
Participants involved in recruitment recognised that informed consent procedures were intended to enable parents to make informed choices. The current opt-in consent approach allows HCPs to obtain explicit permission from parents. The participants observed that parents, especially Hong Kong Chinese individuals, were vocal about the patient’s right to know.
 
‘Nowadays, patients put a strong emphasis on patient’s rights, thinking that “you need my consent before carrying out a procedure".’ (Interview 5, obstetrics and gynaecology nurse)
 
In particular, six HCPs (20.0%) speculated that opt-in consent was more accepted by parents and thus easier to obtain. It provided parents with a sense of personal control by allowing them to give explicit permission. Opt-in consent has been used in many medical settings. It is more familiar to and accepted by community members with respect to studies of genetic material.
 
‘Must I choose a consent model for handling genetic materials? It would be an opt-in approach.’ (Interview 6, obstetrics and gynaecology doctor)
 
Seven HCPs (23%) felt that consent was needed because of the invasiveness of the procedure, but some HCPs felt that the procedure involved minimal harm.
 
‘(The phlebotomists) perform an invasive procedure on the infant, which may cause discomfort or pain. Opt-in is preferable to an opt-out approach. (Interview 27, paediatric doctor)
 
‘It is just a heel prick test and will not affect the baby. I cannot see the downsides (of the screening).’ (Interview 16, obstetrics and gynaecology academic)
 
Opt-in consent was perceived to be more efficient. There may be opposition to an opt-out approach. Some HCPs (n=6, 20.0%) felt that an opt-out approach would increase sample sizes and contribute to advances in medical research.
 
‘Inborn errors of metabolism would be a prevalent issue, and therefore, opt-out is better than the opt-in approach. Like an human immunodeficiency virus test with an opt-out approach, one can refuse to take the test for a valid reason. There are treatments for IEMs; opt-out is a desirable consent model.’ (Interview 24, obstetrics and gynaecology doctor)
 
One doctor pondered the adoption of different methods in obtaining informed consent because opt-in and opt-out approaches are ‘like two sides of the same coin’. He stated that the key aspect of selecting an appropriate consent approach is the parental counselling process. He also emphasised that the consent procedure is not absent from the opt-out approach and that effective communication remains important.
 
Disclosure of confirmed results of inborn errors of metabolism to affected families
When a confirmed IEM diagnosis was disclosed to an affected family, parents often felt shocked, stressed, and guilty about having an ‘abnormal’ baby. They then began to explore the financial implications; for example, some worried about treatment costs and uncertainties. Counselling is limited to discussing the diagnosis; it also includes psychological support through follow-up care involving a multidisciplinary team.
 
‘Many families were worried when they heard about the IEM diagnosis, as they knew it was a life-long condition. It is tough to handle (bad news). Their child will be different from other peers, and finances will be affected. They must self-finance the drugs.’ (Interview 28, paediatric nurse)
 
On some occasions, the NBSIEM is beneficial to the newborn and has implications for the entire family. Some interviewees reported disclosing an IEM result relevant to the mother, rather than the infant. In one case, the HCP informed the involved family members and provided follow-up care for the newborn’s siblings.
 
‘Sometimes, a secondary finding is related to the mother instead of the child. When maternal blood contamination is present (the baby is not affected), the mother is referred to relevant specialists for medical follow-up.’ (Interview 23, paediatric doctor)
 
‘We had a positive result for citrullinemia deficiency. The newborn had three brothers and a sister with the same disease. Now we are following them.’ (Interview 27, paediatric doctor)
 
Theme 2: acceptance of retention and secondary use of residual dried bloodspots
Motivations for storage
Interviewees were asked about their views of rDBS storage. Healthcare professionals supported the long-term storage of rDBS through the NBSIEM to facilitate advances in public health epidemiology, forensic purposes, familial disease analysis, and development of other screening tests. Some HCPs highlighted the importance of rDBS in supporting scientific advances. Stored rDBS could be used to enhance healthcare management and clinical testing, such as establishment of local reference standards.
 
‘We did not know how to define the cut-off values at first. Within the United States, the cut-off values differ by state. The initial cut-off values we chose may not reflect local needs. Residual dried bloodspots (storage) is essential to develop a large data pool that supports a control pool when technology advances.’ (Interview 19, pathology doctor)
 
Healthcare professionals observed that most parents demonstrated substantial interest in knowledge about their children. They thought that parents would like to have the right to obtain medical information regarding their children.
 
‘I believe that most parents would agree to save (their) genetic material...perhaps... they would not mind if the laboratory preserved the DNA material and let them know the findings of future screening tests.’ (Interview 17, paediatric doctor)
 
Barriers to storage
Uncertain value of retention
Four HCPs (13.3%) were worried that the public lacked an understanding of how rDBS could generate knowledge. This lack of awareness may be linked to an unwillingness among parents to permit the use of their children’s rDBS samples.
 
‘Many laypeople may not understand why they should engage in research studies. They may be reluctant to take part in research studies due to their own beliefs.’ (Interview 3, obstetrics and gynaecology nurse)
 
Two-fifths of HCPs (n=12) questioned the need for the long-term storage programme.
 
‘Several ongoing studies on population genetics use a wide-consent approach, supported by government funding. Does every newborn have to provide data (to support this research)? I doubt it.’ (Interview 18, paediatric doctor)
 
‘With strong opposition, I dissent to the storage (of rDBS) as I see no value at all. Perhaps it offers convenience for research, but it provides no personal benefits.’ (Interview 30, pathology doctor)
 
Interviewees believed that genetic material is very stable and does not easily degrade, despite long storage periods. Although storage is possible, some concerns were raised about its cost-effectiveness.
 
‘I heard researchers (scientists) mention that proper sample storage incurs a considerable cost.’ (Interview 13, obstetrics and gynaecology doctor)
 
No direct benefit to patients or parents
Around one-fourth of HCPs (n=7, 23.3%) would only support clinical research if the findings could be used to help their children and patients. Parents were not expected to be interested in research, especially if it did not provide direct clinical benefit to their children.
 
‘Parents care about whether the disease can be treated or not. Knowledge of disease aetiology is only relevant to public health or research institutes.’ (Interview 2, obstetrics and gynaecology nurse)
 
‘Would I receive the data if I donated a sample? I would donate a sample if the researcher would return the data. I must know every single conclusion or diagnosis from data generated using the rDBS. I would refuse if no data were returned.’ (Interview 13, obstetrics and gynaecology doctor)
 
Trust and privacy concerns regarding responsible authorities
Another recurring theme was trust in the context of primary privacy concerns, such as data leakage and misuse of private information generated from sensitive genetic materials.
 
‘It may not be desirable to store (genetic materials) for a long time. The longer it is stored, the more concerns arise. Immediate disposal would be more reassuring in terms of the protection of privacy.’ (Interview 12, paediatric nurse)
 
‘Some people may steal genetic information (rDBS cards) for illegal (or unauthorised) purposes.’ (Interview 12, paediatric nurse)
 
Obligation to return research findings
Generally, around 30% of the interviewed doctors and researchers (n=9) believed they have a duty to warn research participants upon finding abnormalities, enabling parents to take appropriate action after receiving relevant test results, including secondary findings.
 
There is an obligation to inform the patients (of medically actionable findings) because we work in this profession. First, we do no harm. If a significant finding warrants medical attention, we should be responsive and responsible.’ (Interview 24, obstetrics and gynaecology doctor)
 
Issues with obtaining consent for storage purposes
The importance of consent was acknowledged, but there was disagreement concerning the need for broad or specific consent. Interviewees frequently noted that broad consent is convenient for researchers.
 
‘Our understanding of IEMs or diagnostic tests increases as time goes by. The advantage of broad consent is that we do not need to obtain consent when new technology evolves. Like the recently added SCID, we do not need to redesign or implement a new consent procedure again when adding new conditions to the panel.’ (Interview 9, paediatric doctor)
 
Despite the view that broad consent may permit more efficient use of biospecimens and relevant data, there were concerns about public acceptance. Some interviewees stated that it would be challenging to obtain consent for all future research and explain the need for a change in consent approach.
 
‘Broad consent implies uncertainty in the research scope, which leads to parental concern. Parents are uncertain how the rDBS will be used or handled. I feel uneasy during counselling. I am not sure how their blood will be used in a research project, but in short, it will be helpful.’ (Interview 7, paediatric doctor)
 
‘Broad consent entails an unknown. As such, parents might be unwilling to sign the consent form (and contribute the rDBS).’ (Interview 27, paediatric doctor)
 
For HCPs, the legitimacy and scope of consent are key considerations. Specific consent is commonly exercised in clinical or research procedures in Hong Kong. It is recognised as the most appropriate procedure because it ensures patients receive information about the study. A few interviewees mentioned that no existing framework recommends the use of broad consent; thus, they favoured the use of specific consent.
 
‘Specific consent may not provide sufficient coverage of all possible research. If there is a breach in the protocol, it may bring about ethical and legal issues.’ (Interview 26, obstetrics and gynaecology doctor)
 
‘I found that specific consents were more protective for HCPs.’ (Interview 15, obstetrics and gynaecology nurse)
 
‘I have never sought ethical approval for broad consent from institutional research boards.’ (Interview 28, paediatric nurse)
 
The level of public knowledge regarding the NBSIEM requires further analysis. Education and counselling might be intended to address problems that arise from long-term storage. One doctor emphasised that proper counselling on tests involving genetic material should be considered best practice. Some interviewees expressed a desire to prepare themselves to address parents’ concerns.
 
‘The drawbacks of the NBSIEM should be discussed, apart from privacy and personal genetic information. Parents should be aware that there are many unknowns in genetics. (As medical professionals) we have, of course, fewer concerns. Suppose I have to conduct genetic counselling for an IEM test. In that case, I will cover all the aspects, including the basic understanding of genetics, even if it is a selected target gene panel. I do not see much difference in terms of counselling across all forms of genetic tests.’ (Interview 9, paediatric doctor)
 
Discussion
This study explored the voices of HCPs from various backgrounds and discussed clinical and ethical issues during the early implementation phase of the NBSIEM. Similar to professionals in the United Kingdom,13 HCPs in Hong Kong did not exhibit extensive knowledge and awareness of IEM conditions, which may have detrimental effects on patient-centred care. First, parental autonomy might be undermined because parents are not adequately informed about the test procedure and conditions. Second, a lack of understanding regarding IEMs can lead to suboptimal clinical care. Children with IEMs attend multiple specialist clinics to manage multiple co-morbidities. Caregivers encounter difficulties, such as miscommunication or inconsistent information about medications or dietary restrictions, when attending non–IEM-specific clinics.14 They face numerous psychosocial challenges in caring for their children,15 17 and increased awareness of these stressors among healthcare providers could improve communication for the entire family. More than four-fifths of individuals in Hong Kong attend medical services at public hospitals,18 and many parents are expected to participate in the NBSIEM. The establishment of training or educational interventions and a centralised pipeline to coordinate care are essential considerations for patient-centred care that focuses on caregivers of children with IEMs. Because hospitals are expanding screening for other uncommon disorders, such as SCID,19 the results of the present study may inform the development of a family-oriented framework for IEM management.
 
Development of the current NBSIEM was based on a stringent infrastructure and second-tier testing pipeline.20 Samples with borderline or ambiguous results were sent for further genetic tests to confirm the diagnosis and carrier status. Carnitine deficiency, citrin deficiency, methylmalonic acidaemia, and glutaric aciduria type I are examples of diseases with relatively high incidences of false-positives or false-negatives.1 21 After the implementation of stringent second-tier tests, the recall rate has declined to 0.3% to 0.4%, similar to the standards of international IEM programmes.22 This work has been successful, and the retention of rDBS to create a large-scale genetic biobank will be the next focus of public health dialogue.
 
It is important to note that territory-wide biobanks are not common; biobank platforms in Hong Kong currently are operated by individual hospitals or institutions. A notable example is Children of 1997, a population-based birth cohort study of local infants.23 Other existing platforms include disease-oriented biobanks,24 which support quality assurance and conduct epidemiology studies; they also identify risk factors, novel molecular markers, and genetic variants associated with diabetes and related complications. The establishment of biobanks at separate institutions has led to non-standardised informed consent practices. Many ethical and legal issues remain unresolved in efforts to harmonise all regional biobanks. Public awareness of the value of rDBS has been low11; improvements in public acceptance and engagement are needed for broad support of rDBS storage or biobanks.
 
The present study highlighted common ethical, legal, and social concerns as barriers to the storage of rDBS. Trust and low awareness of the potential value of rDBS were cited as primary barriers. In contrast to the assumptions of HCPs, parents generally agree with academic researchers and doctors accessing their children’s rDBS and health data after explicit consent has been provided.11 The optimal consent model for the use of rDBS outside of screening purposes depends on cultural and social characteristics that vary among regions. In the past three decades, some countries have stored rDBS without consent, leading to public controversy and lawsuits.25 Considering these situations, the retention of rDBS requires inherent trust based on public support, with strict clinical and ethical parameters. Essential factors in establishing trust are consent to participate in the NBSIEM, as well as consent for rDBS retention and secondary uses; questions remain regarding the optimal approach to obtaining consent.25 Other factors involved in decision-making concerning rDBS retention and secondary uses include timing of consent, adequate communication and discussion of potential uses, protection of privacy, and responsible governance.9 11 26 These factors should be considered in public policy initiatives.
 
Concerns about privacy issues and discrimination related to genomic information will be amplified as next-generation sequencing is integrated into clinical care for newborns.27 28 In South Korea, next-generation DNA sequencing has been evaluated for use in primary newborn screening.29 In the United Kingdom, Genomics England plans to offer whole-genome sequencing to newborns, identifying actionable genetic conditions that may impact infants in early childhood.30 There is evidence that sequencing data provides information about conditions not currently assessed in newborns, as well as information with unclear clinical significance.29 The previous regime agreed that it was appropriate to disclose incidental research findings if they would directly benefit the child after considering risk and benefit. However, this approach may differ in cultural and social settings when considering the child’s future and non-therapeutic genomic information.
 
Limitations and strengths of the study
Most participants in this study were HCPs working in the public sector; they may have different views regarding clinical utility, value, and perceived cost-benefit, compared with stakeholders from other healthcare settings. However, this study used various sampling strategies to recruit a heterogeneous group of HCPs with diverse specialities, roles, and responsibilities in the screening programme, as well as years of experience. A longitudinal study would provide long-term insights concerning the NBSIEM. Knowledge of heterogeneous IEMs and perception of rDBS storage among HCPs could be analysed via quantitative methods.
 
Conclusion
This study highlighted HCPs’ concerns about the NBSIEM and uncertainties regarding the handling or utilisation of rDBS. Policymakers should consider these concerns when establishing new guidelines. Future investigations should explore parents’ experiences with screening for rare metabolic conditions and communication of positive results.
 
Author contributions
Concept or design: OMY Ngan.
Acquisition of data: CJ Tam.
Analysis or interpretation of data: All authors.
Drafting of the manuscript: OMY Ngan, CJ Tam.
Critical revision of the manuscript for important intellectual content: CK Li.
 
All authors had full access to the data, contributed to the study, approved the final version for publication, and take responsibility for its accuracy and integrity.
 
Conflicts of interest
All authors declared no conflicts of interest.
 
Acknowledgement
The authors thank all healthcare professionals who participated in the study.
 
Funding/support
This research was supported by the Direct Grant for Research from the Faculty of Medicine at The Chinese University of Hong Kong (2020/2021) [Ref No.: 2020.081]. The funder had no role in study design, data collection/analysis/interpretation or manuscript preparation.
 
Ethics approval
The research was approved by the Survey and Behavioural Research Ethics Committee of The Chinese University of Hong Kong (Ref No.: SBRE-20-846). All participants provided written consent for interview and publication of the study.
 
Supplementary material
The supplementary material was provided by the authors and some information may not have been peer reviewed. Any opinions or recommendations discussed are solely those of the author(s) and are not endorsed by the Hong Kong Academy of Medicine and the Hong Kong Medical Association. The Hong Kong Academy of Medicine and the Hong Kong Medical Association disclaim all liability and responsibility arising from any reliance placed on the content.
 
References
1. The Task Force on the Pilot Study of Newborn Screening for Inborn Errors of Metabolism. Evaluation of the 18-month “Pilot Study of Newborn Screening for Inborn Errors of Metabolism” in Hong Kong. Hong Kong J Paediatr (new series) 2020;25:16-22.
2. Belaramani KM, Chan TC, Hau EW, et al. Expanded newborn screening for inborn errors of metabolism in Hong Kong: results and outcome of a 7-year journey. Int J Neonatal Screen 2024;10:23. Crossref
3. Hospital Authority. Newborn Screening Programme for Inborn Errors of Metabolism (IEM). October 2023. Available from: https://www21.ha.org.hk/smartpatient/SPW/MediaLibraries/SPW/SPWMedia/Education-pamphlet_NBS-IEM_Eng-(Oct-2023).pdf?ext=.pdf. Accessed 27 Mar 2024.
4. Ngan OM, Li CK. Ethical issues of dried blood spot storage and its secondary use after newborn screening programme in Hong Kong. Hong Kong J Paediatr (new series) 2020;25:8-15.
5. Lund A, Wibrand F, Skogstrand K, et al. Danish expanded newborn screening is a successful preventive public health programme. Dan Med J 2020;67:A06190341.
6. Nordfalk F, Ekstrøm CT. Newborn dried blood spot samples in Denmark: the hidden figures of secondary use and research participation. Eur J Hum Genet 2019;27:203-10. Crossref
7. Jansen ME, Klein AW, Buitenhuis EC, Rodenburg W, Cornel MC. Expanded neonatal bloodspot screening programmes: an evaluation framework to discuss new conditions with stakeholders. Front Pediatr 2021;9:635353. Crossref
8. Loeber JG, Platis D, Zetterström RH, et al. Neonatal screening in Europe revisited: an ISNS perspective on the current state and developments since 2010. Int J Neonatal Screen 2021;7:15. Crossref
9. Jansen ME, van den Bosch LJ, Hendriks MJ, et al. Parental perspectives on retention and secondary use of neonatal dried bloodspots: a Dutch mixed methods study. BMC Pediatr 2019;19:230. Crossref
10. Mak CM, Lam CW, Law CY, et al. Parental attitudes on expanded newborn screening in Hong Kong. Public Health 2012;126:954-9. Crossref
11. Hui LL, Nelson EA, Deng HB, et al. The view of Hong Kong parents on secondary use of dried blood spots in newborn screening program. BMC Med Ethics 2022;23:105. Crossref
12. Mak CM, Law EC, Lee HH, et al. The first pilot study of expanded newborn screening for inborn errors of metabolism and survey of related knowledge and opinions of health care professionals in Hong Kong. Hong Kong Med J 2018;24:226-37. Crossref
13. Moody L, Atkinson L, Kehal I, Bonham JR. Healthcare professionals’ and parents’ experiences of the confirmatory testing period: a qualitative study of the UK expanded newborn screening pilot. BMC Pediatr 2017;17:121. Crossref
14. Siddiq S, Wilson BJ, Graham ID, et al. Experiences of caregivers of children with inherited metabolic diseases: a qualitative study. Orphanet J Rare Dis 2016;11:168. Crossref
15. Zeltner NA, Landolt MA, Baumgartner MR, et al. Living with intoxication-type inborn errors of metabolism: a qualitative analysis of interviews with paediatric patients and their parents. JIMD Rep 2017;31:1-9. Crossref
16. Petros M. Revisiting the Wilson–Jungner criteria: how can supplemental criteria guide public health in the era of genetic screening? Genet Med 2012;14:129-34. Crossref
17. Grant S, Cross E, Wraith JE, et al. Parental social support, coping strategies, resilience factors, stress, anxiety and depression levels in parents of children with MPS III (Sanfilippo syndrome) or children with intellectual disabilities (ID). J Inherit Metab Dis 2013;36:281-91. Crossref
18. Hospital Authority. Hospital Authority Strategic Plan 2022-2027: Towards Sustainable Healthcare. Available from: https://www.ha.org.hk/haho/ho/ap/HA_StrategicPlan2022-2027_Eng_211216.pdf. Accessed 16 Dec 2021.
19. Leung D, Lee PP, Lau YL. Review of a decade of international experiences in severe combined immunodeficiency newborn screening using T-cell receptor excision circle. Hong Kong J Paediatr (new series) 2020;25:30-41.
20. Tsang KY, Chan TC, Yeung MC, Wong TK, Lau WT, Mak CM. Validation of amplicon-based next generation sequencing panel for second-tier test in newborn screening for inborn errors of metabolism. J Lab Med 2021;45:267-74. Crossref
21. Hennermann JB, Roloff S, Gellermann J, Grüters A, Klein J. False-positive newborn screening mimicking glutaric aciduria type I in infants with renal insufficiency. J Inherit Metab Dis 2009;32 Suppl 1:S355-9. Crossref
22. la Marca G. Mass spectrometry in clinical chemistry: the case of newborn screening. J Pharm Biomed Anal 2014;101:174-82. Crossref
23. Schooling CM, Hui LL, Ho LM, Lam TH, Leung GM. Cohort profile: ‘Children of 1997’: a Hong Kong Chinese birth cohort. Int J Epidemiol 2012;41:611-20. Crossref
24. Ng IH, Cheung KK, Yau TT, Chow E, Ozaki R, Chan JC. Evolution of diabetes care in Hong Kong: from the Hong Kong Diabetes Register to JADE-PEARL Program to RAMP and PEP Program. Endocrinol Metab (Seoul) 2018;33:17-32. Crossref
25. Cunningham S, O’Doherty KC, Sénécal K, Secko D, Avard D. Public concerns regarding the storage and secondary uses of residual newborn bloodspots: an analysis of print media, legal cases, and public engagement activities. J Community Genet 2015;6:117-28. Crossref
26. Hendrix KS, Meslin EM, Carroll AE, Downs SM. Attitudes about the use of newborn dried blood spots for research: a survey of underrepresented parents. Acad Pediatr 2013;13:451-7. Crossref
27. Pereira S, Robinson JO, Gutierrez AM, et al. Perceived benefits, risks, and utility of newborn genomic sequencing in the BabySeq project. Pediatrics 2019;143(Suppl 1):S6-13. Crossref
28. Johnston J, Lantos JD, Goldenberg A, et al. Sequencing newborns: a call for nuanced use of genomic technologies. Hastings Cent Rep 2018;48 Suppl 2:S2-6. Crossref
29. Woerner AC, Gallagher RC, Vockley J, Adhikari AN. The use of whole-genome and exome sequencing for newborn screening: challenges and opportunities for population health. Front Pediatr 2021;9:663752. Crossref
30. Biesecker LG, Green ED, Manolio T, Solomon BD, Curtis D. Should all babies have their genome sequenced at birth? BMJ 2021;375:n2679. Crossref

Pages