Hong Kong Med J 2024 Jun;30(3):202–8 | Epub 29 May 2024
© Hong Kong Academy of Medicine. CC BY-NC-ND 4.0
ORIGINAL ARTICLE
Changes in cardiovascular disease risk predicted by the Framingham risk model in the Hong Kong population between 2003-2005 and 2014-2015: data from Population Health Surveys
Brian YC Sung, MB, BS1; Eric HM Tang, BSc2; Laura Bedford, BSc2; Carlos KH Wong, MPhil, PhD2,3; Emily TY Tse, MB, BS, FHKAM (Family Medicine)2; Esther YT Yu, MB, BS, FHKAM (Family Medicine)2; Bernard MY Cheung, MB, BChir, PhD1; Cindy LK Lam, MB, BS, MD2
1 Department of Medicine, The University of Hong Kong, Hong Kong SAR, China
2 Department of Family Medicine and Primary Care, The University of Hong Kong, Hong Kong SAR, China
3 Department of Pharmacology and Pharmacy, The University of Hong Kong, Hong Kong SAR, China
Corresponding author: Prof Bernard MY Cheung (mycheung@hku.hk)
 Full paper in PDF
Abstract
Introduction: The Framingham risk model estimates
a person’s 10-year cardiovascular disease (CVD) risk.
This study used this model to calculate the changes
in sex- and age-specific CVD risks in the Hong
Kong Population Health Survey (PHS) 2014/15
compared with two previous surveys conducted
during 2003 and 2005, namely, PHS 2003/2004 and
Heart Health Survey (HHS) 2004/2005.
Methods: This study included individuals aged 30 to
74 years from PHS 2014/15 (n=1662; n=4 445 868
after population weighting) and PHS 2003/2004 and
HHS 2004/2005 (n=818; n=3 495 074 after population
weighting) with complete data for calculating the
risk of CVD predicted by the Framingham model.
Sex-specific CVD risks were calculated based on
age, total cholesterol and high-density lipoprotein
cholesterol levels, mean systolic blood pressure,
smoking habit, diabetic status, and hypertension
treatment. Mean sex- and age-specific CVD risks
were calculated; differences in CVD risk between the
two surveys were compared by independent t tests.
Results: The difference in 10-year CVD risk from
2003-2005 to 2014-2015 was not statistically
significant (10.2% vs 10.6%; P=0.29). After age
standardisation according to World Health
Organization world standard population data, a small
decrease in CVD risk was observed, from 9.4% in
2003-2005 to 8.8% in 2014-2015. Analysis according
to age-group showed that more participants aged 65 to 74 years were considered high risk in 2003
to 2005 (2003-2005: 66.8% vs 2014-2015: 53.1%;
P=0.028). This difference may be due to the decrease
in smokers among men (2003-2005: 30.5% vs 2014-2015: 24.0%; P<0.001).
Conclusion: From 2003-2005 to 2014-2015, there
was a small decrease in age-standardised 10-year
CVD risk. A holistic public health approach
simultaneously targeting multiple risk factors is
needed to achieve greater decreases in CVD risk.
New knowledge added by this study
- The stagnation in 10-year cardiovascular disease (CVD) risk between 2003 and 2015 suggests that despite improvements in treatment, more effective prevention strategies (eg, improvements in diet and physical activity levels) are needed.
- The effect of the decreasing number of current smokers was not strongly reflected in the change in 10-year CVD risk. This may be due to an increased prevalence of diabetes and an increased proportion of participants receiving antihypertensive medications.
- The findings suggest that the use of lipid-lowering drugs and antihypertensive medications does not effectively translate into overall cardiovascular risk reduction in the Hong Kong population, unless these treatments are simultaneously paired with prevention strategies targeting CVD risk factors.
Introduction
Cardiovascular disease (CVD) constitutes a
spectrum of diseases that affect the heart and blood
vessels. Worldwide, CVD is the leading cause of
death as well as a major cause of premature death
and chronic disability in numerous regions.1 In 2017,
CVD was responsible for an estimated 17.8 million
deaths, representing 31% of all global deaths.2
Hypertension, smoking status, hyperlipidaemia,
and diabetes mellitus are prominent risk factors for
CVD.3 The global prevalence of CVD risk factors is
increasing. Currently, an estimated 15% of the world’s
population (1.13 billion people) has hypertension,
and the prevalence is expected to increase to 29%
by 2025.4 5 Additionally, the global prevalence of
diabetes increased from 211 million in 1990 to 476
million in 2017, representing a 129.7% increase in
nearly three decades.6 The prevalences of CVD and
its risk factors are expected to continue to increase
in the near future due to industrialisation and
population ageing. Fortunately, the World Health
Organization (WHO) has estimated that premature CVD is preventable in >75% of cases, and risk factor
amelioration can help reduce the burden caused by CVD.7
The risk of CVD over the next 10 years for an
individual can be estimated using prediction models.
Cardiovascular disease risk prediction is important
at the individual and population levels. At the
individual level, CVD risk prediction allows primary
care medical professionals to identify high-risk
patients. Risk factors for CVD, such as hypertension,
can be treated accordingly to reduce the patient’s
future risk of CVD. At the population level, CVD
risk trends allow health policy planners to make
evidence-based decisions and review current public
health strategies used in CVD prevention.8
Changes in CVD risk can serve as a reference
to indicate changes in public health status within
a population. Two studies have evaluated changes
in the 10-year CVD risk in the United States (US)
population. In a study by Ajani and Ford,9 risk models
adopted by the National Cholesterol Education
Program Adult Treatment Panel III were utilised to
estimate coronary heart disease risk, rather than the
more precise Framingham formulae for estimation
of overall CVD risk. Notably, their analysis lacked
age stratification. On the other hand, Lopez-Jimenez
et al10 evaluated the changes in CVD risk between
1976 and 2004. To our knowledge, no previous study
has evaluated the change in 10-year CVD risk in an
Asian population, and insights are needed regarding
the cardiovascular health status of the population in
a more recent time period.
In this study, we aimed to calculate and
compare the changes in sex- and age-specific CVD
risks predicted by the Framingham model in a
Hong Kong general population by using the Hong
Kong Population Health Survey (PHS) 2014/15 in
combination with two previous surveys conducted
in 2003 to 2005, namely, PHS 2003/2004 and Heart
Health Survey (HHS) 2004/2005.
Methods
Study design and sampling
The data in this study were sourced from PHS
2003/200411 and PHS 2014/15.12 Population
Health Surveys are territory-wide cross-sectional
surveys conducted by the Department of Health of
the Hong Kong SAR Government. These surveys
target the land-based non-institutional population of
individuals aged ≥15 years in Hong Kong, excluding
foreign domestic helpers and visitors. Systematic
replicate sampling was adopted to select living
quarters that were representative of the Hong Kong
general population. All domestic households in the
selected living quarters and household members in
the target population were individually surveyed.
Written consent was obtained from individuals who agreed to participate in a PHS. Participants
were invited to complete a face-to-face interview,
where they provided information about their socio-demographic
characteristics, disease status, and
daily lifestyle habits. After the interview, consenting
participants aged 15 to 84 years were randomly
selected to undergo a health examination that
included physical measurements and biochemical
testing.12 Health examinations for participants of
PHS 2003/2004 were conducted as part of the HHS 2004/2005.
The STROBE (Strengthening the Reporting of
Observational Studies in Epidemiology) checklist
was followed for preparing this manuscript.
Predicted risk of cardiovascular disease over
the next 10 years
The main outcome of this study was the predicted risk
of CVD over the next 10 years among people aged 30
to 74 years. Thus far, no specific prediction models
have been developed for the Hong Kong population.
In this study, we adopted the prediction model for
primary care developed by the Framingham Heart
Study Cohort in the general adult population aged
30 to 74 years.13 The Framingham CVD risk model
was validated and can be applied to the Chinese
population, but requires recalibration in men.14 A
CVD event was defined as a composite of coronary
heart disease, cerebrovascular events, peripheral
artery disease, and heart failure in the Framingham
model. The predicted CVD risk over the next 10
years was calculated for each participant using the
following information: age, total cholesterol level,
high-density lipoprotein cholesterol level, systolic
blood pressure, use of antihypertensive medication, current smoking status, and diabetes status.
Statistical analysis
A complete-case analysis approach was utilised
in this study. Descriptive statistics were used to
present the characteristics of included individuals.
Sex- and age-specific predicted CVD risks in 2003-2005 and 2014-2015 were calculated to summarise
the change in risk according to sex and age-group.
Significant differences in the above factors between
the two PHSs were tested by independent t test or
Chi squared test, as appropriate.
To summarise results at the population level,
population weighting established by the Department
of Health was applied according to age-group and
sex for participants in each PHS. To compare results
at the population level, age-standardised predicted
CVD risk was calculated using WHO 2000-2025
world standard population data15 and the US population census data in 2000.16
All statistical analyses were performed with
SPSS software (Windows version 26.0; IBM Corp,
Armonk [NY], US). All significance tests were
two-tailed, and P values <0.05 were considered
statistically significant.
Results
In total, 1662 and 818 participants were included in
the PHS 2014/15 cohort and the PHS 2003/2004
and HHS 2004/2005 cohort, respectively. These
individuals represented populations of 4 445 868
and 3 495 074, respectively. Table 1 shows the
baseline characteristics of the PHS and HHS cohorts
according to Framingham predictors. The mean age was similar in both cohorts (2003-2005: 48.6 years
vs 2014-2015: 50.8 years) and the proportions of
male and female participants were similar (female
participants in 2003-2005: 54.1% vs 2014-2015: 53.0%).
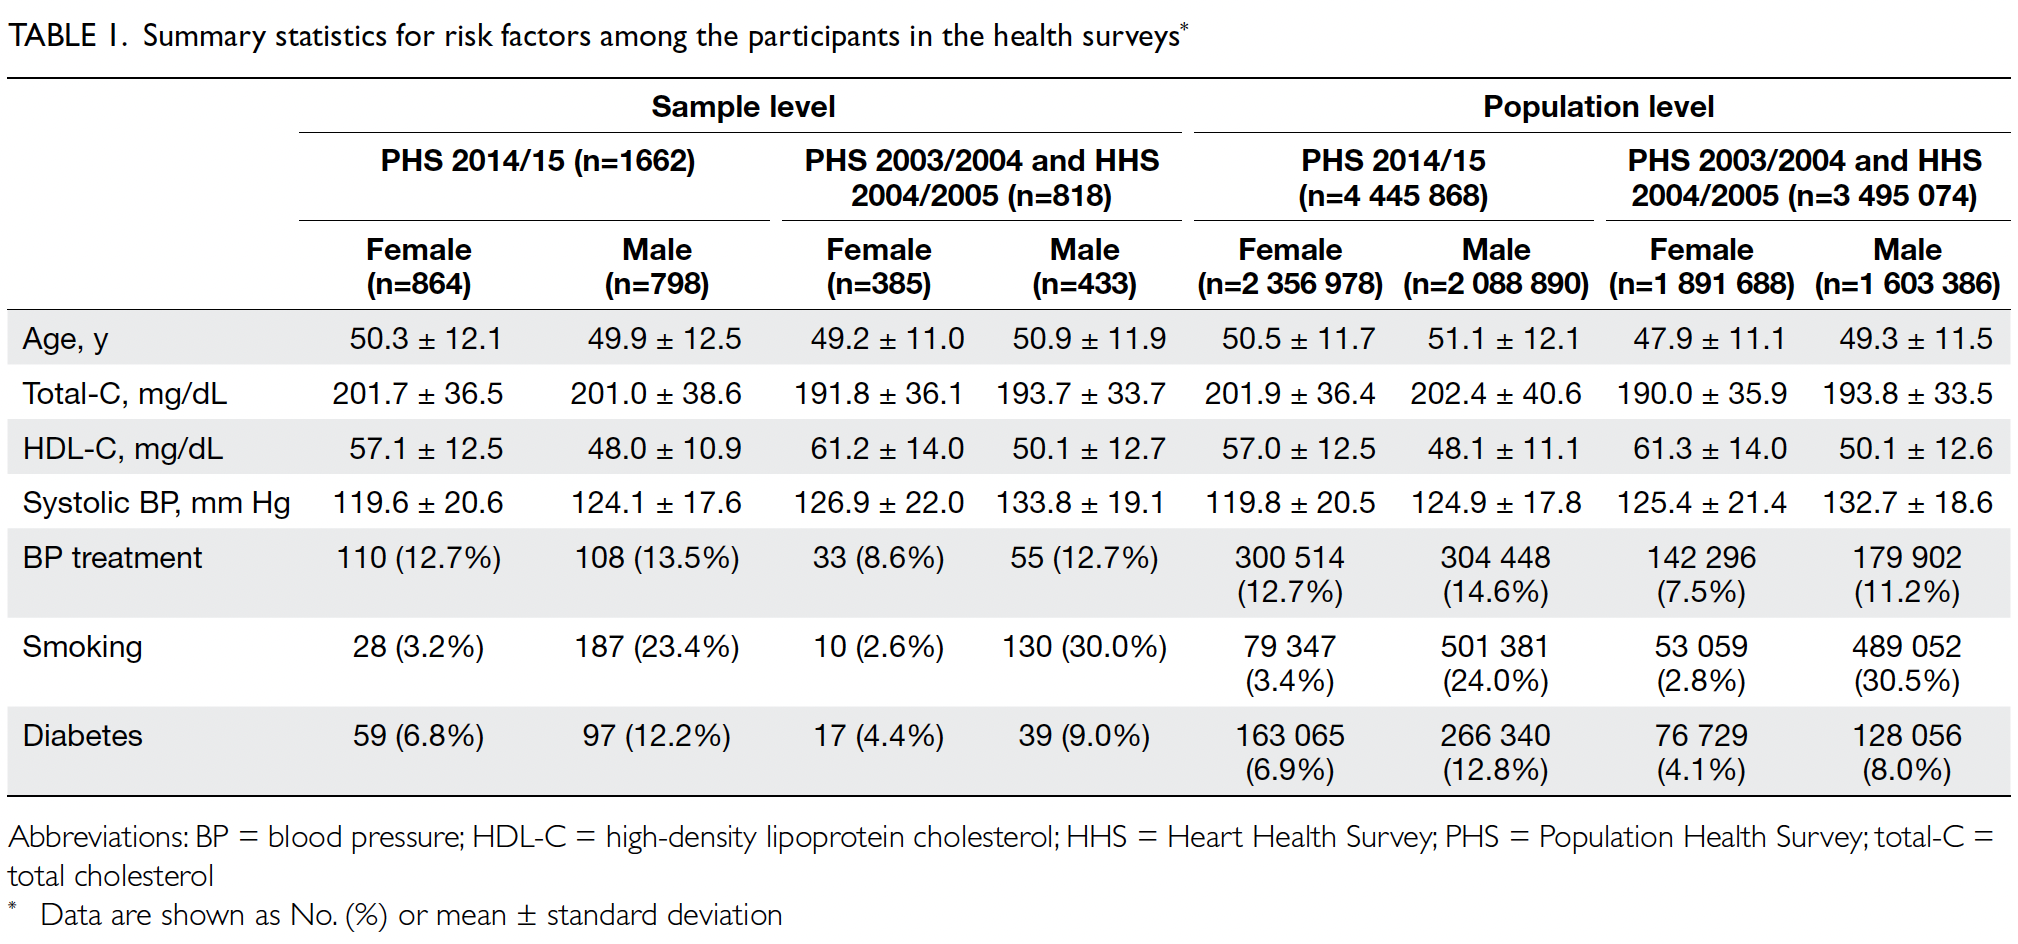
Table 1. Summary statistics for risk factors among the participants in the health surveys
Predicted CVD risk increases with age and is
higher in men (Table 2). In PHS 2003/2004 and HHS
2004/2005, the mean CVD risk increased with age
in both sexes, from 1.6% among women aged 30-44
years to 17.8% among women aged 65-74 years, and
from 5.1% among men aged 30-44 years to 33.4%
among men aged 65-74 years. Between the two
surveys, there was no significant difference in overall
10-year CVD risk (2003-2005: 10.2% vs 2014-2015:
10.6%; P=0.29). After age standardisation according
to WHO world standard population data, the age-standardised
predicted CVD risks in the 2003-2005
cohort and the 2014-2015 cohort were 9.4% and
8.8%, respectively (Table 3). The small decrease
in predicted CVD risk may be due to the decrease
in smokers among men (30.5% vs 24.0%; P<0.001)
[Table 1].
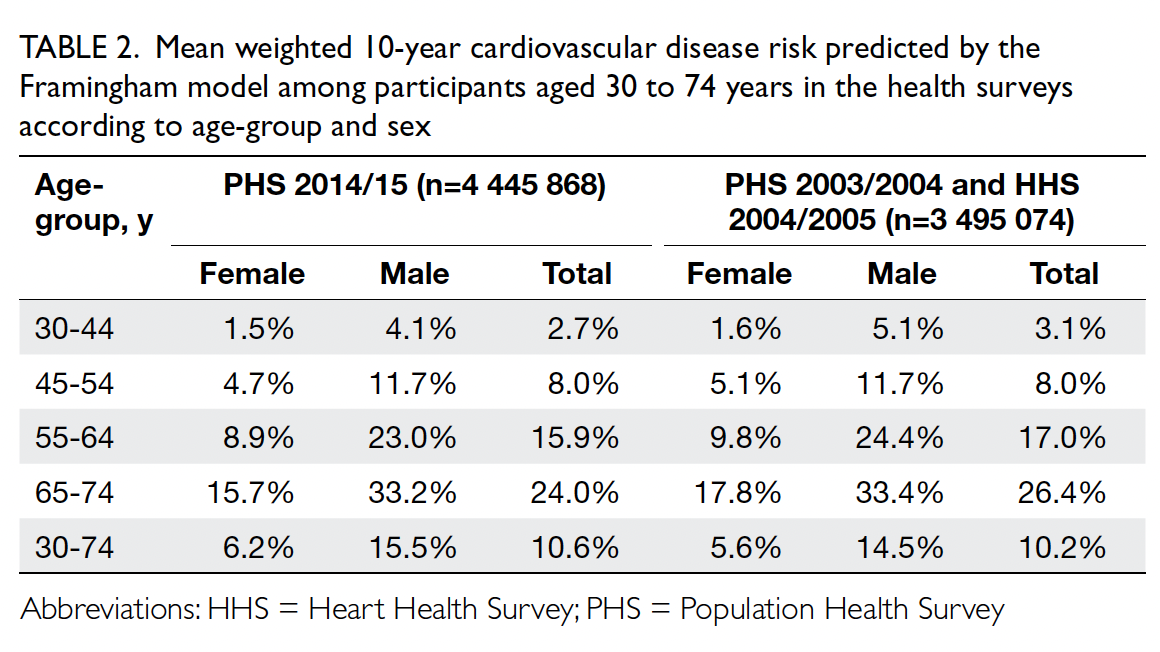
Table 2. Mean weighted 10-year cardiovascular disease risk predicted by the Framingham model among participants aged 30 to 74 years in the health surveys according to age-group and sex
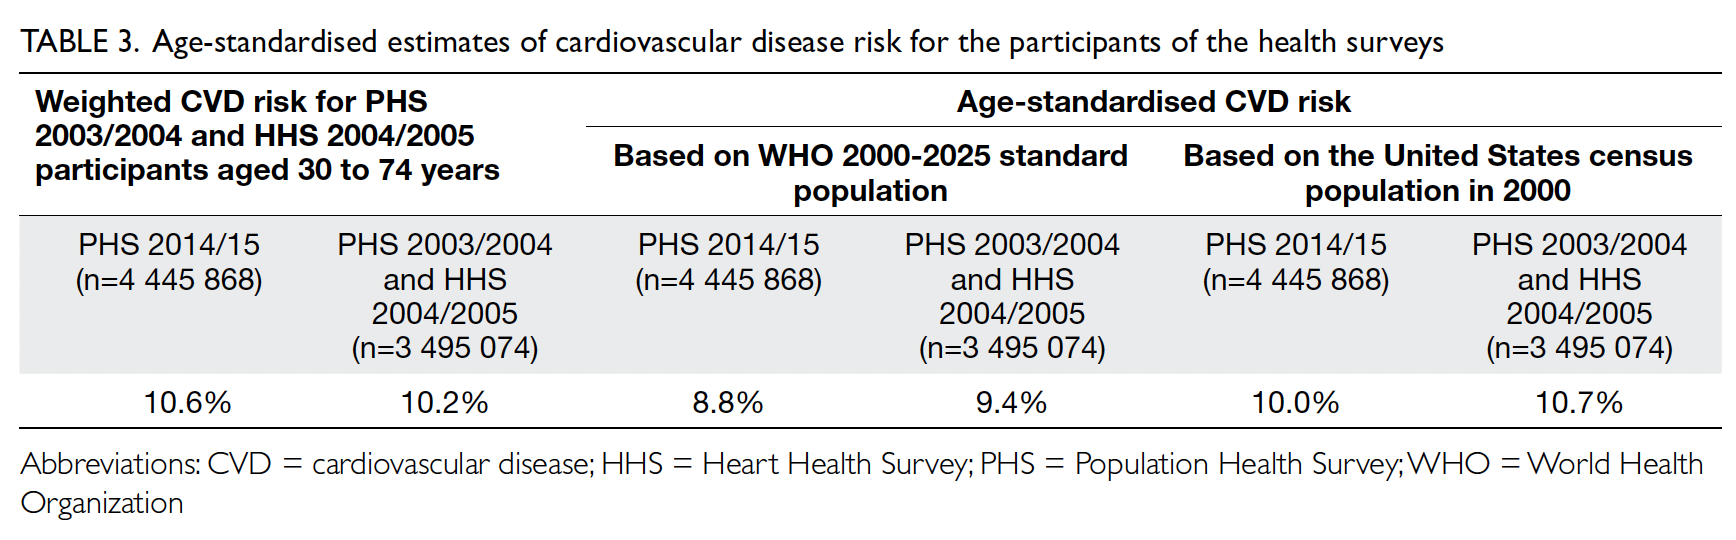
Table 3. Age-standardised estimates of cardiovascular disease risk for the participants of the health surveys
The risk of cardiovascular events over the
next 10 years was classified as low (CVD risk <10%),
medium (CVD risk ≥10% and <20%), and high (CVD
risk ≥20%); the distributions of risk groups are
presented in Table 4. Among participants aged 30 to 74 years, the risk group distributions were similar
in both cohorts. When analysed according to sex,
29.1% of men and 5.1% of women were classified
as high-risk in PHS 2014/15, whereas 28.2% of
men and 6.4% of women were classified as high-risk
in PHS 2003/2004 and HHS 2004/2005. When
analysed according to age-group, more participants
aged 65 to 74 years were classified as high-risk in
PHS 2003/2004 and HHS 2004/2005 (66.8% vs 2014-2015: 53.1%; P=0.028).
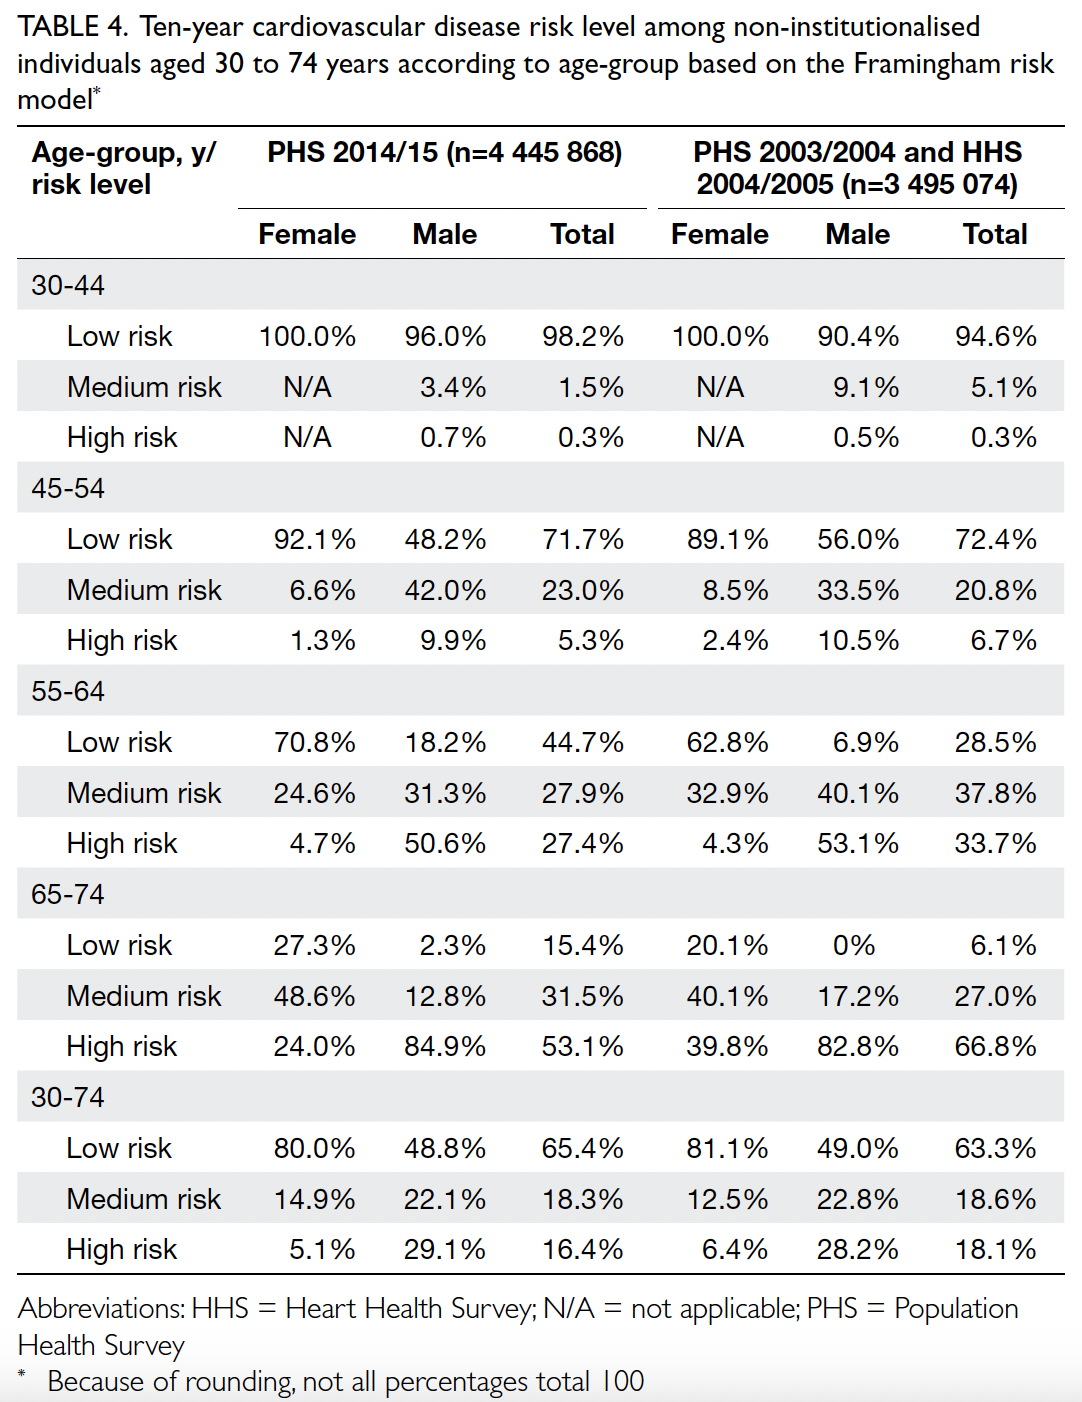
Table 4. Ten-year cardiovascular disease risk level among non-institutionalised individuals aged 30 to 74 years according to age-group based on the Framingham risk model
Discussion
Using representative samples from the Hong Kong
PHS and HHS, we found that the 10-year CVD
risk increases with age and is consistently higher
in men (men: 15.5% vs women: 6.2%; P<0.001, in
PHS 2014/15) [Table 2]. This trend is consistent
with previous reports; for example, an analysis
of NHANES (National Health and Nutrition
Examination Survey) III data showed that men have
a significantly higher CVD risk (11.8% in men vs
5.1% in women) and that CVD risk is higher in older
age-groups (16.2% for participants aged 60-74 years
vs 11.2% for participants aged 50-59 years).10 Thus,
risk management for older adults may represent a
challenge to the current health infrastructure. The
burden of CVD is directly associated with increased
morbidity and mortality in patients, and it translates
to substantial healthcare costs. In Hong Kong, the
number of people aged ≥65 years is predicted to
reach 2.58 million (35.9% of the population) by
2064.17 Thus, there is a critical need to achieve a more
comprehensive understanding of the aetiologies
associated with CVD in older adults.
The results have extensive public health
implications. Although age-standardised rates of
death from CVD in Hong Kong greatly decreased
from 93.4 per 100 000 standard population in 2001
to 56.0 per 100 000 standard population in 2017,18
there was no significant difference in overall 10-year
CVD risk between 2003-2005 and 2014-2015 (10.2%
vs 10.6%; P=0.29) [Table 2]. After age standardisation
according to WHO world standard population data, a small decrease in CVD risk was observed, from 9.4% in 2003-2005 to 8.8% in 2014-2015 [Table 3].
A study of NHANES data revealed a similar trend,
consisting of a small decrease in CVD risk from 1988
to 2004 (7.9% to 7.4%; P<0.001).10 The stagnation
in 10-year CVD risk between 2003-2005 and
2014-2015 suggests that despite improvements in
treatment, more effective prevention strategies (eg,
improvements in diet and physical activity levels)
are needed.19 Primary care intervention to manage
modifiable risk factors, such as hypertension,
dyslipidaemia, and diabetes, can complement
population-based policies. Efforts to ensure access to
appropriate healthcare and affordable medications
will help control abnormal risk factor levels.20
Furthermore, despite the importance of targeting
individual risk factors to reduce prevalence, the
long-term objective should be reduced overall risk
of CVD. This objective requires a holistic approach
simultaneously targeting multiple risk factors.
Our results highlight the need for overall risk
assessment, in addition to targeted efforts focused
on specific CVD risk factors. During the past decade,
numerous public health initiatives (eg, smoking
cessation campaigns) have been implemented to
reduce the prevalence of established risk factors for
CVD. It is reasonable to expect that CVD risk would
decrease over time in conjunction with the decreased
prevalences of various risk factors, such as the
declining number of current smokers. Surprisingly,
these changes were not strongly reflected in the
change in 10-year CVD risk. One explanation is that
decreases in the prevalence of some risk factors are
offset by increases in others. For example, population
ageing in Hong Kong may shift more adults into the
high-risk group. However, because the Framingham
model was limited to individuals aged 30 to 74 years,
the change in mean age between the two surveys
is inconsequential. Other possible changes in risk
factors include increases in the prevalence of diabetes
and hypertension, as reflected by the increased
proportion of participants receiving antihypertensive
medications (Table 1). Although CVD mortality
has considerably decreased, it is concerning that
CVD risk has not substantially diminished over the
past decade. This lack of improvement in CVD risk
may lead to an increasing community burden of
CVD in the near future, especially in the context of
population ageing.
The overall 10-year CVD risk for participants
aged 30 to 74 years in 2003-2005 after age adjustment
to US census population data in 2000 was 10.7%.
During a similar time period (1999-2004), the US
population had a 10-year CVD risk of 7.4%.10 When
Hong Kong men were stratified according to risk
group in 2014-2015, 48.8% were classified as low-risk,
22.1% were classified as medium-risk, and
29.1% were classified as high-risk (Table 4). For
comparison, among men in the United Kingdom population during 2012, 46.5% were classified as
low-risk, 39.9% were classified as medium-risk, and
13.6% were classified as high-risk using the National
Institute for Health and Care Excellence Framingham
risk model.21 In terms of risk distribution, a greater
proportion of Hong Kong men were classified as
high-risk compared with men in the United Kingdom
in the early 2010s. In terms of age-standardised risk,
the Hong Kong population had a higher 10-year
CVD risk than the US population in 2003.
Analysis according to age showed that the
proportion of low-risk participants increased from
2003-2005 to 2014-2015, particularly in the age-groups
of 55-64 and 65-74 years (2003-2005: 28.5%
vs 2014-2015: 44.7% for participants aged 55-64
years, and 6.1% vs 15.4% for participants aged 65-74
years) [Table 4]. This increased proportion may be
the result of primary care clinicians recognising
age as a prominent risk factor for CVD, leading to
more aggressive treatment of modifiable risk factors.
Furthermore, there were fewer male smokers in 2014-2015 than in 2003-2005 (24.0% vs 30.5%; P<0.001) [Table 1], suggesting that the success of
recent anti-smoking campaigns also contributed to
this paradigm shift.
Contrary to a previous report addressing
changes in several CVD risk factors,22 we used the
widely validated Framingham risk model to predict
the risk of CVD. By measuring the net change in
cardiovascular risk, we more comprehensively
estimated the impacts of prevention strategies; this
is particularly important because some risk factors
worsened, some improved, and some remained
stable over time. To our knowledge, this is the first
study to evaluate the change in 10-year CVD risk in
an Asian population. The results reinforce the need
for more aggressive community-wide and clinic-based
preventions, with an emphasis on increased
exercise hours during leisure time, dietary changes
that promote higher intake of vegetables and
fruits, as well as lower intake of salt and saturated
fats, weight maintenance, and smoking cessation.
The findings also suggest that the discovery and
use of lipid-lowering drugs and antihypertensive
medications does not effectively translate into
overall risk reduction in an Asian population, unless
these treatments are simultaneously paired with
prevention strategies targeting CVD risk factors.
Strengths and limitations
This study was based on two Hong Kong population
health surveys, and thus the sample is highly
representative of the general population. Baseline
data were collected through laboratory tests and
face-to-face interviews, suggesting that these data
are highly reliable. The long interval between the
two health surveys (2003-2005 to 2014-2015) also
provides insights regarding the effectiveness of
current CVD prevention strategies. Limitations of
the current study involve its use of the Framingham
risk prediction model and the PHS and HHS. Similar
to other surveys, the PHS and HHS are susceptible
to participation bias because the sample data might
not provide an accurate representation of the overall
population. Many PHS variables are self-reported
and may lead to reporting bias. Considering the
effort required to complete the long questionnaires,
the collected data may be susceptible to non-response
bias and recall bias. Furthermore, because
the Framingham cohort primarily consisted of
Caucasians, the predicted 10-year CVD risk in
the Hong Kong population calculated using the
Framingham model should be interpreted cautiously.
The Framingham risk model was developed for
people without a history of CVD; thus, a small
proportion of the overall sample lacking a history
of CVD might have been included in the study,
causing inaccuracies in the results. Additionally, the
model may overestimate the 10-year CVD risk for men in Hong Kong,14 and a recalibrated model with
greater predictive power may be required. Although
several limitations and assumptions may hinder the
prediction of CVD risk, these potential sources of
bias were present in both surveys. Therefore, the
effects of such biases may be less important when
comparing the change in predicted 10-year CVD
risk between the two time points.
Conclusion
During the period from 2003-2005 to 2014-2015,
the change in predicted 10-year CVD risk was not
statistically significant. However, the proportion of
low-risk participants within older age-groups was
higher in PHS 2014/15 than in PHS 2003/2004 and
HHS 2004/2005. More aggressive CVD prevention
strategies and primary care interventions are needed
to address CVD risk factors.
Author contributions
Concept or design: BMY Cheung, CLK Lam.
Acquisition of data: BYC Sung, EHM Tang, BMY Cheung, CLK Lam.
Analysis or interpretation of data: BYC Sung, EHM Tang.
Drafting of the manuscript: BYC Sung, EHM Tang.
Critical revision of the manuscript for important intellectual content: L Bedford, CKH Wong, ETY Tse, EYT Yu, BMY Cheung, CLK Lam.
Acquisition of data: BYC Sung, EHM Tang, BMY Cheung, CLK Lam.
Analysis or interpretation of data: BYC Sung, EHM Tang.
Drafting of the manuscript: BYC Sung, EHM Tang.
Critical revision of the manuscript for important intellectual content: L Bedford, CKH Wong, ETY Tse, EYT Yu, BMY Cheung, CLK Lam.
All authors had full access to the data, contributed to the study, approved the final version for publication, and take responsibility for its accuracy and integrity.
Conflicts of interest
As advisers of the journal, CKH Wong and EYT Yu were not involved in the peer review process. Other authors have disclosed no conflicts of interest.
Acknowledgement
The authors thank the Department of Health of the Hong
Kong SAR Government for granting approval to use the data
from Population Health Survey 2003/2004, Heart Health
Survey 2004/2005, and Population Health Survey 2014/15
for this research. The authors also thank Dr Weinan Dong and
Ms Tingting Wu from the Department of Family Medicine
and Primary Care of The University of Hong Kong for their
assistance in data interpretation and revising the final draft of
the manuscript.
Declaration
Part of this study was presented as a poster at the ESC Congress
2021 – The Digital Experience (virtual), 27-30 August 2021,
and was published as an abstract (Sung BY, Tang EH, Bedford
L, et al. Change in Framingham cardiovascular disease risk
between 2003 and 2014 in the Hong Kong Population Health
Survey [abstract]. Eur Heart J 2021;42:1).
Funding/support
This research received no specific grant from any funding agency in the public, commercial, or not-for-profit sectors.
Ethics approval
The requirement for ethics approval for this research was waived by the Institutional Review Board of The University of Hong Kong/Hospital Authority Hong Kong West Cluster,
Hong Kong as this study involved secondary analysis of de-identified
governmental data.
References
1. Roth GA, Johnson C, Abajobir A, et al. Global, regional,
and national burden of cardiovascular diseases for 10
causes, 1990 to 2015. J Am Coll Cardiol 2017;70:1-25. Crossref
2. GBD 2017 Causes of Death Collaborators. Global, regional,
and national age-sex-specific mortality for 282 causes
of death in 195 countries and territories, 1980-2017: a
systematic analysis for the Global Burden of Disease Study
2017. Lancet 2018;392:1736-88. Crossref
3. Romero CX, Romero TE, Shlay JC, Ogden LG, Dabelea D.
Changing trends in the prevalence and disparities of
obesity and other cardiovascular disease risk factors in
three racial/ethnic groups of USA adults. Adv Prev Med
2012;2012:172423. Crossref
4. World Health Organization. Hypertension. 2019. Available
from: https://www.who.int/news-room/fact-sheets/detail/hypertension. Accessed 8 Jan 2021.
5. Kearney PM, Whelton M, Reynolds K, Muntner P,
Whelton PK, He J. Global burden of hypertension: analysis
of worldwide data. Lancet 2005;365:217-23. Crossref
6. Lin X, Xu Y, Pan X, et al. Global, regional, and national
burden and trend of diabetes in 195 countries and
territories: an analysis from 1990 to 2025. Sci Rep
2020;10:14790. Crossref
7. World Health Organization. Cardiovascular diseases.
2016. Available from: https://www.who.int/health-topics/cardiovascular-diseases#tab=tab_1. Accessed 8 Jan 2021.
8. World Health Organization. Prevention of cardiovascular
disease. Guidelines for assessment and management of
cardiovascular risk. 2007. Available from: https://apps.who.int/iris/bitstream/handle/10665/43685/9789241547178_eng.pdf?sequence=1&isAllowed=y. Accessed 8 Jan 2021.
9. Ajani UA, Ford ES. Has the risk for coronary heart disease changed among U.S. adults? J Am Coll Cardiol 2006;48:1177-82. Crossref
10. Lopez-Jimenez F, Batsis JA, Roger VL, Brekke L, Ting HH,
Somers VK. Trends in 10-year predicted risk of
cardiovascular disease in the United States, 1976 to 2004.
Circ Cardiovasc Qual Outcomes 2009;2:443-50. Crossref
11. Department of Health, Hong Kong SAR Government;
Department of Community Medicine, The University
of Hong Kong. Population Health Survey 2003/2004 2015. Available from: https://www.chp.gov.hk/files/pdf/report_on_population_health_survey_2003_2004_en.pdf. Accessed 8 Jan 2021.
12. Surveillance and Epidemiology Branch, Centre for Health Protection, Department of Health, Hong Kong SAR Government. Report of Population Health Survey 2014/2015. 2017. Available from: https://www.chp.gov.hk/files/pdf/dh_phs_2014_15_full_report_eng.pdf. Accessed 8 Jan 2021.
13. D’Agostino RB Sr, Vasan RS, Pencina MJ, et al. General
cardiovascular risk profile for use in primary care: the
Framingham Heart Study. Circulation 2008;117:743-53. Crossref
14. Lee CH, Woo YC, Lam JK, et al. Validation of the Pooled Cohort equations in a long-term cohort study of Hong Kong Chinese. J Clin Lipidol 2015;9:640-6.e2. Crossref
15. World Health Organization. Age standardization of rates:
a new WHO standard. 2001. Available from: https://cdn.who.int/media/docs/default-source/gho-documents/global-health-estimates/gpe_discussion_paper_series_paper31_2001_age_standardization_rates.pdf. Accessed 6 May 2024.
16. United States Census Bureau. Introduction to Census 2000
Data Products. Available from: https://usa.ipums.org/usa/resources/voliii/pubdocs/2000/mso-01icdp.pdf. Accessed 1 May 2024.
17. Census and Statistics Department, Hong Kong SAR
Government. Hong Kong population projections 2017-2066. 2017. Available from: https://www.censtatd.gov.hk/media_workers_corner/pc_rm/hkpp2017_2066/index.jsp. Accessed 8 Jan 2021.
18. Department of Health, Hong Kong SAR Government.
Non-Communicable Diseases Watch. Overview of
cardiovascular diseases. September 2018. Available from:
https://www.chp.gov.hk/files/pdf/ncd_watch_sep_2018.pdf. Accessed 8 Jan 2021.
19. National Prevention Council, United States Government.
National Prevention Strategy. America’s plan for better
health and wellness. June 2011. Available from: https://www.hhs.gov/sites/default/files/disease-prevention-wellness-report.pdf. Accessed 8 Jan 2021.
20. Chow CK, Nguyen TN, Marschner S, et al. Availability and
affordability of medicines and cardiovascular outcomes
in 21 high-income, middle-income and low-income
countries. BMJ Glob Health 2020;5:e002640. Crossref
21. Collins GS, Altman DG. Predicting the 10-year risk of
cardiovascular disease in the United Kingdom: independent
and external validation of an updated version of QRISK2.
BMJ 2012;344:e4181. Crossref
22. Carroll MD, Lacher DA, Sorlie PD, et al. Trends in serum lipids and lipoproteins of adults, 1960-2002. JAMA 2005;294:1773-81. Crossref