Hong Kong Med J 2017 Aug;23(4):356–64 | Epub 7 Jul 2017
DOI: 10.12809/hkmj166078
© Hong Kong Academy of Medicine. CC BY-NC-ND 4.0
ORIGINAL ARTICLE
Are we making good use of our public resources? The false-positive rate of screening by fundus photography for diabetic macular oedema
Raymond LM Wong, MRCSEd (Ophth), FCOphth HK1,2,3; CW Tsang, FRCSEd (Ophth)1,3; David SH Wong, FRCOphth2; Sarah McGhee, FFPH (UK)4;
CH Lam, BSc(Hons) in Optometry2; J Lian, PhD4; Jacky WY Lee, FRCSEd (Ophth)2; Jimmy SM Lai, FRCOphth2; Victor Chong, FRCOphth2,5;
Ian YH Wong, FRCOphth2
1 Department of Ophthalmology and Visual Sciences, The Chinese University of Hong Kong, Shatin, Hong Kong
2 Department of Ophthalmology, The University of Hong Kong, Pokfulam, Hong Kong
3 Hong Kong Eye Hospital, 147K Argyle Street, Hong Kong
4 Department of Community Medicine, The University of Hong Kong, Pokfulam, Hong Kong
5 Oxford Eye Hospital, Oxford University Hospitals, Oxford, United Kingdom
Corresponding authors: Dr Raymond LM Wong (raymondwlm@hotmail.com), Dr Ian YH Wong (wongyhi@hku.hk)
 Full
paper in PDF
Full
paper in PDF
Abstract
Introduction: A large proportion of patients
diagnosed with diabetic maculopathy using fundus
photography and hence referred to specialist clinics
following the current screening guidelines adopted
in Hong Kong and United Kingdom are found to
be false-positive, implying that they did not have
macular oedema. This study aimed to evaluate the
false-positive rate of diabetic maculopathy screening
using the objective optical coherence tomography
scan.
Methods: This was a cross-sectional observational
study. Consecutive diabetic patients from the
Hong Kong West Cluster Diabetic Retinopathy
Screening Programme with fundus photographs
graded R1M1 were recruited between October 2011
and June 2013. Spectral-domain optical coherence
tomography imaging was performed. Central
macular thickness of ≥300 µm and/or the presence
of optical coherence tomography signs of diabetic
macular oedema were used to define the presence of
diabetic macular oedema. Patients with conditions
other than diabetes that might affect macular
thickness were excluded. The mean central macular
thickness in various subgroups of R1M1 patients was
calculated and the proportion of subjects with central
macular thickness of ≥300 µm was used to assess the
false-positive rate of this screening strategy.
Results: A total of 491 patients were recruited
during the study period. Of the 352 who were eligible
for analysis, 44.0%, 17.0%, and 38.9% were graded as
M1 due to the presence of foveal ‘haemorrhages’,
‘exudates’, or ‘haemorrhages and exudates’,
respectively. The mean (±standard deviation) central macular thickness was 265.1±55.4 µm. Only 13.4%
(95% confidence interval, 9.8%-17.0%) of eyes had
a central macular thickness of ≥300 µm, and 42.9%
(95% confidence interval, 37.7%-48.1%) of eyes had
at least one optical coherence tomography sign of diabetic macular oedema. For patients with retinal
haemorrhages only, 9.0% (95% confidence interval,
4.5%-13.5%) had a central macular thickness of ≥300 µm; 23.2% (95% confidence interval, 16.6%-29.9%) had at least one optical coherence tomography
sign of diabetic macular oedema. The false-positive
rate of the current screening strategy for diabetic
macular oedema was 86.6%.
Conclusion: The high false-positive rate of the
current diabetic macular oedema screening adopted
by the United Kingdom and Hong Kong may lead
to unnecessary psychological stress for patients and
place a financial burden on the health care system.
A better way of screening is urgently needed.
Performing additional spectral-domain optical
coherence tomography scans on selected patients
fulfils this need.
New knowledge added by this study
- The current Hong Kong diabetic retinopathy screening results in a high level of false positive results, which in turn creates unnecessary psychological stress for patients and financial burden on our health care system.
- The current screening programme can be improved by the use of optical coherence tomography scans in selected patients.
- The results of our study reflect a need to revise the current Hong Kong diabetic retinopathy screening system (Risk Assessment and Management Programme; RAMP-DR).
Introduction
Diabetic retinopathy (DR) is one of the most common
causes of blindness and its incidence increases with
the duration of diabetes.1 2 3 The reported prevalence
ranges from 24%-40% after 5 years to 80%-90% after
20 years of diabetes.2 3 4 Diabetic macular oedema
(DME) and proliferative diabetic retinopathy (PDR)
are the two major causes of vision loss in DR.5 The Early Treatment Diabetic Retinopathy Study
(ETDRS) showed that clinically significant macular
oedema (CSME) leads to moderate vision loss in
one of four patients with this condition over 3 years.
Timely laser treatment reduces the risk of vision
loss by half.6 In recent years, there has been a move
towards the use of newer treatment modalities, such
as intravitreal injection of anti–vascular endothelial
growth factor (VEGF) agents that are superior to
the traditional laser treatment in the management
of CSME.7 8 9 10
11 12 13 14 Screening for DR has been proven to
be cost-effective in reducing significant vision loss
by early detection of the pathology.15 16 17 This will
subsequently reduce the financial burden caused
by vision complications of DR on the health care
system.18 19 A number of DR screening strategies
are available with different efficacies.20 Systematic
screening for DR with fundus photography has been
implemented in the UK and Hong Kong, and it has been shown to be cost-effective for
sight-threatening conditions from the provider’s
perspective (Fig 1).21 However, the accuracy of the
current DR screening protocol for DME remains
unknown. With limited health care resources,
improving the accuracy and cost-effectiveness of
systematic screening programmes is important.22
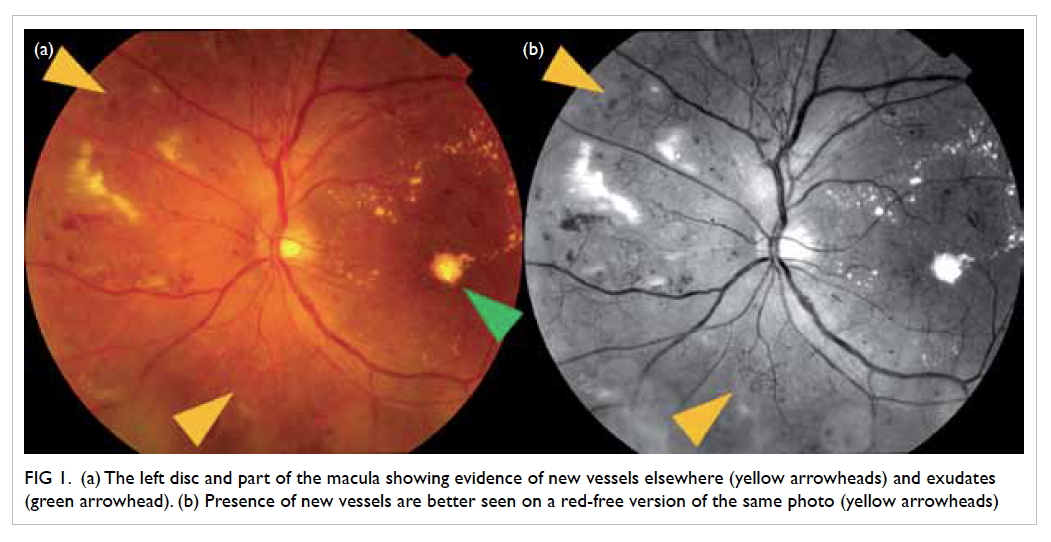
Figure 1. (a) The left disc and part of the macula showing evidence of new vessels elsewhere (yellow arrowheads) and exudates (green arrowhead). (b) Presence of new vessels are better seen on a red-free version of the same photo (yellow arrowheads)
In Hong Kong, individuals who attend public
out-patient clinics for diabetes management are offered annual fundus photography for DR screening.
Eyes are graded according to the protocol adopted
by the UK National Health Service (Diabetic Eye
Screening Revised Grading Definitions, version 1.4,
NHS Screening Programmes). Those found to have
sight-threatening diabetic retinopathy (STDR), that
is, patients who have their worse eye graded as pre-proliferative
DR (R2 or above), maculopathy (M1)
or ungradable at screening, are referred for clinical
assessment by an ophthalmologist. Those confirmed
to have CSME or PDR are then offered appropriate
treatment.6
Unlike PDR, DME cannot be visualised
with fundus photography because of the lack of
stereopsis in two-dimensional photographs. Instead
of appreciating the actual macular thickening,
determining the presence of surrogate markers in the
macula, such as retinal exudates and haemorrhages,
is currently the recommended first step in predicting
the presence of macular oedema from fundus
photography.23
Our unpublished data from the Hong Kong
West Cluster DR Screening Programme showed that
the prevalence of ungradable fundus photographs
was 3.8% and the rate for a positive screen for M1
by fundus photography was 14%. Those graded as
M1 accounted for 86.4% of all the referred STDR
cases. A similar result was found in the UK where
79% of all subjects with diabetes who were referred
to ophthalmology clinics following screening were
graded as M1.24 These findings indicate that M1 is the most
prevalent type of STDR diagnosed at screening
among subjects with diabetes in both the UK and
Hong Kong. Due to the limited ability of fundus
photography to visualise retinal thickening in DME,
the number of false positives (ie those without DME)
has become a concern. The opportunity to detect M1
at an early stage during DR screening is potentially
very valuable. A high false-positive rate is perceived
to increase the burden on patients and public health
care resources. Because these false positive cases do
not need treatment, such extra workload produces
no benefit and could be considered a waste of public
resources. On the other hand, it would benefit the
cost-effectiveness of macular oedema detection if a
screening protocol with fewer false positive results
could be identified.
In recent years, optical coherence tomography
(OCT) has been developed to generate highly
accurate and objective information regarding the
cross-sectional view of the retina. This scanning
technique is fast, safe, non-invasive, contact-free,
and with no radiation exposure. It is a reliable
means to identify macular thickening in diabetics.
Comparison of photographic-graded M1 with the
findings from OCT scans can perhaps enable us to
better understand the current level of false positives
at screening and provide essential information to evaluate the means by which the cost-effectiveness of
screening for M1 can be improved. The aims of this
study were to evaluate the false-positive rate of grade
M1 using the existing criteria and OCT imaging
as the reference standard, and also to estimate the
consequences of inappropriate specialty clinic
referrals generated from the false positive results.
Methods
In this cross-sectional observational study, patients
were recruited from the Hong Kong West Cluster DR Screening Programme.
This programme offers annual DR screening to
all diabetic patients in Queen Mary Hospital (a
teaching hospital in Hong Kong) and patients
referred from the Hong Kong Risk Assessment and
Management Programme (RAMP-DR screening) in
the Hong Kong West Cluster. In other words, this
programme cares for the eye conditions of all the
diabetic patients attending public sector in the Hong
Kong West Cluster. There are 500 000 residents in
the Hong Kong West Cluster and around 7 000 000
citizens in Hong Kong. Assuming the prevalence
of diabetes mellitus to be similar across different
regions of Hong Kong, Hong Kong West Cluster
cares for 7.1% (500 000/7 000 000) of diabetic
patients in the city. All patients who attended this
programme had mydriatic fundus photographs
taken for DR screening. Fundus photographs were
graded by a qualified RAMP screening programme
grader (an optometrist) according to the UK
NHS Diabetic Eye Screening–Feature Based Grading Forms (Version 1.4). This allocated
an M1 grade to subjects with the presence of
exudates or retinal haemorrhages/microaneurysms
within 1 disc diameter (1.5 mm) of the centre of
the fovea, accompanied by a reduction in the best-corrected
visual acuity to 6/12 or worse. In addition
to maculopathy (M0-M1), retinopathy (R0-R3) was
graded from the fundus photographs using the same
screening standard. Nonetheless, because patients
with moderate non-proliferative DR or worse (DR
screening grade R2 or above), which constituted 3.0%
of the screened population in Hong Kong,25 needed
to be assessed and followed by ophthalmologists
regardless of their maculopathy status (M0 or
M1), these subjects do not contribute to the extra
workload of specialist clinics. Therefore, the current
study focused on only patients in whom maculopathy
or mild retinopathy (R1M1) was revealed following
screening with fundus photography.
Consecutive subjects aged 18 years or above
(no upper age limit) with fundus photographs
graded R1M1 were recruited from October 2011
to June 2013. Patients with retinal or choroidal
conditions other than diabetes that could affect
retinal thickness were excluded. Patients with
media opacities such as cataract were not excluded provided the grading of fundus photography was not
affected and optimal OCT scans could be obtained.
Therefore, all ungradable photos were excluded from
this study. Informed consent was obtained from all
the patients. This study adhered to the tenets of the
Declaration of Helsinki and was approved by the
Institutional Review Board of the University of Hong
Kong/Hong Kong West Cluster.
Because the traditional gold standard for
diagnosing CSME, slit lamp biomicroscopy, is
subjective and difficult to validate, we used OCT
imaging as the reference standard for diagnosis.
Spectral-domain OCT (sd-OCT) imaging was
performed with a Carl Zeiss Cirrus sd-OCT (Carl
Zeiss Meditec, Dublin [CA], United States) on all included
subjects to determine central macular thickness
(CMT) using the Macular Cube protocol (average
retinal thickness in the area enclosed in a 1000-µm
diameter circle centred at the fovea). A CMT of
300 µm was used as the cut-off for normal macular
thickness (the rationale of choosing this value will be
discussed in detail in Discussion).
The OCT scans were analysed by an
experienced retina specialist for the presence of
OCT signs of macular oedema, namely the presence
of intraretinal cyst, subretinal fluid, diffuse retinal
thickening, or change in internal limiting membrane
(ILM) contour. During analysis, the retina specialist
was blinded to CMT value.
Statistical analyses
Only one eye from each subject was used in the
analysis. For patients with both eyes graded as
R1M1, only their right eye was chosen for analysis.
A descriptive analysis was used to summarise the
demographic characteristics of study subjects.
The positive predictive values (PPVs) of different
combinations of criteria were calculated with 95%
confidence interval (CI). We first classified the
fundus photographs into three groups according
to the criteria used to grade them as M1 at
screening: haemorrhages only, exudates only, or both haemorrhages and exudates. Each of these
three groups was compared with the reference
standard results of the OCT scan that measured a
CMT of ≥300 µm to calculate the PPV of each M1
criterion at screening. We also calculated the PPV
by comparing each of these three groups with the
reference standard results of the OCT that measured
any OCT signs of DME. Chi squared test was used
to determine whether there were any significant
differences in the PPVs among the three groups. The
false-positive rate was obtained by subtracting the
PPV from 1.
Results
A total of 491 R1M1 patients were recruited
during the study period. After excluding those with
conditions that might affect macular thickness or
the quality of an OCT scan such as dense cataract,
352 R1M1 patients remained eligible for analysis.
The mean (± standard deviation) age of these 352
patients was 65 ± 11 years and 187 (53%) patients
were female.
Among the 352 eyes analysed, 155 (44.0%), 60
(17.0%), and 137 (38.9%) were graded as M1 based
on the presence of foveal haemorrhages, exudates,
or haemorrhages and exudates, respectively, in the
fundus photographs (Table 1).
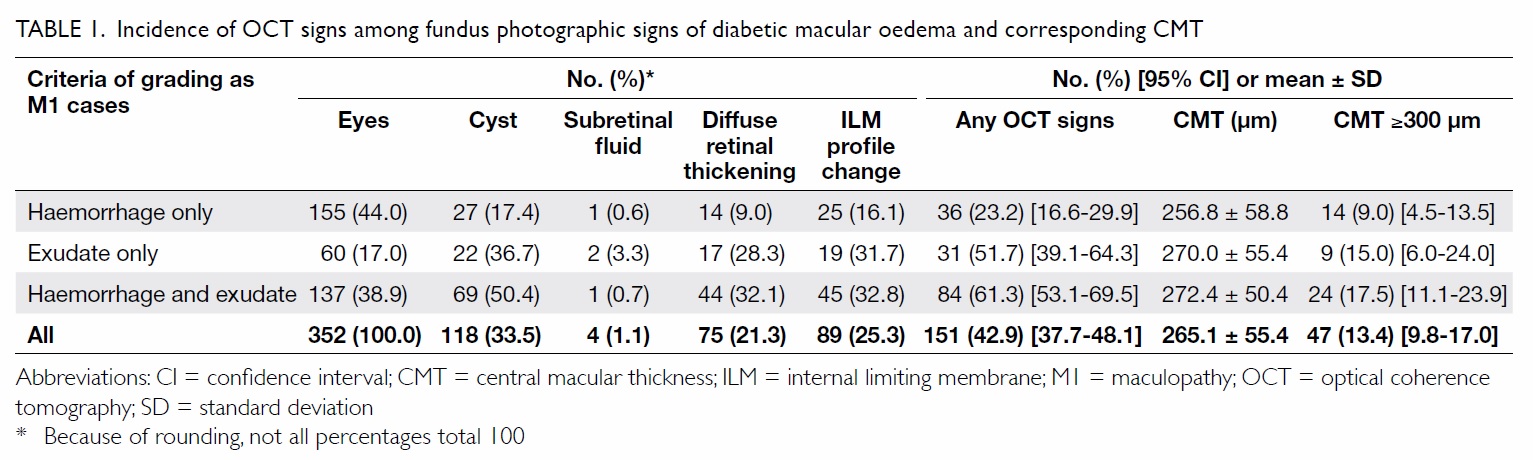
Table 1. Incidence of OCT signs among fundus photographic signs of diabetic macular oedema and corresponding CMT
The overall mean CMT of all the subjects was
265.1 µm. The mean CMT was 256.8 µm for the
patients with haemorrhages only, 270.0 µm for the
patients with exudates only, and 272.4 µm for those
with both haemorrhages and exudates.
Overall, only 47 (13.4%) of the 352 (95% CI,
9.8%-17.0%) eyes had a CMT of ≥300 µm (Table 1). Using the criterion of the presence of retinal
haemorrhages within 1 disc diameter from the centre
of the fovea, 9.0% (95% CI, 4.5%-13.5%) of eyes had a
CMT of ≥300 µm, which was the lowest proportion.
Applying the criterion of presence of exudates at
the fovea, 15.0% (95% CI, 6.0%-24.0%) had a CMT
of ≥300 µm; and in the presence of simultaneous
haemorrhages and exudates, this figure was 17.5% (95% CI, 11.1%-23.9%) [Chi squared=4.70, P=0.096].
When CMT was not taken into account,
151 (42.9%) of the 352 (95% CI, 37.7%-48.1%) eyes
had at least one OCT sign of DME (Table 1). The
proportion of eyes with any OCT signs of macular
oedema varied depending on the criterion applied to
define the eye as MI. The proportion was lowest for
presence of haemorrhages at 1 disc diameter from
the centre of the fovea at 23.2% (95% CI, 16.6%-29.9%) followed by 51.7% (95% CI, 39.1%-64.3%) for
the presence of exudates at the fovea, and 61.3% (95%
CI, 53.1%-69.5%) for the presence of simultaneous
haemorrhages and exudates (Chi squared=45.3,
P<0.001).
Of the 47 eyes with a CMT of ≥300 µm, 95.7%
were noted to have at least one OCT sign of DME,
which was a significantly higher proportion than in
eyes with CMT of <300 µm (34.8%, P<0.001; Table 2).
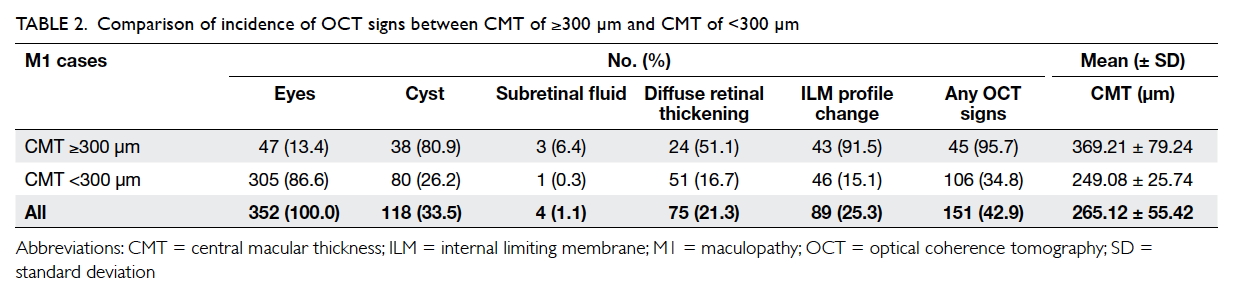
Table 2. Comparison of incidence of OCT signs between CMT of ≥300 µm and CMT of <300 µm
The PPV of the DME screening was 13.4% (95%
CI, 9.8%-17.0%) and false-positive rate was 86.6%
(95% CI, 83.0%-90.2%) if macular thickness was used
to define the presence of macular oedema. The PPV
remained as low as 42.9% (95% CI, 37.7%-48.1%) and
false-positive rate 57.1% (95% CI, 51.9%-62.3%) even
if the thickness criterion was dropped and presence
of OCT signs of macular oedema were considered
sufficient to indicate the presence of oedema.
Discussion
Annual DR screening by ophthalmologists is an ideal
but costly method that most health care systems can
ill afford. The UK and Hong Kong adopt the fundus
photography screening strategy that effectively
prevents vision loss from PDR but may not be as
accurate as in the screening of DME. The current
study showed a high false-positive rate of 86.6% and
low PPV of 13.4% in the screening for DME. Similar
to our findings, a UK audit by Jyothi et al24 revealed
that 79% of their M1 patients who were referred to
specialist clinics did not require any intervention.
Because a grade of M1 is used to estimate the presence
of CSME and, ideally, all CSME patients should be
treated, most of those who were not treated would be due to a false positive result (ie patients without
CSME being graded as M1). Therefore, despite the
absence of further evaluation of their M1 patients,
the results of Jyothi et al’s study24 imply a low accuracy of
the screening strategy.
To date, there is no consensus on the upper limit
of normality for OCT central subfield (area within
500 µm from the centre of the fovea) thickness, but it
is thought to range from 230-300 µm for time-domain
OCT and 300-350 µm for sd-OCT.26 The difference
between the two types of OCT machines arises
because time-domain machines measure retinal
thickness from the ellipsoid zone to the ILM while the
spectral-domain machines use the distance between
retinal pigment epithelium or Bruch’s membrane
to the ILM, which are more posterior structures
to the ellipsoid zone. Most benchmark studies of
the effects of intravitreal anti-VEGF injections in
the management of DME used time-domain OCT
for assessment. The upper limit of normal CMT
was defined as 250 µm in the Diabetic Retinopathy
Clinical Research Network (DRCR Network) study10
and READ-2 study8; 275 µm in the RISE and RIDE
studies7 and the RESTORE study9; and 300 µm in the
RESOLVE study.14 The DRCR Network also showed
that sd-OCT measurement can be reliably converted
to standard Stratus time-domain OCT measurement
with conversion equations.13 If CMT of 250 µm in
time-domain OCT is converted to the sd-OCT, it
will range from 290.2 µm to 313.4 µm. We chose
300 µm as the cut-off value for the upper limit of
normal macular thickness to distinguish abnormal
from normal because our Carl Zeiss Cirrus OCT is a
sd-OCT. Similar cut-off values were adopted by the
DRCR Network in a recently published paper.12 In
their multicentre study, when Cirrus OCT was used,
305 µm and 290 µm were used to define increased
CMT for males and females, respectively.12 Using
300 µm as the cut-off in our reference standard
gave a smaller number of false-positive diagnoses
by traditional fundus photography screening than
using a higher cut-off value, therefore favouring the
current screening programme by being conservative
in the estimation of false-positive rate. Another
reason for using this criterion was because of the importance of the screening programme to
be sufficiently sensitive to identify subtle disease
states. Macular oedema is less likely to be present
when CMT is <300 µm. Macular oedema should be
diagnosed only when a subject’s CMT is ≥300 µm
and additional criteria are met. These criteria are as
follows: the presence of intraretinal cysts, subretinal
fluid and/or diffuse retinal oedema (retinal
thickening with areas of reduced retinal reflectivity
on OCT scans) on more than one scan, or any of the
above associated with a change in the ILM contour
(Fig 2), including increased CMT or loss of foveal
contour.27 A qualitative and quantitative assessment
of the macula with OCT can objectively diagnose or
exclude macular oedema.
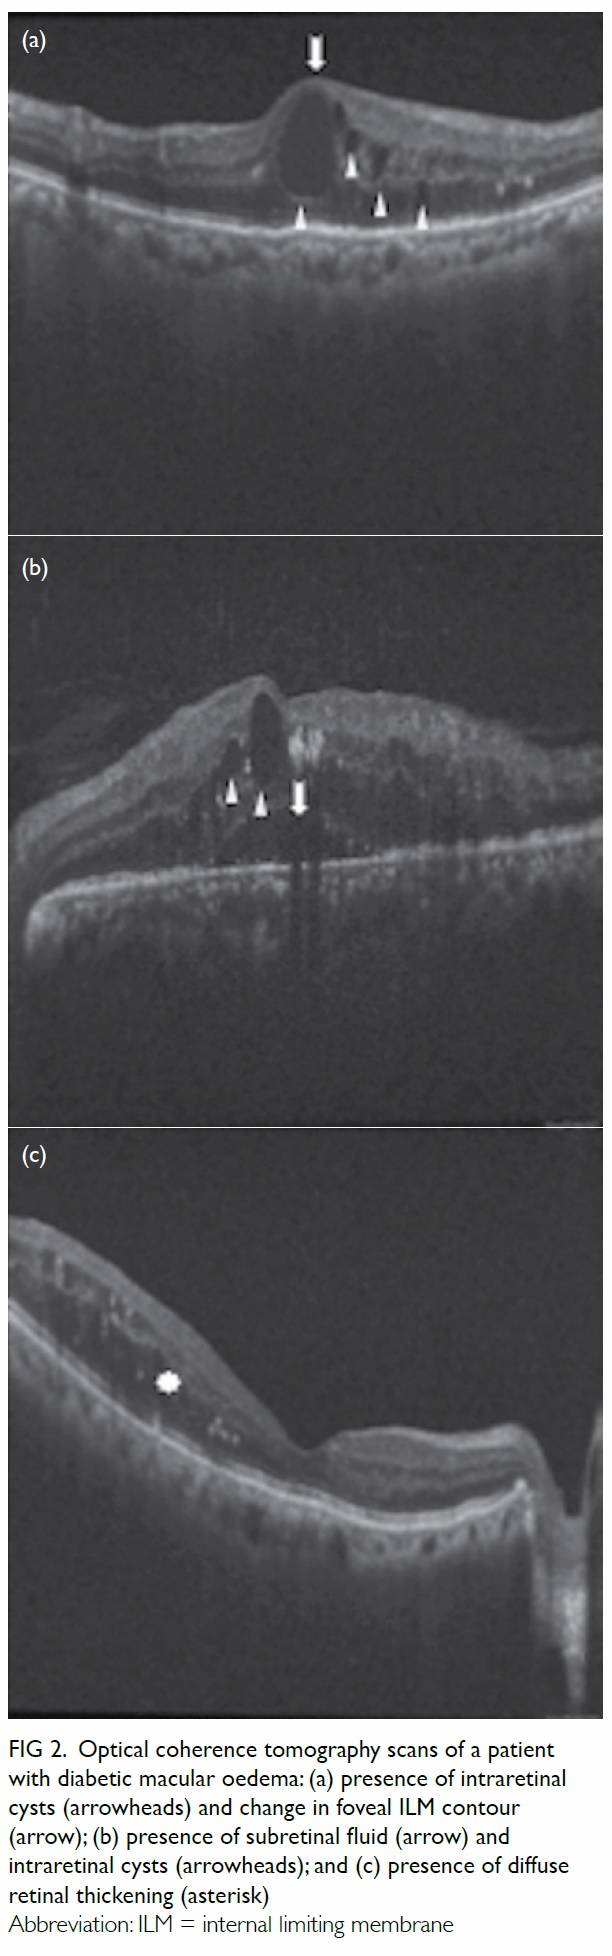
Figure 2. Optical coherence tomography scans of a patient with diabetic macular oedema: (a) presence of intraretinal cysts (arrowheads) and change in foveal ILM contour (arrow); (b) presence of subretinal fluid (arrow) and intraretinal cysts (arrowheads); and (c) presence of diffuse retinal thickening (asterisk)
It is worth noting that some believe macular
thickness should not be included as an OCT
criterion for determining the presence of DME.
These ophthalmologists think that as long as any
OCT sign of DME (ie presence of intraretinal cyst,
subretinal fluid, diffuse retinal thickening and/or change in foveal contour) is present, thickening
ensues regardless of CMT. Although we agree
that OCT signs signify the presence of genuine
oedema, we believe it is still essential to include
CMT in the diagnostic criteria because the basis for
ophthalmologists treating patients with DME came
from the large-scale study performed by the ETDRS
group.6 The ETDRS group has proven that only
patients with CSME identified ophthalmoscopically
by ophthalmologists will benefit from laser
treatment compared with controls. Biomicroscopic
assessment of DME by an ophthalmologist, however,
is less sensitive than an OCT scan in diagnosing
macular oedema when retinal thickening is mild.28 29
Therefore, for diabetic patients with a CMT of <300
µm, evidence may not support treatment even if
intraretinal cysts or other OCT signs of macular
oedema are present, especially since laser and anti-VEGF therapies have potential side-effects. As all
of the latest studies to evaluate the effects of anti-VEGF injections in the management of CSME
included the CMT criteria when recruiting patients,
it was appropriate to include the macular thickness
criterion when setting our reference standard. In
fact, Bandello et al30 have performed a subgroup
analysis with RESTORE study data and showed
that treatment efficacy varied among patients with
different CMT, in which the visual acuity gain after
treatment was less in patients with baseline CMT
of ≤300 µm (time-domain OCT measurement)
than for those with CMT of >300 µm. Moreover,
patients with better baseline visual acuity were more
likely to experience visual acuity loss following laser
monotherapy. This further justifies the need for the
thickness criterion to be included when considering
treatment.
If CMT ≥300 µm is considered genuine thickening of the macula, regardless of the presence
of other OCT signs of DME, the false-positive rate
of the current screening (proportion of referred M1
patients with CMT of <300 µm on OCT) protocol
is 86.6%. For every 1000 patients referred following
screening to an ophthalmologist for diabetic
maculopathy, 134 or fewer may require treatment
because even among patients with increased CMT,
the condition might not be clinically significant
when it is only marginally greater than 300 µm. The
cost of seeing one patient in a government eye clinic
in Hong Kong is HK$600, and the marginal cost of
offering one OCT scan is HK$50 (cost of operating
staff and colour print-out included; administrative
costs in the health care system not included).
Therefore, for every 1000 R1M1 patients offered
OCT, at least 866 patients will have no CSME,
thus referral to an eye specialist is unnecessary. In
approximate monetary terms, hospitals would save
HK$469 600 per 1000 R1M1 patients (866 x $600 –
1000 x $50) if they had an OCT machine. In addition
to the financial burden, the high false-positive rate of
screening would lead to unnecessary psychological
stress for patients.
Based on our study data, if only OCT signs,
not CMT, are taken as the reference standard for the
presence of genuine DME, the false-positive rate of
the current DME screening is also not low at 57.1%
of the screened-positive population.
A high false-positive rate of screening
programmes places a huge burden on the health care
system in terms of cost and manpower. In contrast,
a high false-negative rate puts patients at risk of
vision loss even when effective treatment is readily
available.31 32 33 An increased number of patients
with vision loss as a consequence of false-negative
screening will, in turn, translate into a financial
burden on the health care system and society. In
view of the rising prevalence of diabetes and its
complications worldwide,34 a more reliable and cost-effective
screening strategy is needed.
We have reviewed the fundus photographs
and OCT scans of R1M1 patients and endeavoured
to determine why the PPV is unacceptably low. A
substantial proportion of the false positive cases
were graded M1 because of the presence of dot
haemorrhages or microaneurysms within 1 disc
diameter from the centre of the fovea together
with a best corrected visual acuity of 6/12 or worse.
This is one of the criteria for M1 grading in the
protocol adopted by the Hong Kong RAMP-DR
screening and the UK NHS Diabetic Eye Screening
Programme. The inclusion of dot haemorrhages/microaneurysms in the definition of M1 may not be
beneficial to the screening programme. For example,
they are not included in the Scottish Diabetic
Retinopathy Screening Programme (Scottish
Diabetic Retinopathy Grading Scheme 2007 v1.1).
Further studies should be conducted to evaluate
the effects of amending the grading protocol of M1
(eg by revising the grading criteria) in the current
screening strategy. The false-positive rate of screening
may be reduced, perhaps with minimal impact on
the false-negative rate. If resources are available, the
addition of OCT imaging in selected cases (eg OCT
scans for all patients graded as M1), or even for all
(ie OCT for all in addition to fundus photography)
may also help increase the effectiveness of screening.
Either way, although the false-negative rate of DR
screening might be increased, the consequence is
not as severe in DME screening as other screenings
because CSME generally impairs vision slowly.
Furthermore, all negatively screened patients will
be screened again in 1 year. If there is progression
of disease, signs of disease, such as presence of
exudate, will likely become more prominent and be
noticed at the subsequent annual screenings. Subtle
changes that cannot be detected by screening will
not hugely affect the patient’s vision. If the screening
strategy is enhanced by performing additional OCT
scans, there will be additional benefits on top of the
improved accuracy in DME screening since OCT
evidence of micro-structural changes to the retinal
layers has been shown to correlate well with visual
acuity and may have prognostic value in DME.35
Since this study recruited consecutive eligible
patients from the diabetes complication screening
programme and this screening programme is catered
to all the public diabetic patients in the Hong Kong
West Cluster, which is a representative population of
Hong Kong, our findings should reflect the accuracy
of the Hong Kong RAMP-DR screening programme.
Our study had several limitations, including
potential selection bias due to subject recruitment
solely in a public hospital, and self-selection bias due
to refusal of eligible diabetic patients to participate
in screening and/or screened-positive patients
to participate in this study. There are a lack of
accurate local epidemiological data regarding the
prevalence of diabetes in the population resident
in the catchment area of the screening programme
and the proportion of all diabetic patients in the
Hong Kong West Cluster (coverage area) who
attend public services is unknown. Hence, our study
subjects might not be representative of all diabetic
patients in the study area. Nonetheless unlike
voluntary response bias, when stratified to different
severity levels (eg M0 or M1; R0, R1, R2, or R3), the
presentation of DR differs little between patients in
the public sector and private sector so bias should
be minimal. Regarding self-selection bias, we have
no data for the proportion of eligible patients who
refused to participate in the screening programme.
All patients who visited our clinic were those who
agreed to the screening and had been referred from a
general out-patient clinic or Department of Medicine of Queen Mary Hospital. All diabetic patients who
are currently followed up in the public sector of
Hong Kong West Cluster will attend the universal
DR screening programme (RAMP). Since this is part
of their diabetes follow-up, we may assume that only
those who refuse such follow-up in the public sector
will miss the RAMP screening. Therefore these
potential sources of bias will not affect interpretation
of our data. We have not documented the number
of screened-positive subjects (DR grade R1M1) who
refused to participate in our study, but we believe the
number would have been small given our convenient
location and the non-invasive nature of OCT scans,
thus we should only expect minimal self-selection
bias.
Another limitation of our study is that only
one experienced retina specialist was responsible for
determining the presence of OCT signs of DME in
our subjects. Nonetheless the retina specialist was
blinded to the fundus photography DR grading, and
the presence of OCT signs such as intraretinal fluid
and change in foveal contour were distinct and not
ambiguous. As such, the lack of multiple independent
investigators to determine the presence of OCT
signs of macular oedema should not have induced
bias or affected our findings and final analysis. This
study also lacks the data regarding the false-negative
rate in the current screening programme. Since
the objective of our study was to evaluate the rate
of false-positive referrals, only patients with eyes
graded as M1 were recruited. In order to evaluate
the screening system as a whole, analysis of the data
of eyes graded as M0 is also essential. Moreover,
the strength and weakness of the screening can be
objectively assessed with the calculated sensitivity,
specificity, positive and negative predictive values,
and false-positive and false-negative rates. Further
studies in this respect are warranted.
In our study, we used the Macular Cube
protocol to measure CMT, determining the macular
thickness at 128 different points in the foveal
region (500 µm radius from the centre of fovea). By
averaging the 128 readings, the CMT of one patient
was obtained. This way of measuring CMT is more
reliable than performing only two scans (horizontal
and vertical) when evaluating macular oedema with
OCT.
Conclusion
The low PPV of the current DME screening adopted
by the UK and Hong Kong will lead to unnecessary
psychological stress for patients and place a
financial burden on the health care system. An
improved screening protocol, such as the addition
of sd-OCT scans in selected patients or amendment
of the grading protocol of the current screening
programme, is necessary to improve its cost-effectiveness.
Acknowledgements
This study was supported by the Department of
Ophthalmology, The University of Hong Kong. The
authors would like to thank all the ophthalmologists
and physicians at Queen Mary Hospital (Hong Kong)
who were involved in management of the patients.
Declaration
All authors have disclosed no conflicts of interest.
References
1. Diabetic retinopathy. Preferred practice pattern guidelines.
Available from: https://www.aao.org/about-preferred-practice-patterns. Accessed 28 Nov 2016.
2. Klein R, Klein BE, Moss SE, Davis MD, DeMets DL. The
Wisconsin epidemiologic study of diabetic retinopathy.
III. Prevalence and risk of diabetic retinopathy when
age at diagnosis is 30 or more years. Arch Ophthalmol
1984;102:527-32. Crossref
3. Klein R, Klein BE, Moss SE, Davis MD, DeMets DL. The
Wisconsin epidemiologic study of diabetic retinopathy.
II. Prevalence and risk of diabetic retinopathy when
age at diagnosis is less than 30 years. Arch Ophthalmol
1984;102:520-6. Crossref
4. Aiello LM. Perspectives on diabetic retinopathy. Am J
Ophthalmol 2003;136:122-35. Crossref
5. Aiello LP, Gardner TW, King GL, et al. Diabetic retinopathy.
Diabetes Care 1998;21:143-56. Crossref
6. Photocoagulation for diabetic macular oedema. Early
Treatment Diabetic Retinopathy Study report number
1. Early Treatment Diabetic Retinopathy Study research
group. Arch Ophthalmol 1985;103:1796-806. Crossref
7. Nguyen QD, Brown DM, Marcus DM, et al. Ranibizumab
for diabetic macular edema: results from 2 phase III
randomized trials: RISE and RIDE. Ophthalmology
2012;119:789-801. Crossref
8. Nguyen QD, Shah SM, Khwaja AA, et al. Two-year
outcomes of the ranibizumab for edema of the macula in
diabetes (READ-2) study. Ophthalmology 2010;117:2146-51. Crossref
9. Lang GE, Berta A, Eldem BM, et al. Two-year safety
and efficacy of ranibizumab 0.5 mg in diabetic macular
edema: interim analysis of the RESTORE extension study.
Ophthalmology 2013;120:2004-12. Crossref
10. Elman MJ, Bressler NM, Qin H, et al. Expanded 2-year
follow-up of ranibizumab plus prompt or deferred laser
or triamcinolone plus prompt laser for diabetic macular
edema. Ophthalmology 2011;118:609-14. Crossref
11. Cheung N, Wong IY, Wong TY. Ocular anti-VEGF therapy
for diabetic retinopathy: overview of clinical efficacy and
evolving applications. Diabetes Care 2014;37:900-5. Crossref
12. Diabetic Retinopathy Clinical Research Network, Wells
JA, Glassman AR, et al. Aflibercept, bevacizumab, or
ranibizumab for diabetic macular edema. N Engl J Med
2015;372:1193-203. Crossref
13. Diabetic Retinopathy Clinical Research Network Writing
Committee, Bressler SB, Edwards AR, et al. Reproducibility
of spectral-domain optical coherence tomography retinal
thickness measurements and conversion to equivalent
time-domain metrics in diabetic macular edema. JAMA
Ophthalmol 2014;132:1113-22. Crossref
14. Massin P, Bandello F, Garweg JG, et al. Safety and efficacy
of ranibizumab in diabetic macular edema (RESOLVE
Study): a 12-month, randomized, controlled, double-masked,
multicenter phase II study. Diabetes Care
2010;33:2399-405. Crossref
15. Scotland GS, McNamee P, Philip S, et al. Cost-effectiveness
of implementing automated grading within the national
screening programme for diabetic retinopathy in Scotland.
Br J Ophthalmol 2007;91:1518-23. Crossref
16. Kawasaki R, Akune Y, Hiratsuka Y, Fukuhara S, Yamada M.
Cost-utility analysis of screening for diabetic retinopathy in
Japan: a probabilistic Markov modeling study. Ophthalmic
Epidemiol 2015;22:4-12. Crossref
17. Rachapelle S, Legood R, Alavi Y, et al. The cost-utility of
telemedicine to screen for diabetic retinopathy in India.
Ophthalmology 2013;120:566-73. Crossref
18. Tung TH, Shih HC, Chen SJ, Chou P, Liu CM, Liu JH.
Economic evaluation of screening for diabetic retinopathy
among Chinese type 2 diabetics: a community-based study
in Kinmen, Taiwan. J Epidemiol 2008;18:225-33. Crossref
19. Stefánsson E, Bek T, Porta M, Larsen N, Kristinsson JK,
Agardh E. Screening and prevention of diabetic blindness.
Acta Ophthalmol Scand 2000;78:374-85. Crossref
20. Lin DY, Blumenkranz MS, Brothers RJ, Grosvenor DM.
The sensitivity and specificity of single-field nonmydriatic
monochromatic digital fundus photography with remote
image interpretation for diabetic retinopathy screening:
a comparison with ophthalmoscopy and standardized
mydriatic color photography. Am J Ophthalmol
2002;134:204-13. Crossref
21. James M, Turner DA, Broadbent DM, Vora J, Harding
SP. Cost effectiveness analysis of screening for sight
threatening diabetic eye disease. BMJ 2000;320:1627-31. Crossref
22. Prescott G, Sharp P, Goatman K, et al. Improving the
cost-effectiveness of photographic screening for diabetic
macular oedema: a prospective, multi-centre, UK study. Br
J Ophthalmol 2014;98:1042-9. Crossref
23. Bresnick GH, Mukamel DB, Dickinson JC, Cole DR. A
screening approach to the surveillance of patients with
diabetes for the presence of vision-threatening retinopathy.
Ophthalmology 2000;107:19-24. Crossref
24. Jyothi S, Elahi B, Srivastava A, Poole M, Nagi D, Sivaprasad
S. Compliance with the quality standards of National
Diabetic Retinopathy Screening Committee. Prim Care Diabetes 2009;3:67-72. Crossref
25. Lian JX, Gangwani RA, McGhee SM, et al. Systematic
screening for diabetic retinopathy (DR) in Hong Kong:
prevalence of DR and visual impairment among diabetic
population. Br J Ophthalmol 2016;100:151-5. Crossref
26. Virgili G, Menchini F, Casazza G, et al. Optical coherence
tomography (OCT) for detection of macular oedema in
patients with diabetic retinopathy. Cochrane Database Syst
Rev 2015;(1):CD008081. Crossref
27. Mackenzie S, Schmermer C, Charnley A, et al. SDOCT
imaging to identify macular pathology in patients diagnosed
with diabetic maculopathy by a digital photographic retinal
screening programme. PloS One 2011;6:e14811. Crossref
28. Brown JC, Solomon SD, Bressler SB, Schachat AP,
DiBernardo C, Bressler NM. Detection of diabetic foveal
edema: contact lens biomicroscopy compared with optical
coherence tomography. Arch Ophthalmol 2004;122:330-5. Crossref
29. Browning DJ, McOwen MD, Bowen RM Jr, O’Marah TL.
Comparison of the clinical diagnosis of diabetic macular
edema with diagnosis by optical coherence tomography.
Ophthalmology 2004;111:712-5. Crossref
30. Bandello F, Cunha-Vaz J, Chong NV, et al. New
approaches for the treatment of diabetic macular oedema:
recommendations by an expert panel. Eye (Lond)
2012;26:485-93. Crossref
31. Focal photocoagulation treatment of diabetic macular
edema. Relationship of treatment effect to fluorescein
angiographic and other retinal characteristics at
baseline: ETDRS report no. 19. Early Treatment Diabetic
Retinopathy Study Research Group. Arch Ophthalmol
1995;113:1144-55. Crossref
32. Goyal S, Lavalley M, Subramanian ML. Meta-analysis and
review on the effect of bevacizumab in diabetic macular
edema. Graefes Arch Clin Exp Ophthalmol 2011;249:15-27. Crossref
33. Abu El-Asrar AM, Al-Mezaine HS. Advances in the
treatment of diabetic retinopathy. Discov Med 2010;9:363-73.
34. Wild S, Roglic G, Green A, Sicree R, King H. Global
prevalence of diabetes: estimates for the year 2000 and
projections for 2030. Diabetes Care 2004;27:1047-53. Crossref
35. Wong RL, Lee JW, Yau GS, Wong IY. Relationship between
outer retinal layers thickness and visual acuity in diabetic
macular edema. Biomed Res Int 2015;2015:981471. Crossref